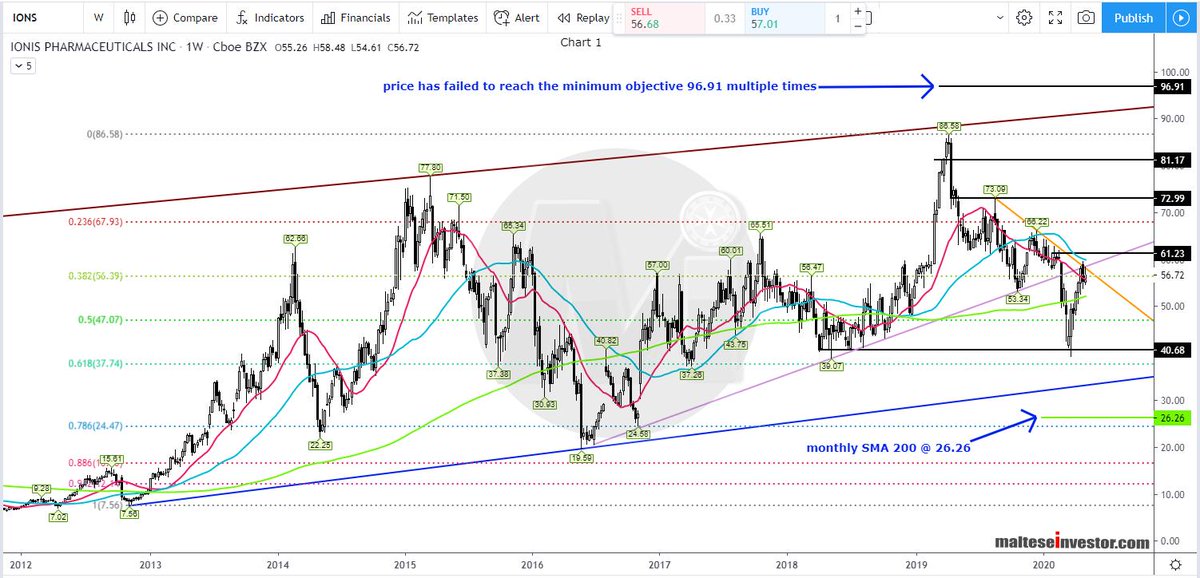
Chart 1
Weekly Chart: The Feb-Mar 2020 decline has already been partially absorbed and price is currently attempting to close above #trendline and combined #SMA 50 and 20 resistances - a break/close 165.00 is required then a close above 178.00 is #bullish for 194.80.
RACE 2/3
Weekly Chart: The Feb-Mar 2020 decline has already been partially absorbed and price is currently attempting to close above #trendline and combined #SMA 50 and 20 resistances - a break/close 165.00 is required then a close above 178.00 is #bullish for 194.80.
RACE 2/3
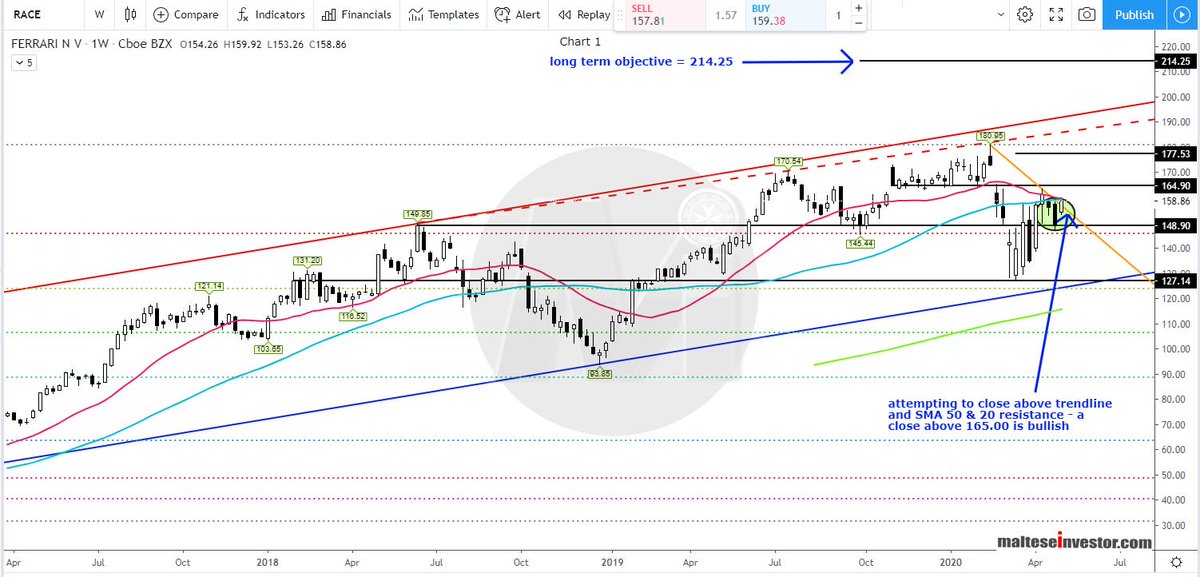
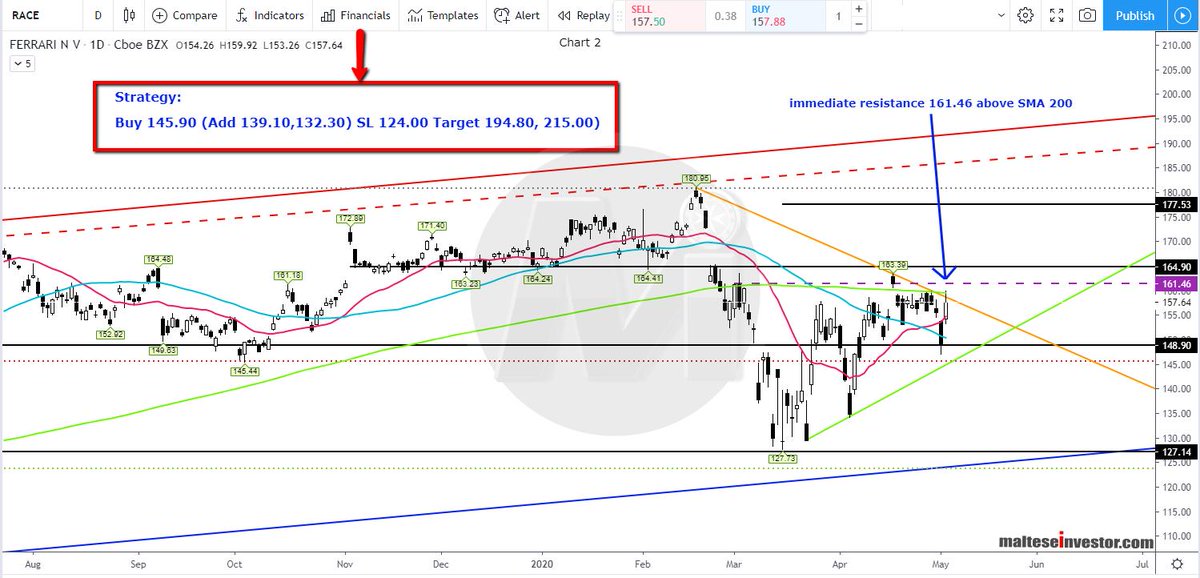
Chart 2
Daily Chart: Immediate #resistance at 161.46 just above the SMA 200 - needs to hold above for strength.
The #Strategy is printed on the image.
$RACE 3/3
Daily Chart: Immediate #resistance at 161.46 just above the SMA 200 - needs to hold above for strength.
The #Strategy is printed on the image.
$RACE 3/3