Chart 1
Weekly Chart: The long term trend is still #bullish and price is attempting to break above the 2018 falling #trendline - a close above 140.22 is required otherwise the chances of a false break will increase. The main .....
TTWO 2/4
Weekly Chart: The long term trend is still #bullish and price is attempting to break above the 2018 falling #trendline - a close above 140.22 is required otherwise the chances of a false break will increase. The main .....
TTWO 2/4

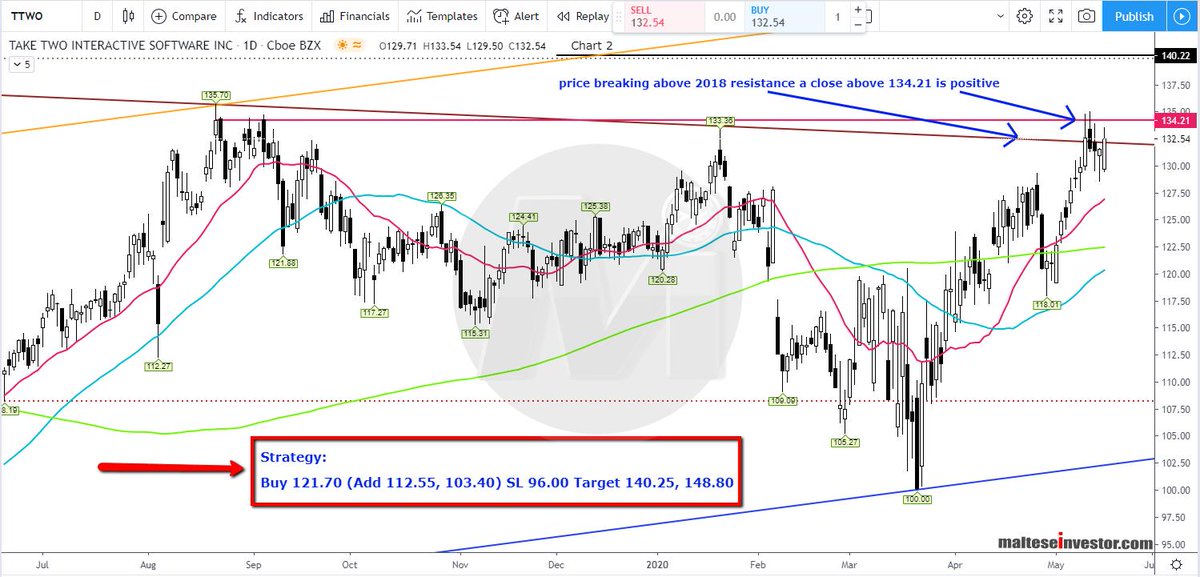
Chart 2
Daily Chart: Breaking above 2018 trendline - a close above 134.21 is bullish.
The #Strategy is printed on the image.
$TTWO 4/4
Daily Chart: Breaking above 2018 trendline - a close above 134.21 is bullish.
The #Strategy is printed on the image.
$TTWO 4/4