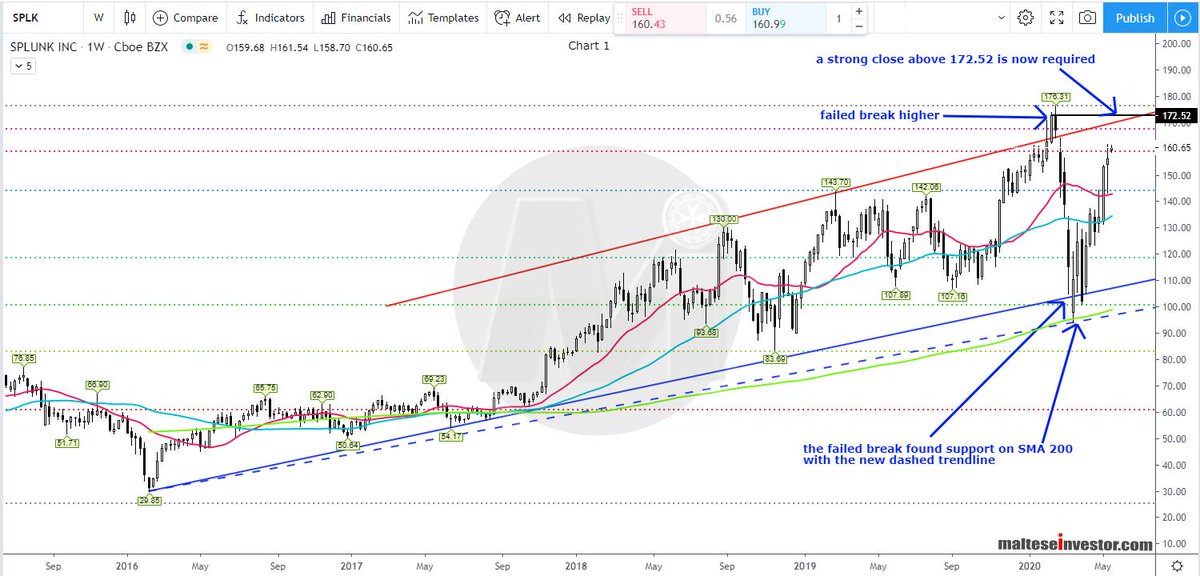
Weekly Chart: The all time high of 176.31 was followed by a huge surge downwards and price temporarily broke below the 4 year #trendline but found strong #support on the #SMA 200 and #Fib. 0.50 (100.73). All the losses .....
SPLK 2/4
SPLK 3/4
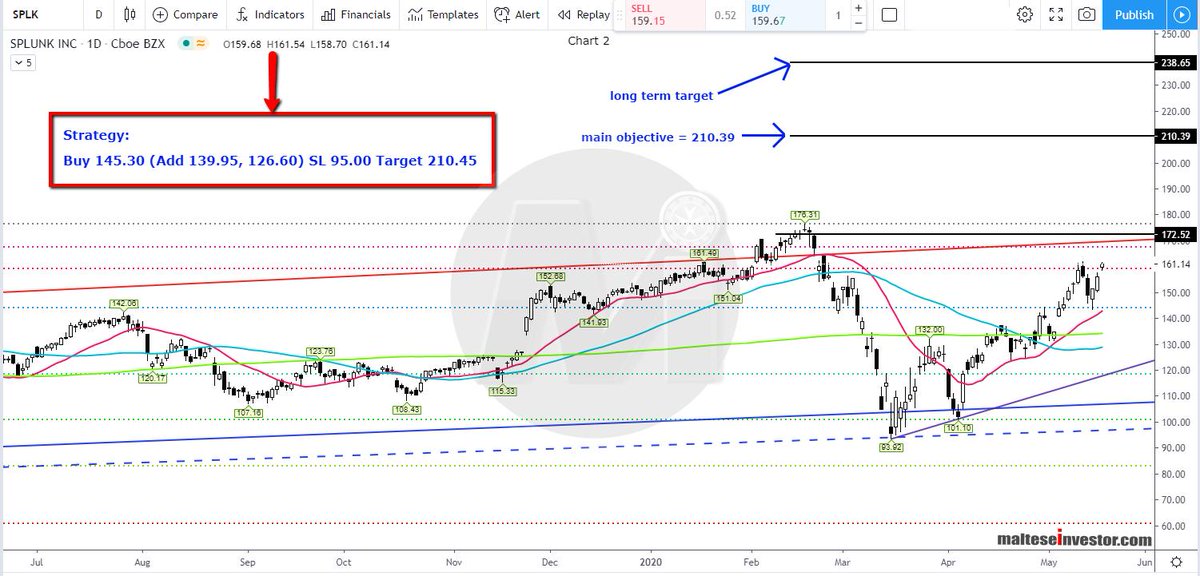
Daily Chart: Chasing the price higher is risky and we watch for a reaction above the pivot.
The #Strategy is printed on the image.
$SPLK 4/4
