My Authors
Read all threads
1/3 Update of the #covid19 situation in the hospitals of #Belgium. SEIR model is fitted on data over a short period for estimating Re. This plot is for 6-7 days.
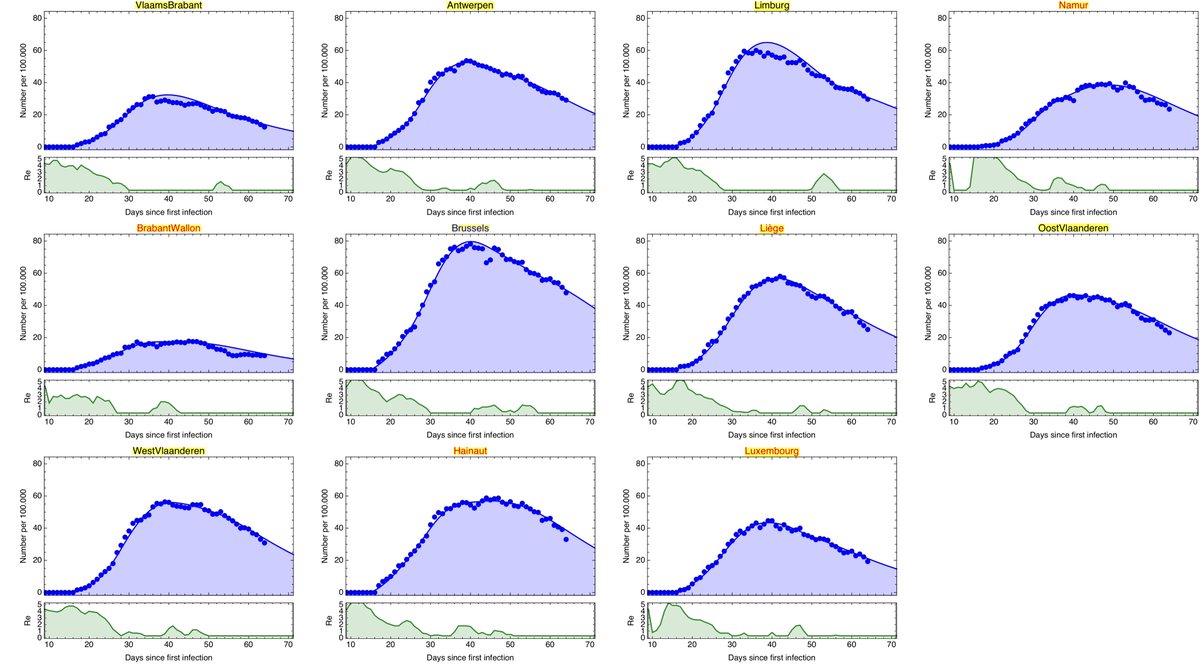
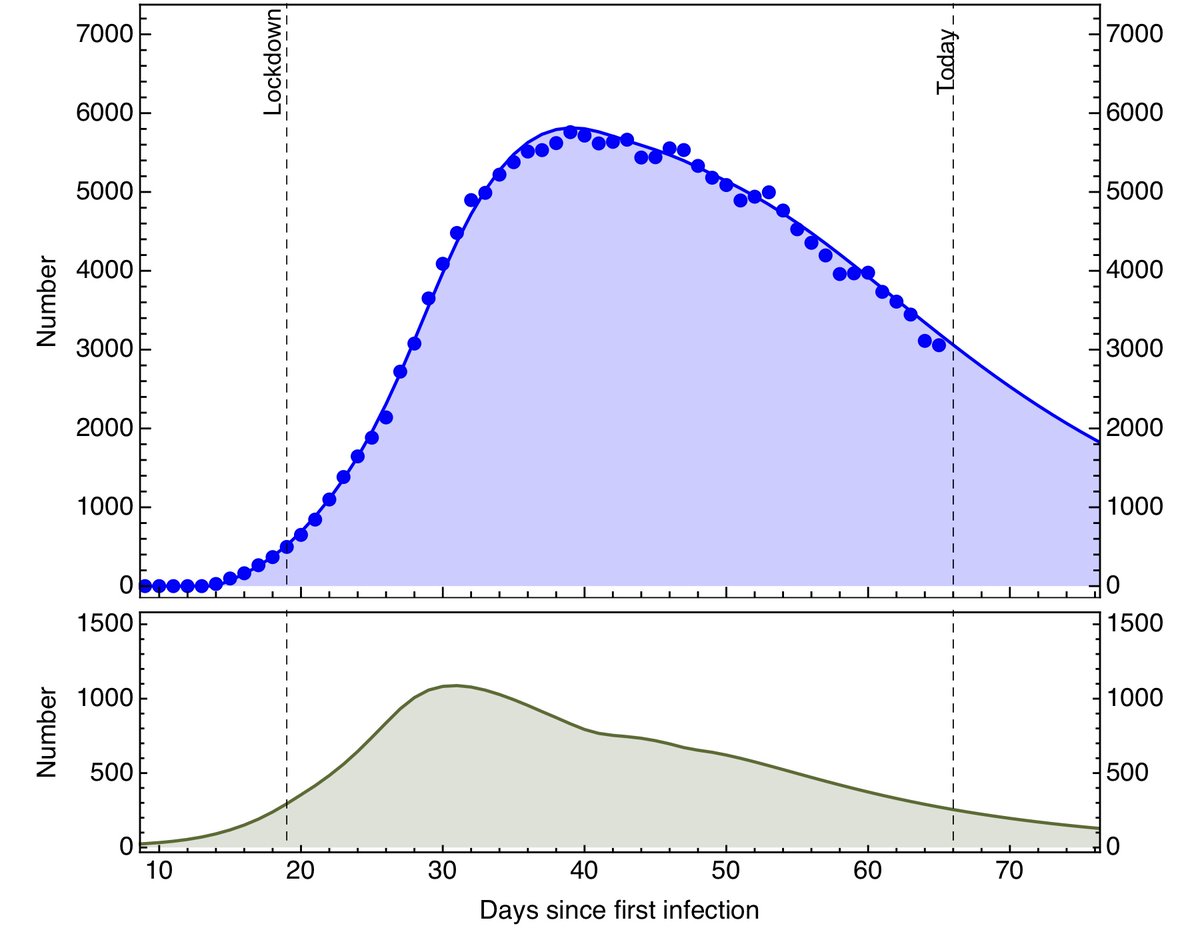
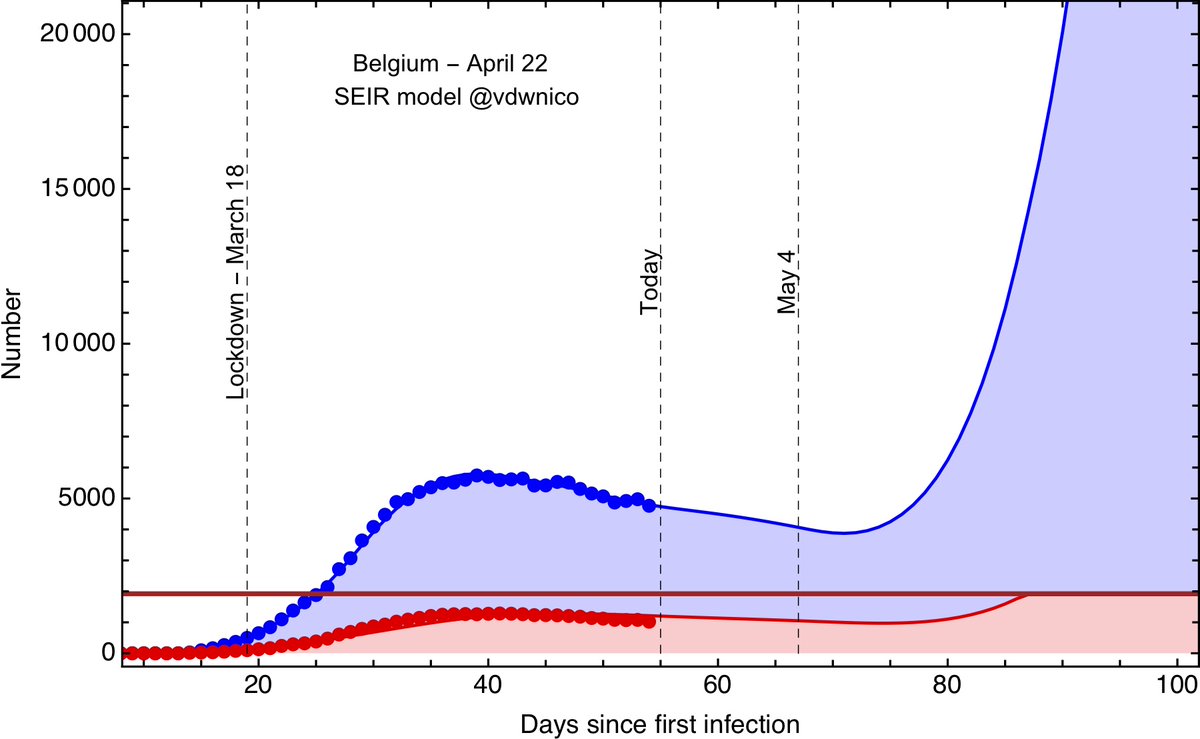
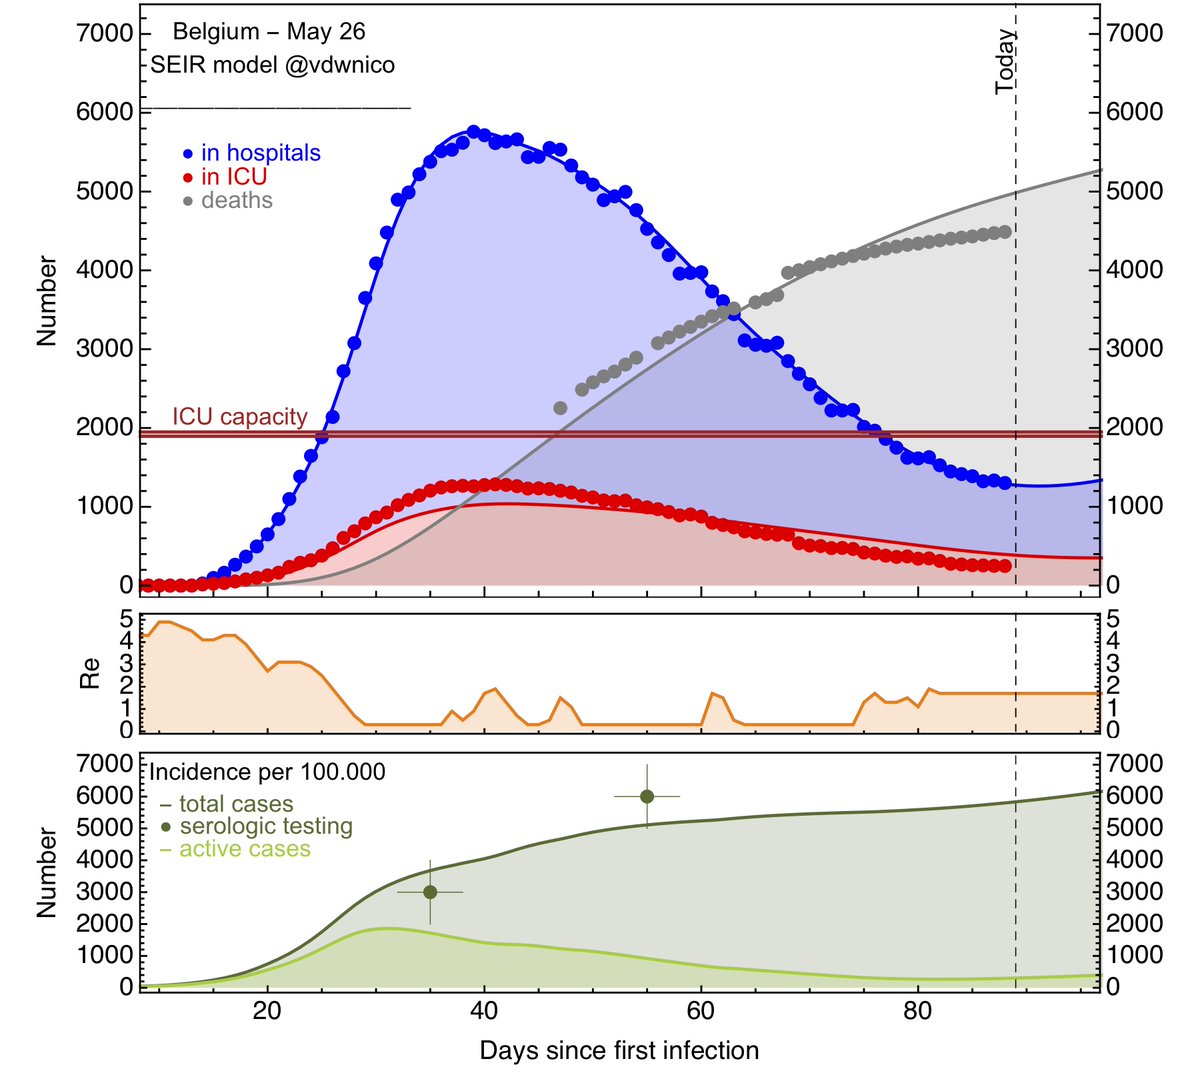
2/3 Other plots show results with longer periods. You see a longer plateau and lower values of Re. In fact the estimation is smoother and less reactive to any change, and underfits the hospitalisations (around day30)...
3/3 CONCLUSION : Fitting data is like playing golf : depending on the club you choose, a different force (Re) is applied on the ball over a different contact period. But at the end, similar ball trajectories are obtained (same trend for the fit).

Missing some Tweet in this thread? You can try to force a refresh.

Enjoying this thread?

Keep Current with Nicolas Vandewalle

Profile picture

Stay in touch and get notified when new unrolls are available from this author!

Read all threads

This Thread may be Removed Anytime!

Twitter may remove this content at anytime, convert it as a PDF, save and print for later use!

Try unrolling a thread yourself!

how to unroll video

1) Follow Thread Reader App on Twitter so you can easily mention us!

2) Go to a Twitter thread (series of Tweets by the same owner) and mention us with a keyword "unroll" @threadreaderapp unroll

You can practice here first or read more on our help page!

Follow Us on Twitter!

Did Thread Reader help you today?

Support us! We are indie developers!


This site is made by just two indie developers on a laptop doing marketing, support and development! Read more about the story.

Become a Premium Member ($3.00/month or $30.00/year) and get exclusive features!

Become Premium

Too expensive? Make a small donation by buying us coffee ($5) or help with server cost ($10)

Donate via Paypal Become our Patreon

Thank you for your support!