(THREAD) 1/ Is the market’s current valuation really as bad the Shiller CAPE suggests? In my view, the answer is no. Here’s why.
3/ But, like a blunt instrument used for precision surgery, the CAPE falls short. It doesn’t take into account interest rates, the equity risk premium or the percentage of #earnings that are being distributed back to shareholders via dividends & share buybacks.
4/ Let’s take the dot com peak in 2000. The CAPE was 44.6x. But get this: the implied equity risk premium (ERP) was negative in 2000 at around -2.5%. Today it is +4%. Also in 2000 the payout ratio was around 60%. Today it’s closer to 90%.
5/ More earnings going back to shareholders means a higher valuation is warranted, per the DCF. These are important dimensions of the valuation puzzle and, to me, show the market was even more overvalued in 2000 than the CAPE ratio suggests.
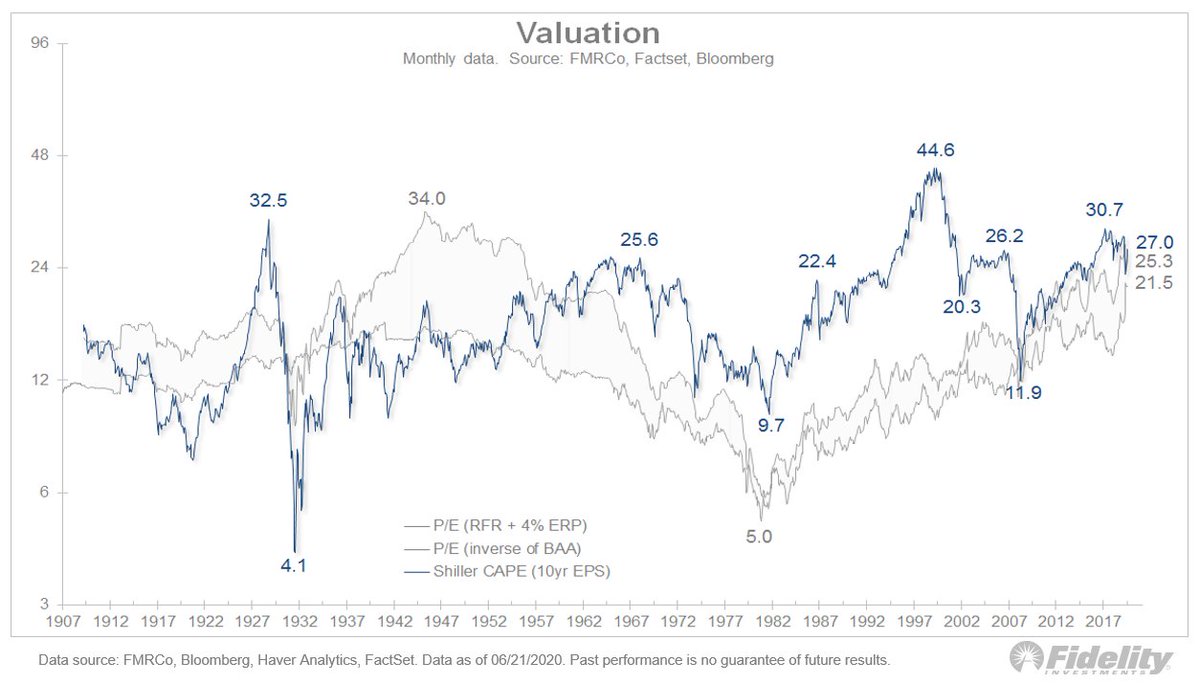
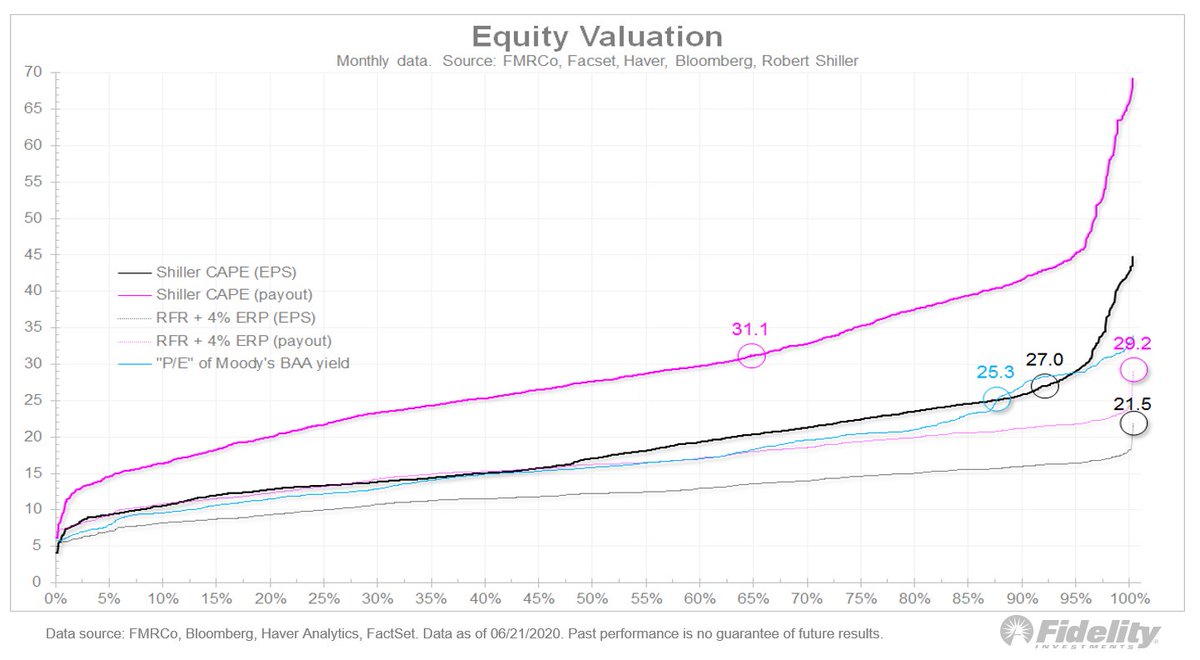
6/ Then, there is the level of interest rates. In that last chart, one gray line shows the RFR +4% ERP & the other shows the inverse (“P/E”) of the BAA yield. (The BAA investment grade yield is just the risk-free rate plus a credit spread.) The same math applies to equities.
7/ That last chart shows that, on the basis of those two metrics, the market’s current valuation is justified.
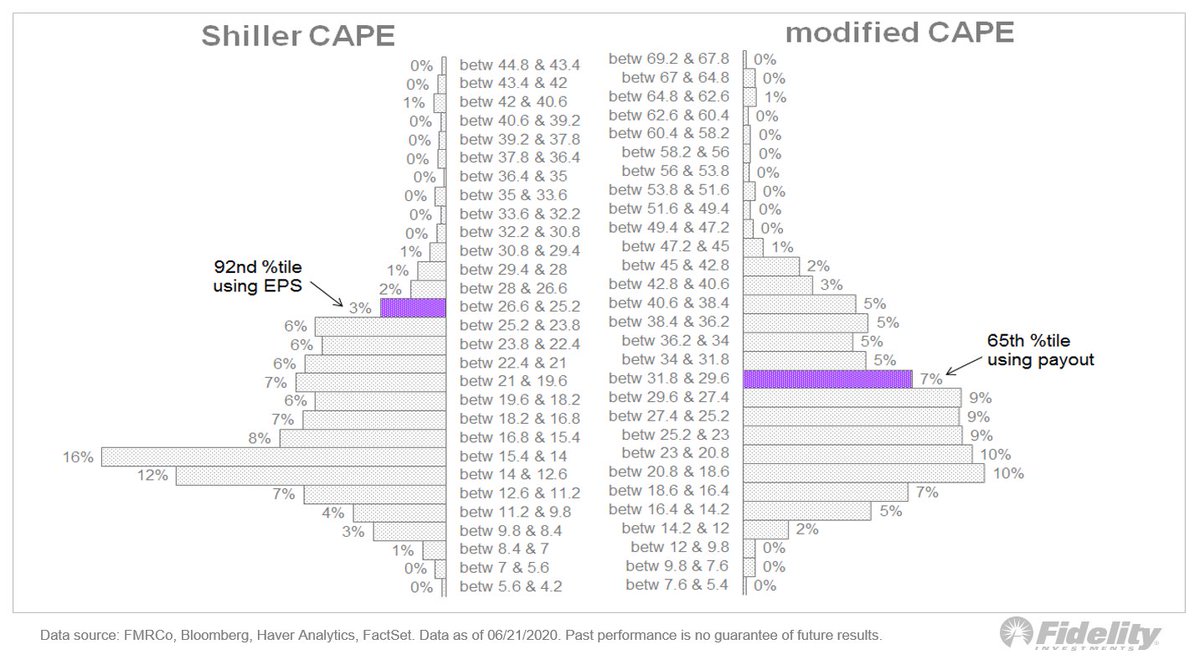
8/ Now, let’s create a modified CAPE using the payout ratio instead of #earnings. The next chart shows the 10yr CAPE using combined dividends-per-share and buybacks-per-share instead of EPS. This changes the story.
9/ This shows that the #SPX is actually at the 65th percentile instead of the 92nd. And again, using the level of interest rates and an average risk premium as a proxy, one could argue that current valuation levels seem to be more than justified. 

10/ Let’s compare the two methods. Here, you can see that using a modified CAPE that accounts for the payout (right), the market is less expensive than if we just use the EPS (left). It’s above average but not to the extreme of the commonly referenced CAPE.
11/ Now let’s look at the two versions over the past 30 years or so. Note the difference at the dot com peak.

12/ And here’s the percentile ranking since 1881.
13/ Conclusion? The CAPE ratio is widely used as evidence that the market is overvalued. But, in my view, the reality is more complex and, like the DCF, it comes down to determining the correct ERP and the role dividends and buybacks will play in the future.
14/ If it turns out that buybacks play a smaller role—which I think is plausible if there is a regime change in DC in November—then the modified CAPE will converge towards the Shiller CAPE.
15/ (END) As this chart shows, currently the level of announced buybacks is tracking well below 2018 and 2019 and is in line with 2017. Let’s watch this carefully given that it’s an election year.