(THREAD) Could the huge rally since March 23 be just a bear market rally? And how would we know? Let’s take a look at history—and some charts. #SP500 #SPX #stockmarket #investing
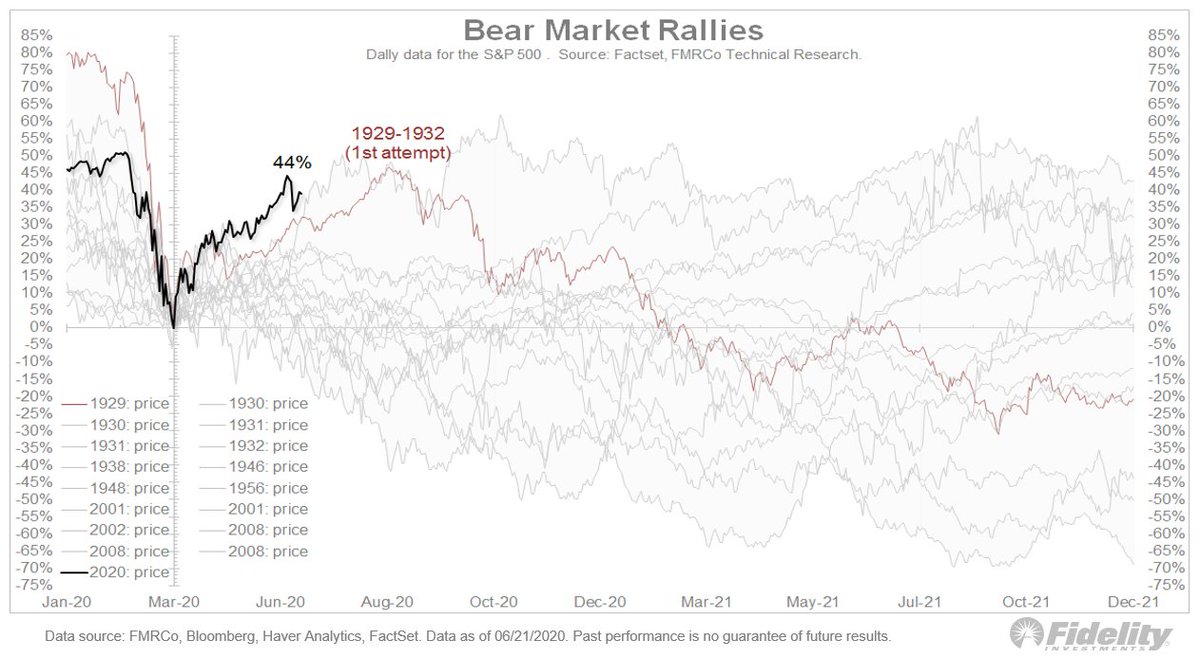
1/ Here we see that price (#SP500) and it confirms my view that, with the exception of 1929 and 1937, the power of the current rally strongly suggests that a new #bullmarket is underway. 
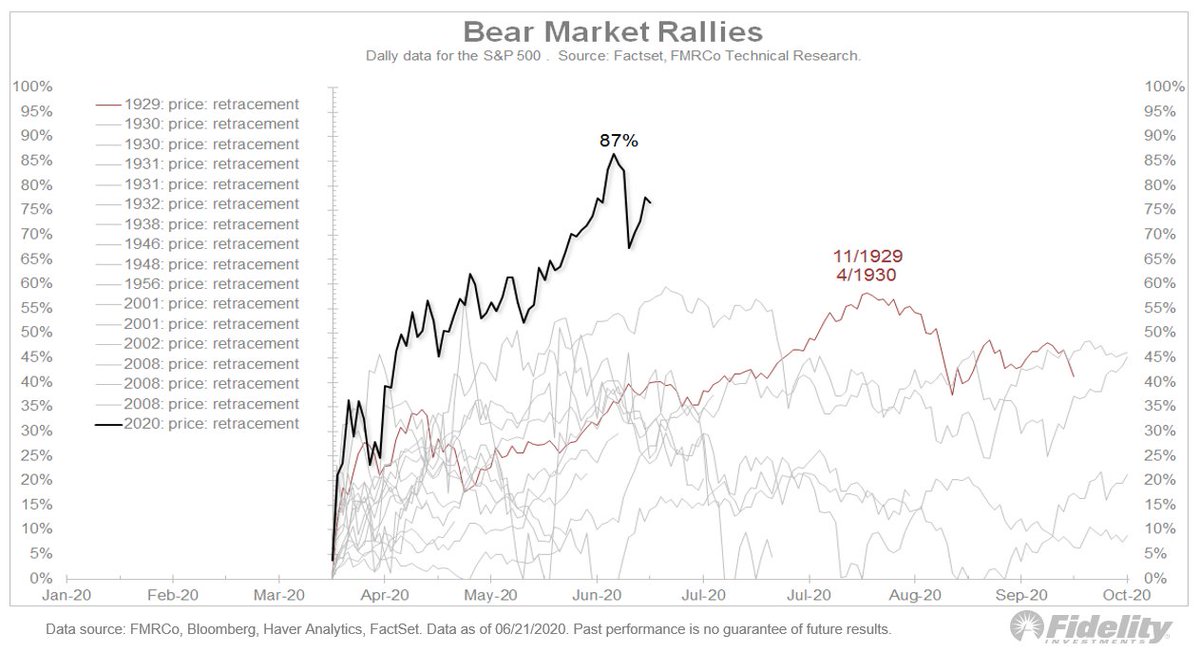
2/ This chart shows the retracement of the preceding decline. The current retracement far exceeds the others, but I think that’s probably just a byproduct of the fact that we have only declined 35% so far, whereas some of the prior bear markets produced declines of 50%-90%. #SPX
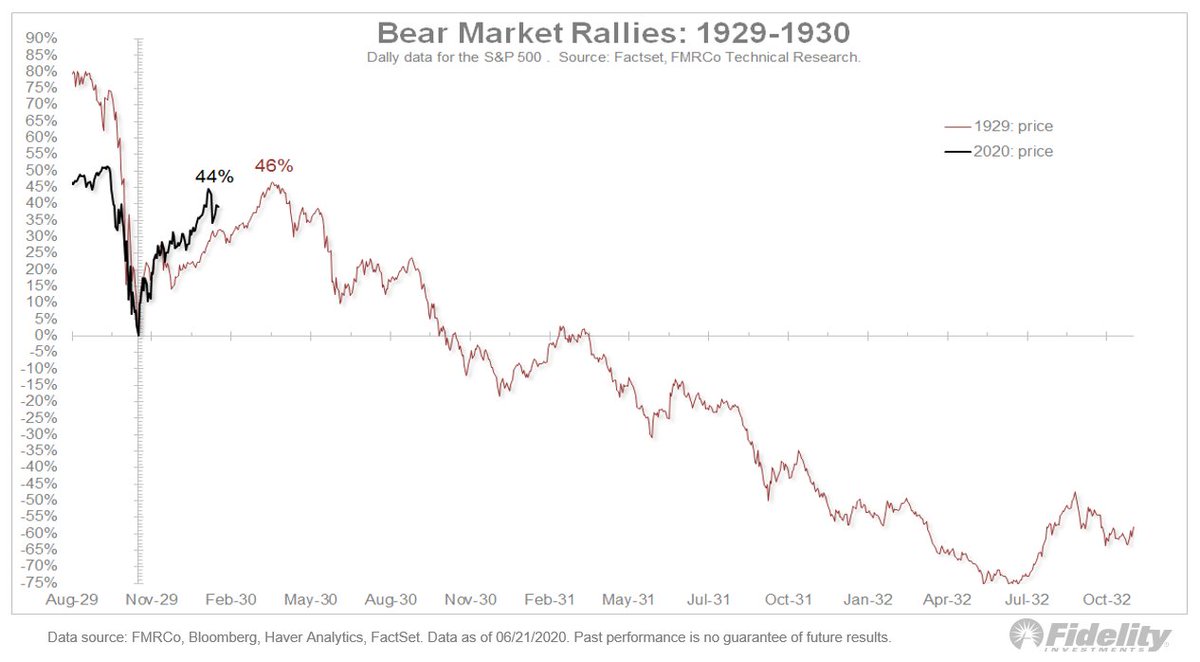
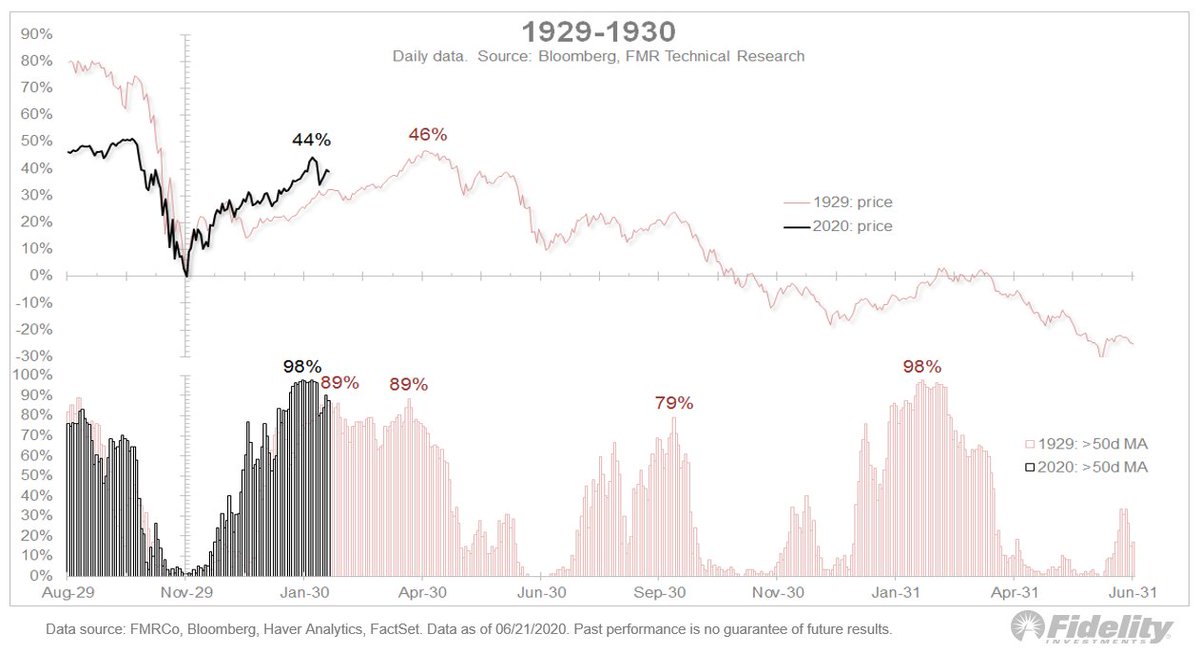
4/ The 1929-1932 analog: So far, the #SPX has gained 44% whereas, from the November 1929 trading low to the April 1930 trading high, it gained 46%. We all know what happened next during the 1929-1932 cycle, with the market falling 86% in total.
6/ The 1937 peak ushered in the 2nd wave of the Great Depression. Again, we see some similarities for both price (up 51% from the March 1938 low) & breadth (100% of issues above their 50d MA).
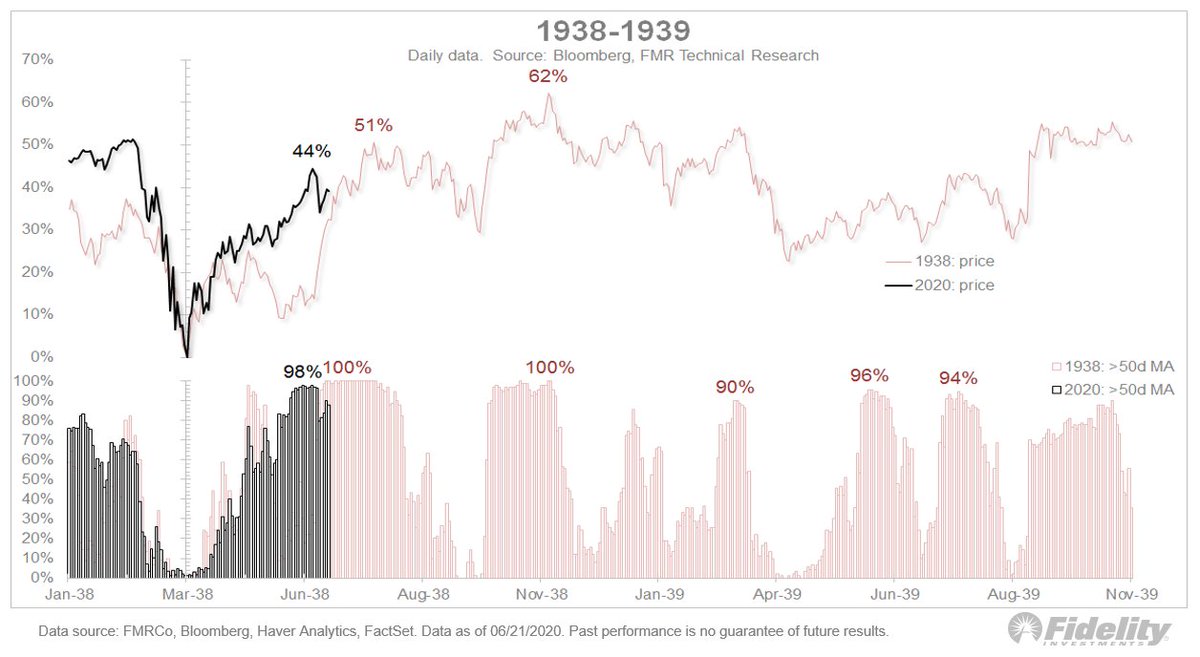
7/ The market went on to gain 62% from the low, but then remained in a large trading range. It didn’t bottom until ‘42 when the US entered WWII & the #Fed sprang into action.
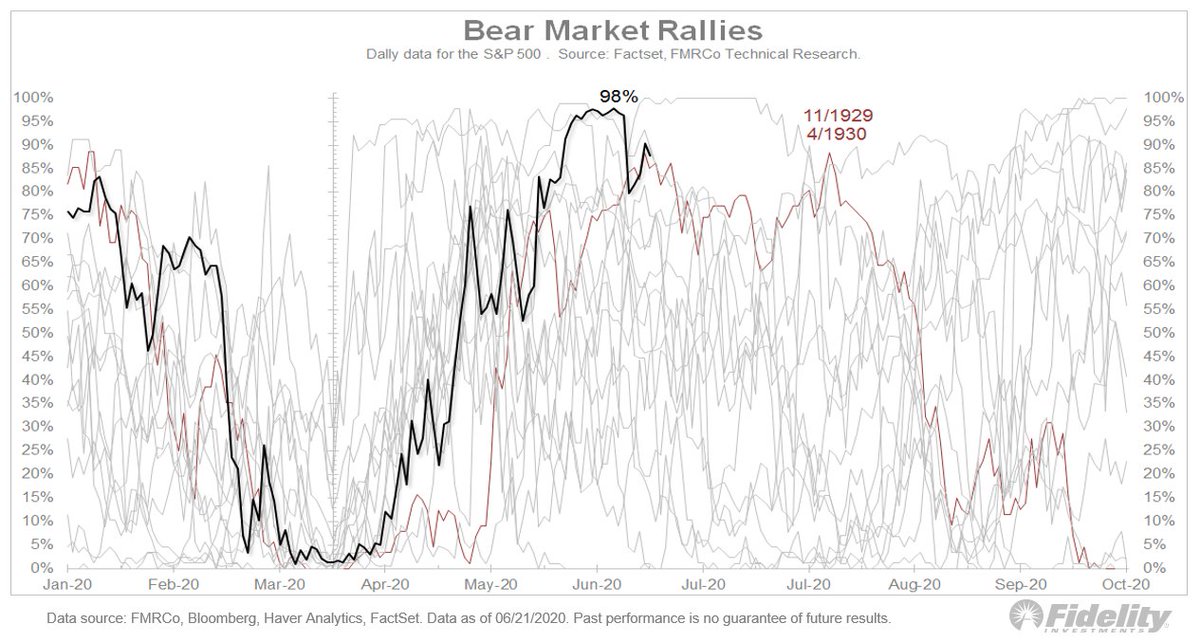
8/ So that’s a sign that there is nothing in the charts currently (in terms of price and breadth) that guarantees that the current rally is not a bull trap on the way to new lows. Having said that, I do think the lows are in. This isn’t another 1929 or 1937.
9/ Part of what makes the system dynamic rather than static is the policy response. Today’s monetary & fiscal policy couldn’t be more different than the policies 90 years ago.
10/ Here, an overlay of the 1920s & 1930s with today. The #SPX total return lines are not on the same scale. Bottom panel: Monetary policy backdrop. Again: today isn’t 1929 or 1937.
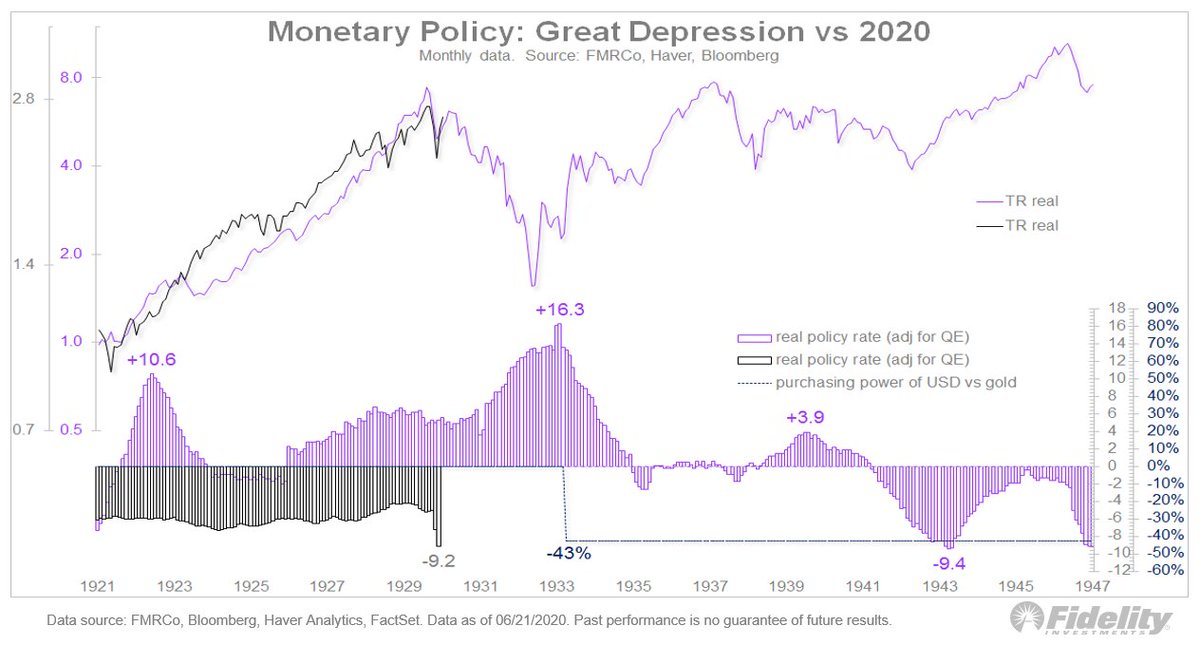
11/FINAL Remember, in April 1933 the government finally reflated by devaluing the dollar vs gold (-43%), but that was a year after the market had lost most of its value (-86%). Too little too late. This time, the Fed has added $3 trillion in two months.