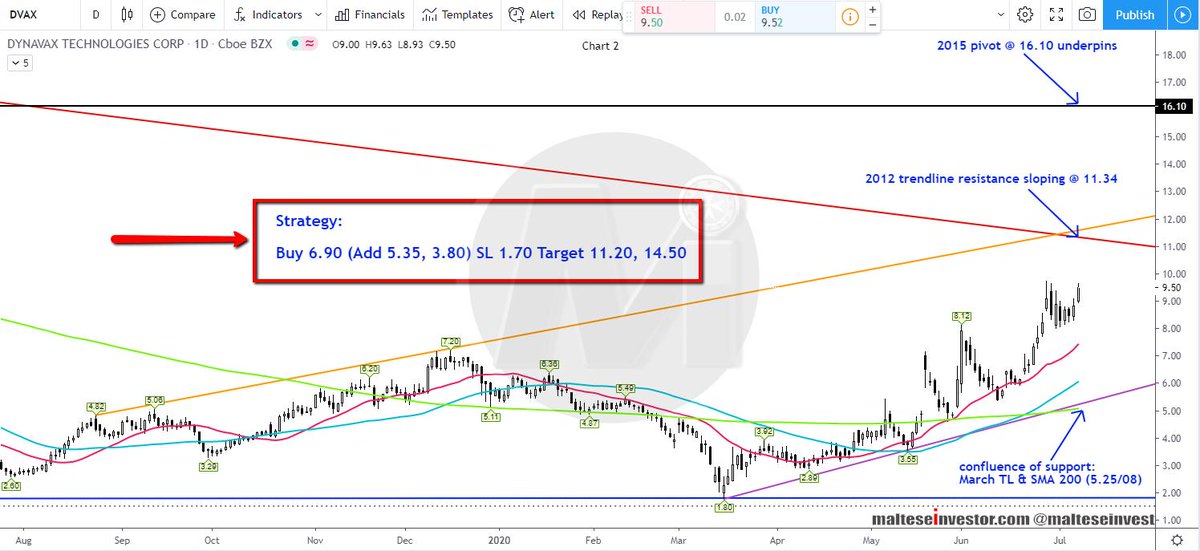
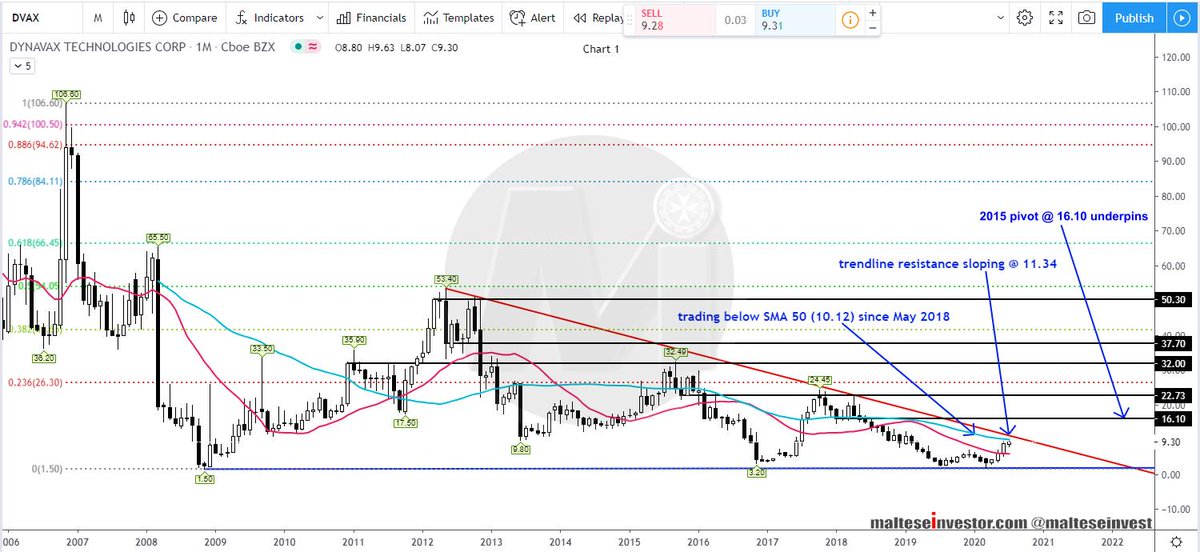
Monthly Chart: Price has been unable to close back above the #SMA 50 since May 2018, currently valued at 10.12 higher above 8 year trendline #resistance at 11.34. The 2015 #pivot at 16.10 continues to underpin the upside, a close above targets 22.73.
DVAX 2/3
Daily Chart: Positive #momentum has been building since May 2020. Immediate #support is seen at 6.90 then the #confluence of #trendline and SMA 200 at 5.25/08 respectively.
The #Strategy is printed on the image.
$DVAX 3/3
