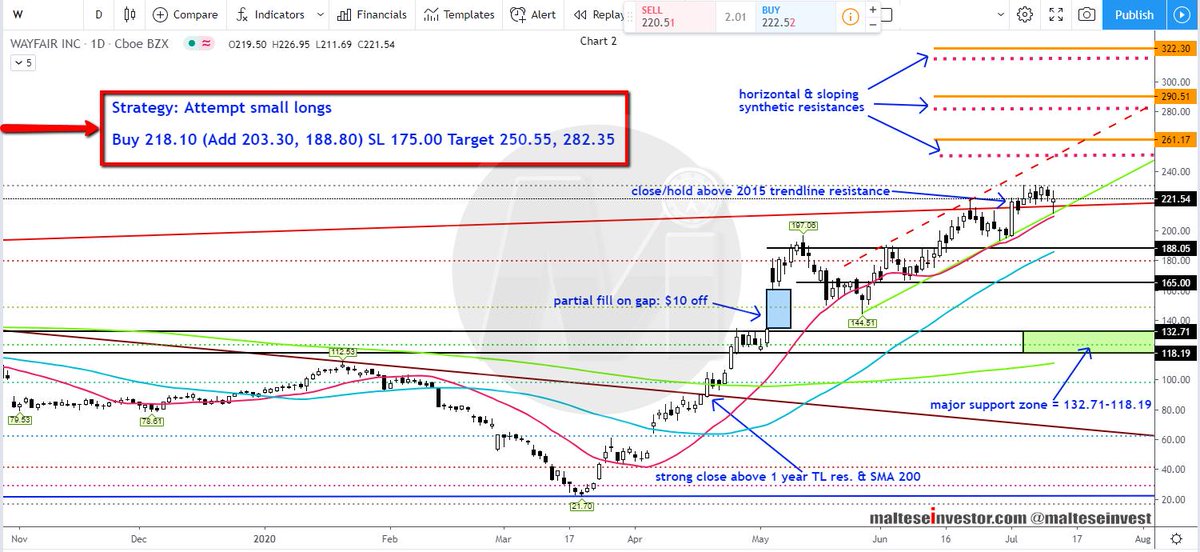
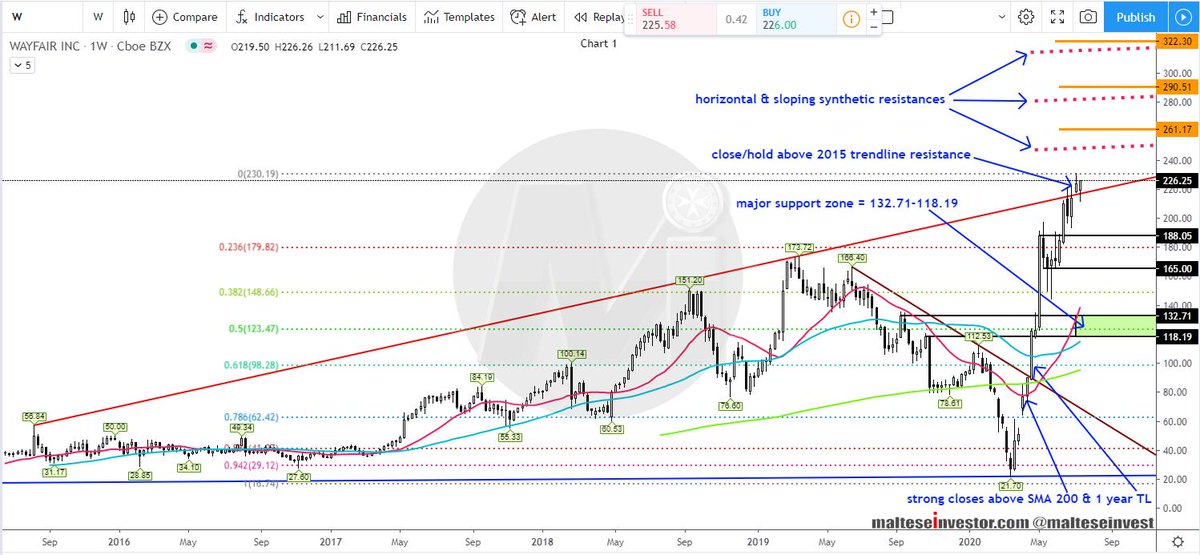
Weekly Chart: The losses seen in Q1 2020 have been absorbed and price went #parabolic, reclaiming the #SMA 200 and closing strongly above 1 year #trendline resistance. Price has also closed above 2015 trendline #resistance - the immediate target is 250.56 - 251.62.
W 2/3
Daily Chart: A gap is still unfilled by $10. A #confluence of support: SMA 20, May 2020 trendline and SMA 50 will soon #support the 188.05 #pivot. Attempting small longs. Conditions are tricky as major support lies far below.
The #Strategy is printed on the image
$W 3/3
