My Authors
Read all threads
Okay, here we go! Gather round!!
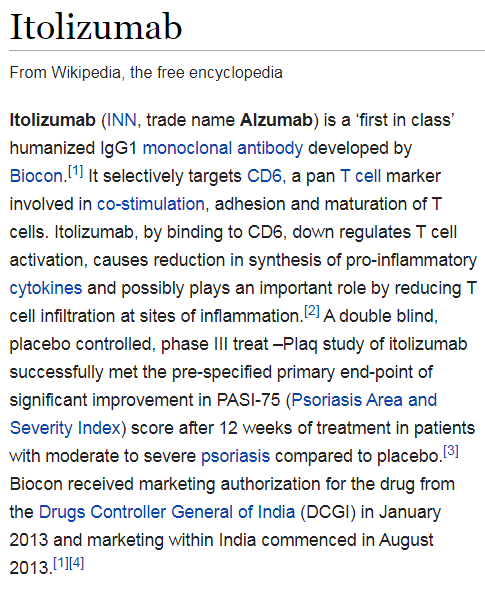
Ive got some simple stochastic modelling to share with y'all interested in the statistical apects of @Bioconlimited's trial of #Itolizumab. Bear with me while I put on my best Professorial air. Computer code and charts coming up, all in R.
Pay attention now, class! silence please there in the back row, yes you guys from #'BigPharma, put away your iPhones and listen.
Here is the Q. If A) the background mortality is 10% and I treat 'em all with 1 ml of pure saline. how many out of 20 wud die? Let's model this.
Look at this simple computer code in R. I am simulating what would happen in real life - stochastic modeling at its simplest. I am going to pretend I can take 10,000 samples each of size 20. and let R tell me how many in each sample will die given the background Prob(Death) = 0.1
It is a simple for:next loop that runs 10,000 times. I've initialised a variable called deaths. This is a vector that will hold the number of deaths in each of the 10,000 experiments I do - each with 20 patients. Next in each turn of the loop, the sample() function does the work
It samples from "Alive" and "Dead" with a 0.9 probability of picking alive and 0.1 Dead This simulates the probability of death = 0.1. Okay? Are we all on the same page with this? Next the sum() functions adds up the number of 'Deads' and attaches it to the Deaths variable
The last line - plot(...) displays a simple plot of the frequency of each no of deaths in this sample of 10,000. Okay lets run this code. What I get is this chart. Now, Class, what is this chart telling us of the long run probability of getting 0 deaths in sample of 20?
MCQ time, just to make sure no one has nodded off:
The proibability of observing 0 deaths in a sample of 20 patients each with a 10% probability of dying, from this simulation is:
All those who chose D please leave now, this #tweetorial is clearly not for you. If you are from the drugs regulator then heaven help us. If you're from Biocon ltd then please ask for more CPD. All those who chose C, about 12.5%, well done, but don't expect a job in #BigPharma
CONCLUSION:
Under the assumption that the long run background mortality risk = 10% then whatever we give to a sample of 20 patients we have a 12.5% chance of observing zero deaths. So if we give INR 40k worth of #Itoluzimab, p=12.5% that we shout Eureka! in error.
Class dismissed. Any questions?
Post class questions that I have had.
1. Whats the p value here.
A. In the simulation I had 1250 samples out of 10,000 in which there were exactly zero deaths. everybody had a 0.1 prob of dying.
P = 1250/10,000 = 0.125 = 12.5%.
Q How do you interpret this p value?
If the Null hypothesis is true then in any given sample of 20 cases that we treat we will see zero deaths with a 12.5% probability. I could do an experiment with a puff of air in the left ear hole and claim I found a cure in 12.5% of such trials
Missing some Tweet in this thread? You can try to force a refresh.

Keep Current with JayEnAar

Profile picture

Stay in touch and get notified when new unrolls are available from this author!

Read all threads

This Thread may be Removed Anytime!

Twitter may remove this content at anytime, convert it as a PDF, save and print for later use!

Try unrolling a thread yourself!

how to unroll video

1) Follow Thread Reader App on Twitter so you can easily mention us!

2) Go to a Twitter thread (series of Tweets by the same owner) and mention us with a keyword "unroll" @threadreaderapp unroll

You can practice here first or read more on our help page!

Follow Us on Twitter!

Did Thread Reader help you today?

Support us! We are indie developers!


This site is made by just two indie developers on a laptop doing marketing, support and development! Read more about the story.

Become a Premium Member ($3.00/month or $30.00/year) and get exclusive features!

Become Premium

Too expensive? Make a small donation by buying us coffee ($5) or help with server cost ($10)

Donate via Paypal Become our Patreon

Thank you for your support!