1) Lot's of talk about the CBOE Equity Put/Call Ratio reaching an extreme low, but...
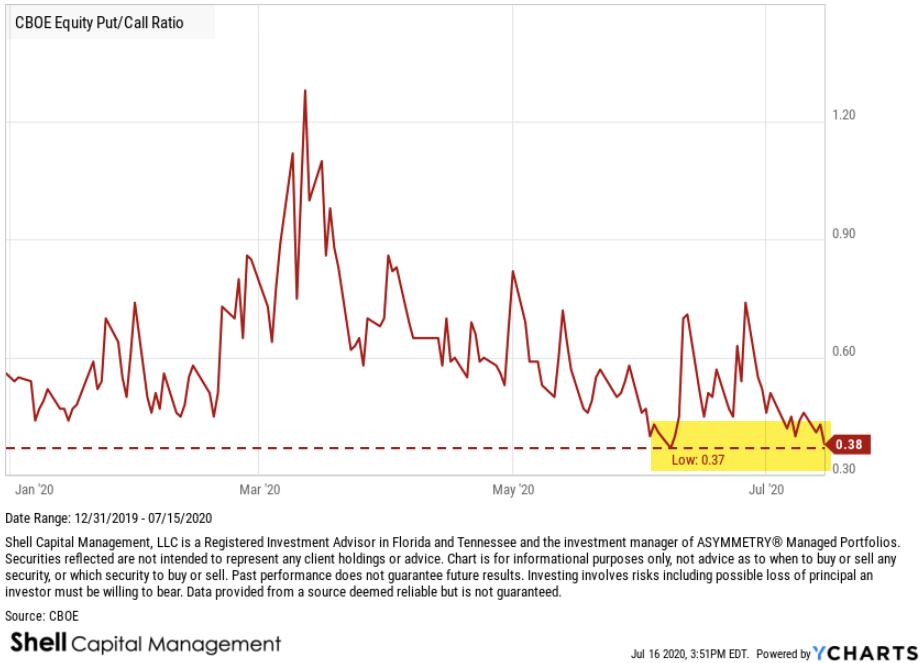
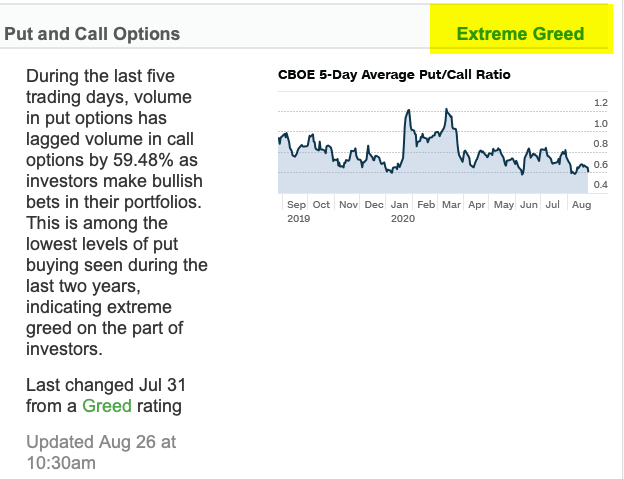
2) Yes, indeed, the CBOE Equity Put/Call Ratio reaching an extremely low level. In fact, it's as low as it has ever been going back to 2006.
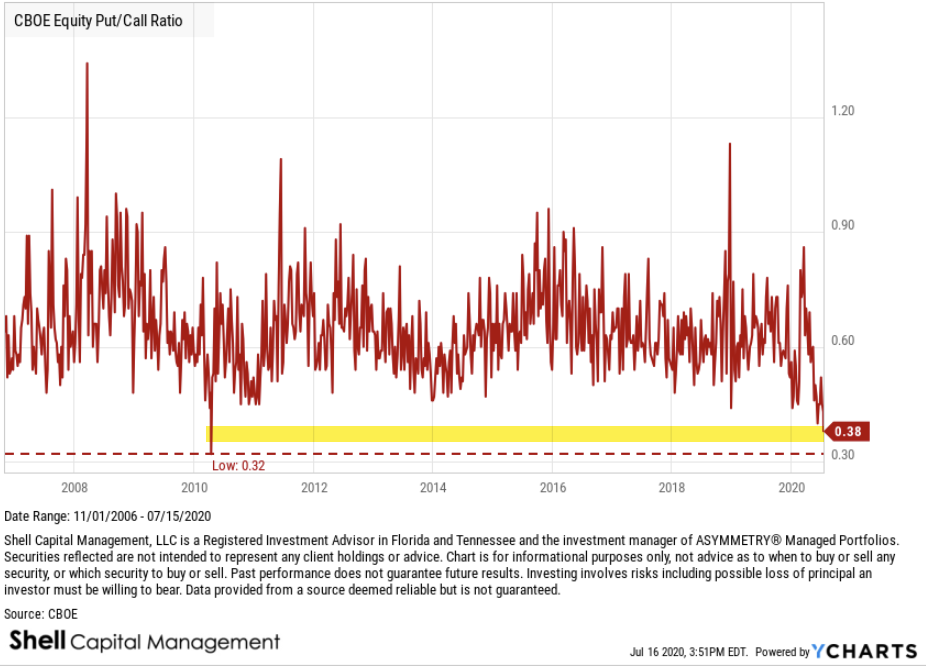
3) Normally, we consider such a low level to be an example of extreme complacency and GREED DRIVING THE MARKET. For example, the CBOE Equity Put/Call Ratio is the first of seven indicators used in the Fear & Greed Index.
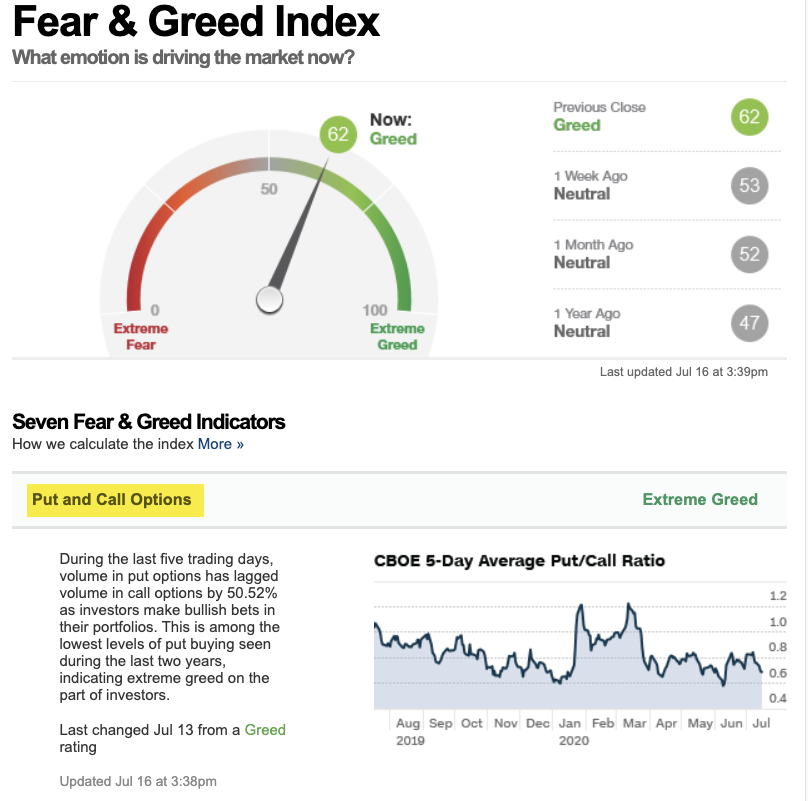
4) When the ratio is trending down and at a low level, it's because equity Call option volume is greater than the equity Put option volume. When there's more trading volume in equity calls, we assume options traders buying speculative calls, so they are bullish. VERY bullish now.
5) When the market is so one-sidedly bullish, it's a contrarian indicator suggesting over-enthusiasm. That is, we assume the calls are mostly speculative positions and puts are defensive, so the demand is on the long side. It's an imperfect assumption, but I generally agree.
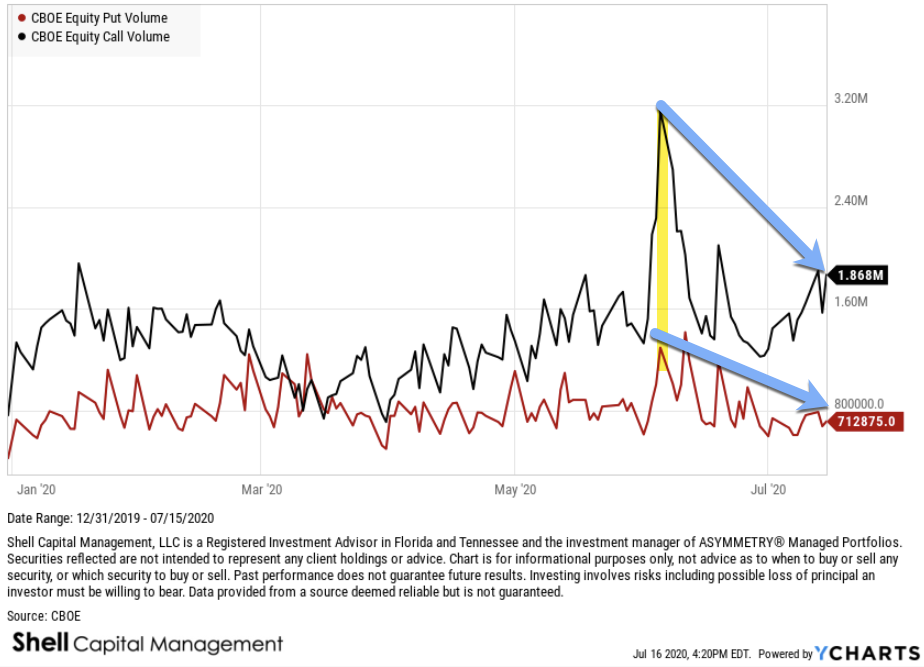
6) I pointed out a similar extreme read out early June, when Call Volume spiked up to a historically high level. Indeed, the stock market had a -6% down day afterward. This time is a little different, and the chart shows why. Call volume isn't nearly as high, relatively speaking.
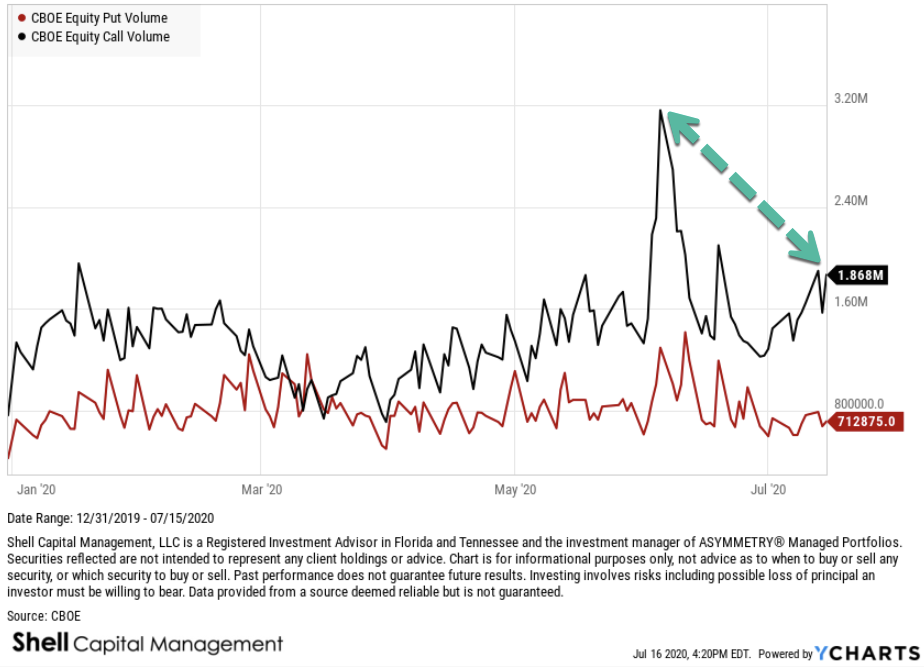
7) Call volume isn't as high as it was in June, but put volume is also lower. So, the ratio is at the same low level at 0.38, but the absolute volume is different. It's still probably an indication of enthusiasm and complacency, but it may not have the delta it had last time.
and if you liked this one, you'll love the next:

@SoberLook ☝🏼

• • •

Missing some Tweet in this thread? You can try to force a refresh
 

Keep Current with Mike Shell

Mike Shell Profile picture

Stay in touch and get notified when new unrolls are available from this author!

Read all threads

This Thread may be Removed Anytime!

PDF

Twitter may remove this content at anytime! Save it as PDF for later use!

Try unrolling a thread yourself!

how to unroll video
  1. Follow @ThreadReaderApp to mention us!

  2. From a Twitter thread mention us with a keyword "unroll"
@threadreaderapp unroll

Practice here first or read more on our help page!

More from @MikeWShell

Aug 26, 2020
Fear & Greed Index tracks seven indicators of investor sentiment. It's gradually dialing back up to Greed, but not yet Extreme Greed. Image
But when we take a look inside, and understand how it works, I see the main holdout is the . At around 22, the VIX still indicates a moderate level of FEAR, but we have to consider #VIX is fading from its highest level, ever, so its absolute level may not be as indicative. Image
On the other hand, the level of the Put/Call Ratio is among the lowest levels of put buying seen during the last two years, indicating EXTREME GREED on the part of investors. Image
Read 9 tweets
Jul 17, 2020
1) Does hedging market risk with options work on stocks?

We have several ways to direct and control the risk of loss and drawdown. We can:

Sell to reduce exposure in uptrends
Apply trend following to sell after a trend reverses
Hedge dynamically when risk is high
Hedge always
2) The Cboe S&P 500 5% Put Protection Index is designed to track the performance of a hypothetical strategy that holds a long position indexed to the S&P 500® Index and buys a monthly 5% out-of-the-money S&P 500 Index (SPX) put option as a hedge, and rolls on a monthly basis.
3) So, the index is an example of "always hedged", so let's see how it's going since it started in 2015. Over the past 5 years, it had some lag due to the cost of 5% OTM put options for protection. Here, I left out 2020 to show how it looked.
Read 9 tweets
Jul 17, 2020
1) A Bollinger Band is an observation of historical REALIZED VOLATILITY above/below a simple moving average of the price trend. It's an adaptive trading band as it adjusts to volatility swings in price. We can see volatility is dynamic, not static, over time. THREAD: Image
2) Placing a channel of volatility above/below the price trend allows us to see if prices are high/low on a relative basis. By definition, the price is HIGH at the UPPER band and the price is LOW at the LOWER band. The odds are best when the price trends outside the range. Image
3) Here I used Netflix as an example. Euphoria drove its price WAY above its *normal* range, suggesting the outlier move was likely to retract back to a normal range. That is, the "price was high" and while momentum is good, when it's too good it's prone to fail. Image
Read 9 tweets
Feb 4, 2020
@AndrewMcCurdy2 I like trends and drawing charts, so here is a few before I get in my pool heated with natural gas and solar :) and I'll add you here, too @jdouglaslittle Fossil Production and Renewable.
@AndrewMcCurdy2 @jdouglaslittle different perspective:
@AndrewMcCurdy2 @jdouglaslittle Coal production in a downtrend
Read 10 tweets
Jan 31, 2020
#Momentum isn't all the same. The parameters such as time frame of lookback, how momentum is defined as an equation, position sizing method, and any volatility type overlays can have a material impact.
But on the downside, all three of these #Momentum momentum indexes trended together, which tells me the edge of the S&P Momentum index was in getting exposure to higher upside momentum stocks that continued their trends.
Here is the same time frame as above, 3 years, and we see on #Momentum index significantly captured the velocity of momentum and dominated in relative strength.
Read 4 tweets
Jan 31, 2020
#Momentum leads #Value over the past 30 days, too.
In fact, #Momentum leads #Value on the downside as well, by not drawing down as much. I said last week momentum was positioned defensively. The rotations this time has helped on the downside.
Read 9 tweets

Did Thread Reader help you today?

Support us! We are indie developers!


This site is made by just two indie developers on a laptop doing marketing, support and development! Read more about the story.

Become a Premium Member ($3/month or $30/year) and get exclusive features!

Become Premium

Don't want to be a Premium member but still want to support us?

Make a small donation by buying us coffee ($5) or help with server cost ($10)

Donate via Paypal

Or Donate anonymously using crypto!

Ethereum

0xfe58350B80634f60Fa6Dc149a72b4DFbc17D341E copy

Bitcoin

3ATGMxNzCUFzxpMCHL5sWSt4DVtS8UqXpi copy

Thank you for your support!

Follow Us on Twitter!

:(