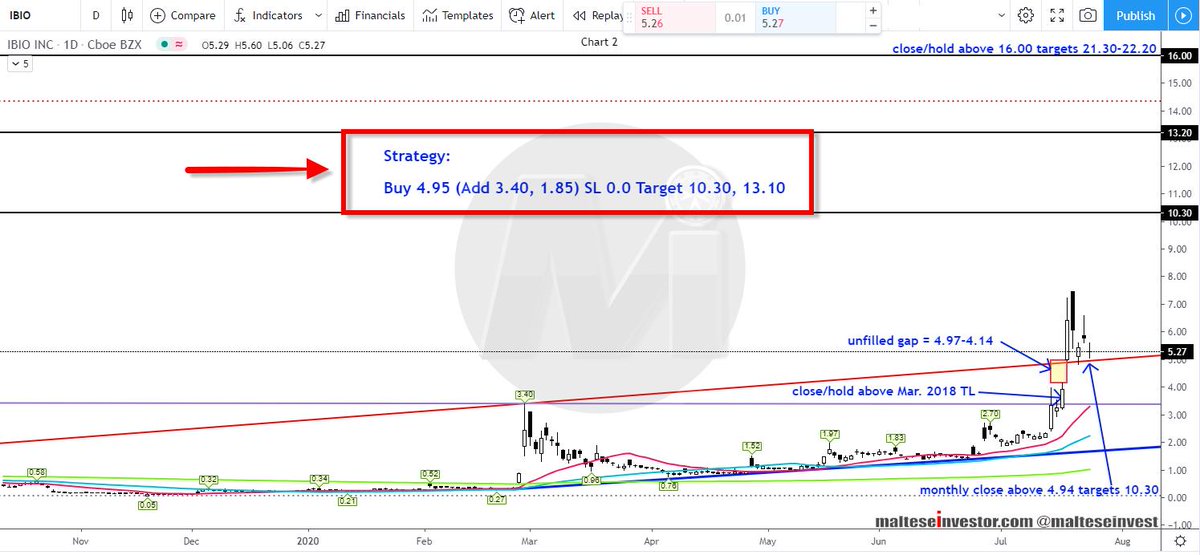
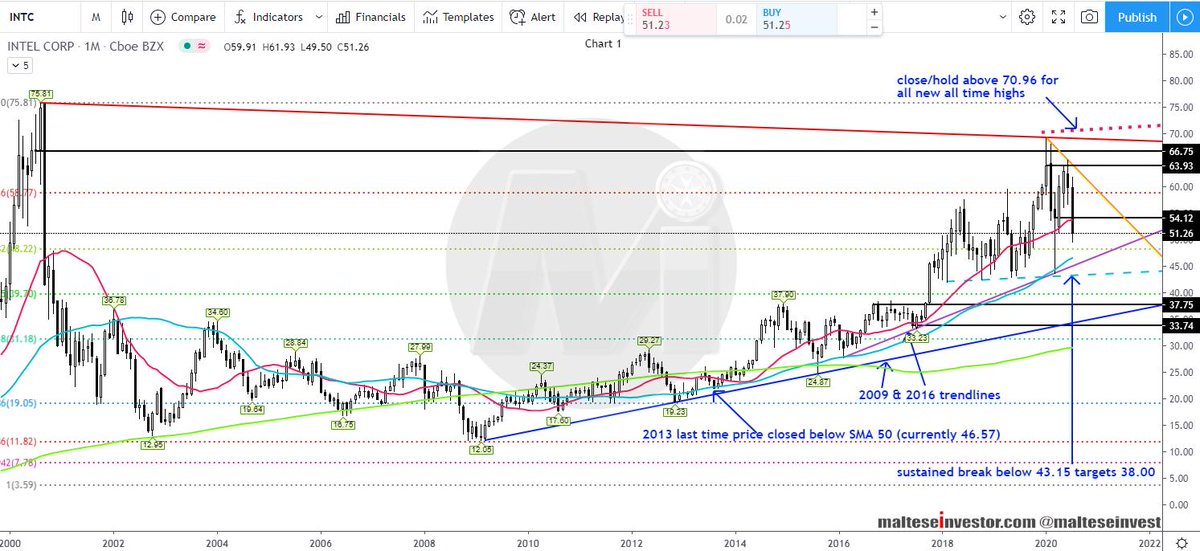
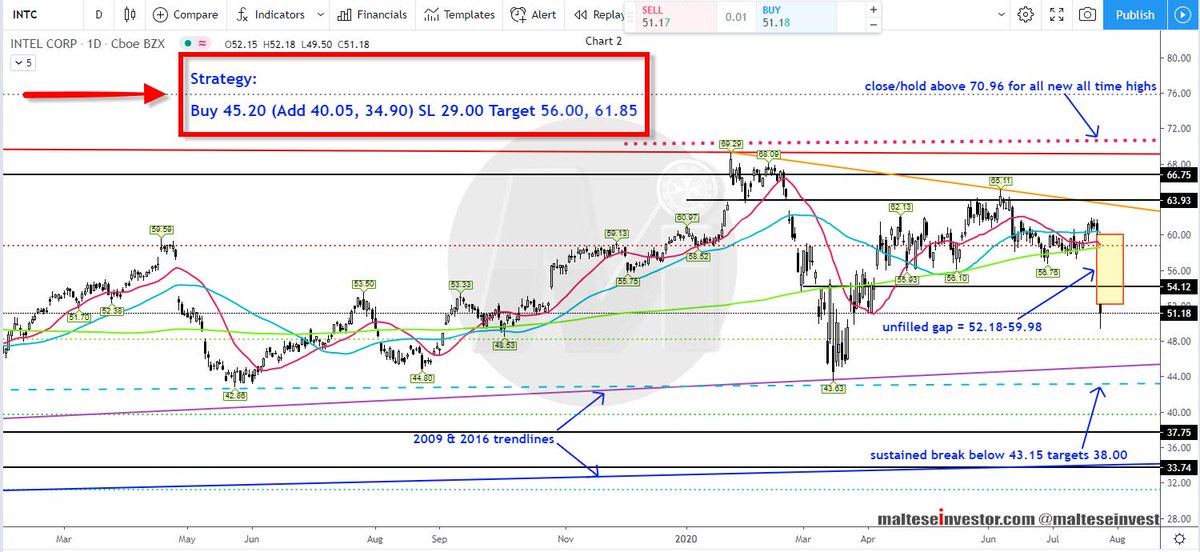
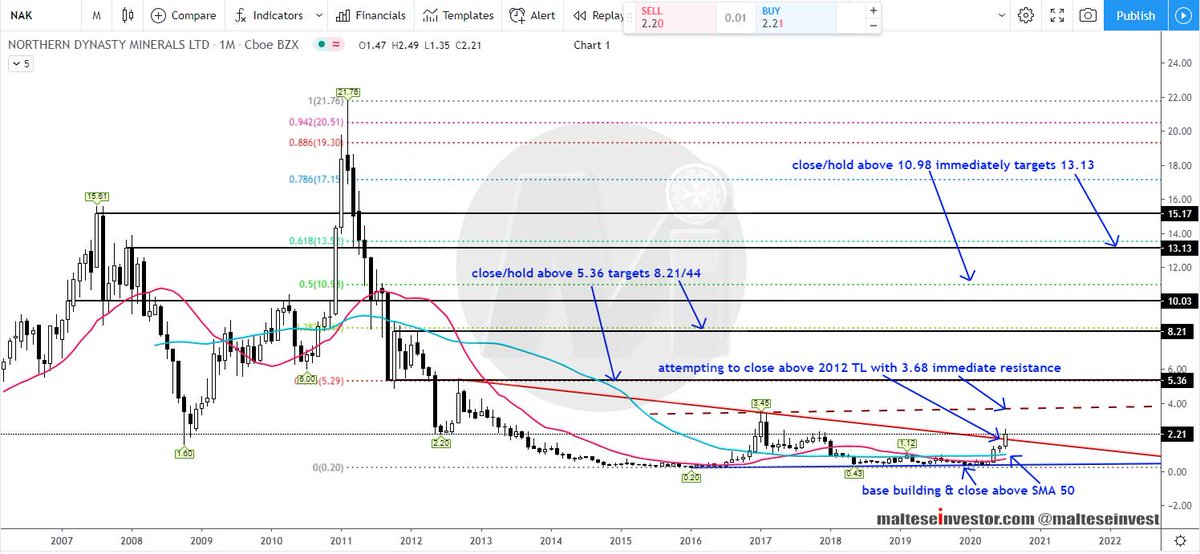
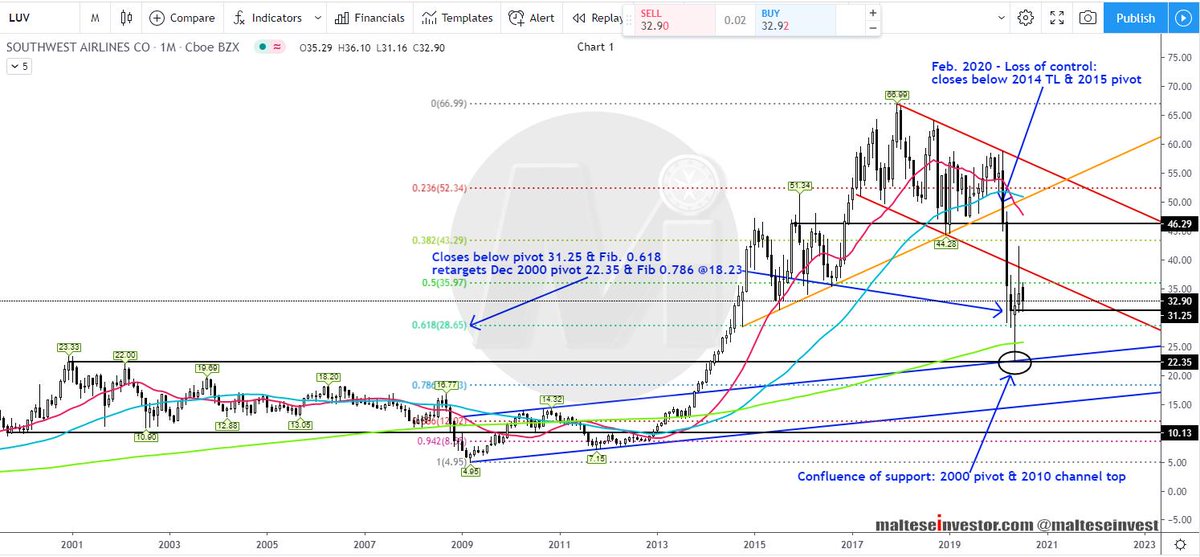
Monthly Chart: It has been exactly 4 years since price closed above the #SMA 50 (currently 2.28), the Mar. 2018 trendline #resistance has been cleared and an attempt .....
IBIO 2/4
Daily Chart: A small unfilled gap 4.97/14 exists.The best #support is located at 3.89 then 3.40 and the Apr. 2020 #trendline at 1.77.
The #Strategy is printed on the image.
$IBIO 4/4
