Chart 1
Monthly Chart: A large price decline seen today - immediate #support at the #SMA 50 at 46.57 and below that the 2009 #trendline at 45.13. Watch out for a sustained break below 43.15 which could target 38.00 quickly.
INTC 2/3
Monthly Chart: A large price decline seen today - immediate #support at the #SMA 50 at 46.57 and below that the 2009 #trendline at 45.13. Watch out for a sustained break below 43.15 which could target 38.00 quickly.
INTC 2/3
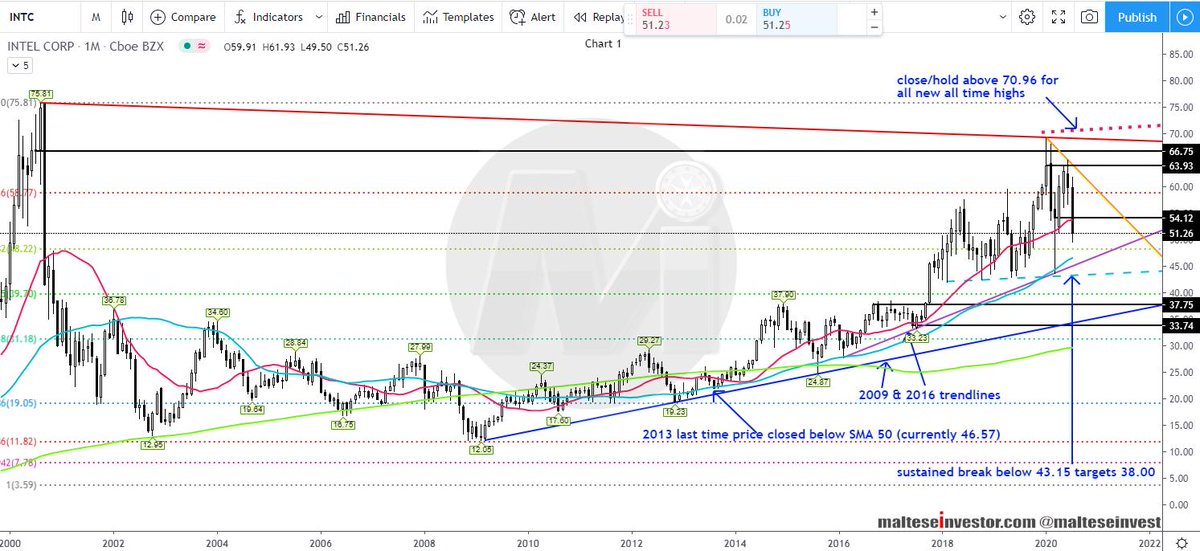
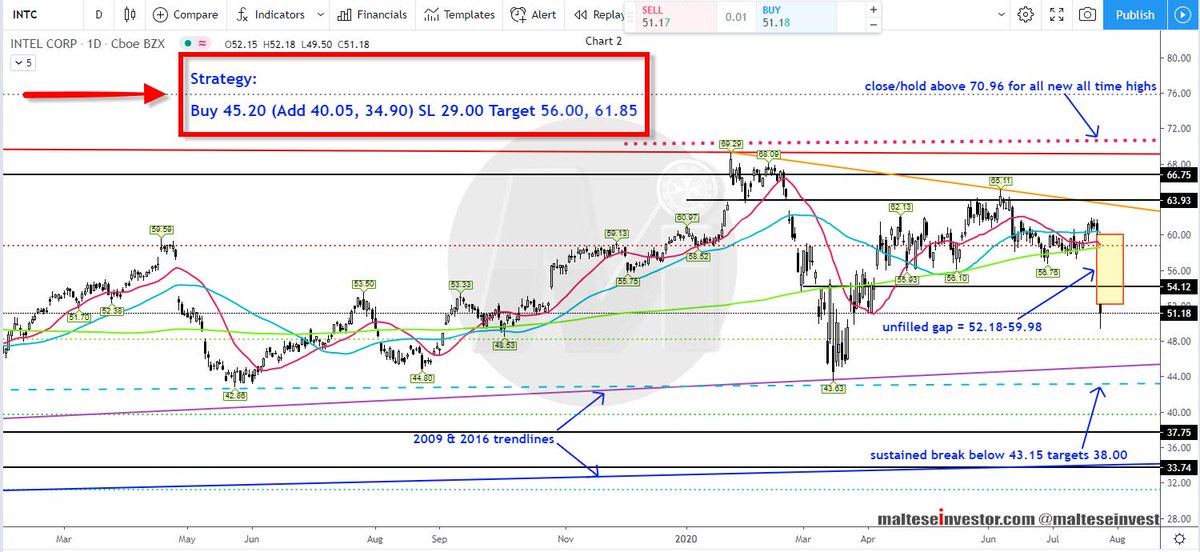
Chart 2
Daily Chart: Price has broken down strongly below the SMA 200 and the SMA 20 is about to cross over. A $7 unfilled gap has been created. Strong support is seen at 36.60 31.40.
The #Strategy is printed on the image.
$INTC 3/3
Daily Chart: Price has broken down strongly below the SMA 200 and the SMA 20 is about to cross over. A $7 unfilled gap has been created. Strong support is seen at 36.60 31.40.
The #Strategy is printed on the image.
$INTC 3/3