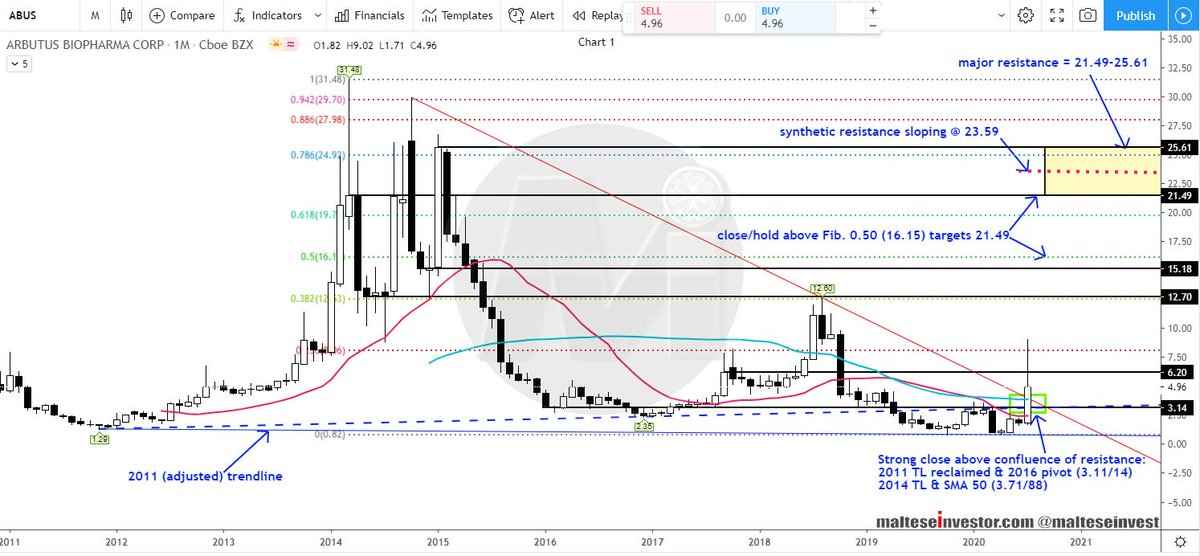
Monthly Chart: Price has bounced strongly taking out a #confluence of multiple #resistances: the reclaimed 2011 trendline, 2016 #pivot, 2014 trendline and SMA 50 at 3.11/14, 3.71/88 respectively. A close .....
ABUS 2/5
ABUS 3/5
Daily Chart: Profit taking see around from day/short term traders around 8.10 and the recent high of 9.02. Good support seen at the main #SMAs and the May 2020 trendline. We initiate our position above the broken 2014 #trendline .....
ABUS 4/5


