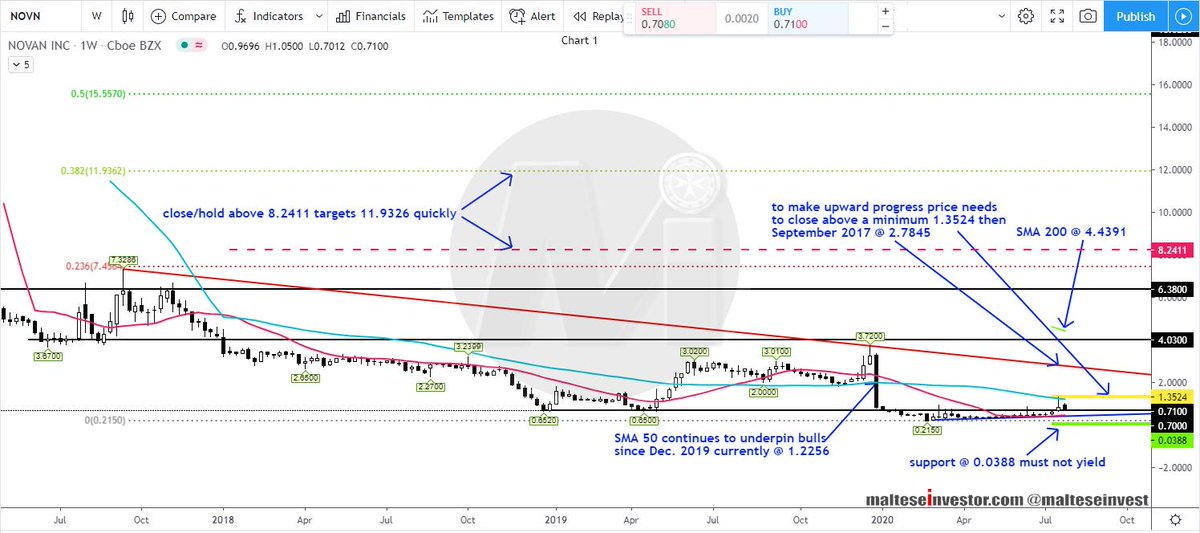
Weekly Chart: The #SMA 50 at 1.2256 continues to underpin upside probes but price needs to first close above synthetic #resistance at 1.3524 then the Sept. 2017 trendline at 2.7845 for #bullishness. Price is currently .....
NOVN 2/4
NOVN 3/4
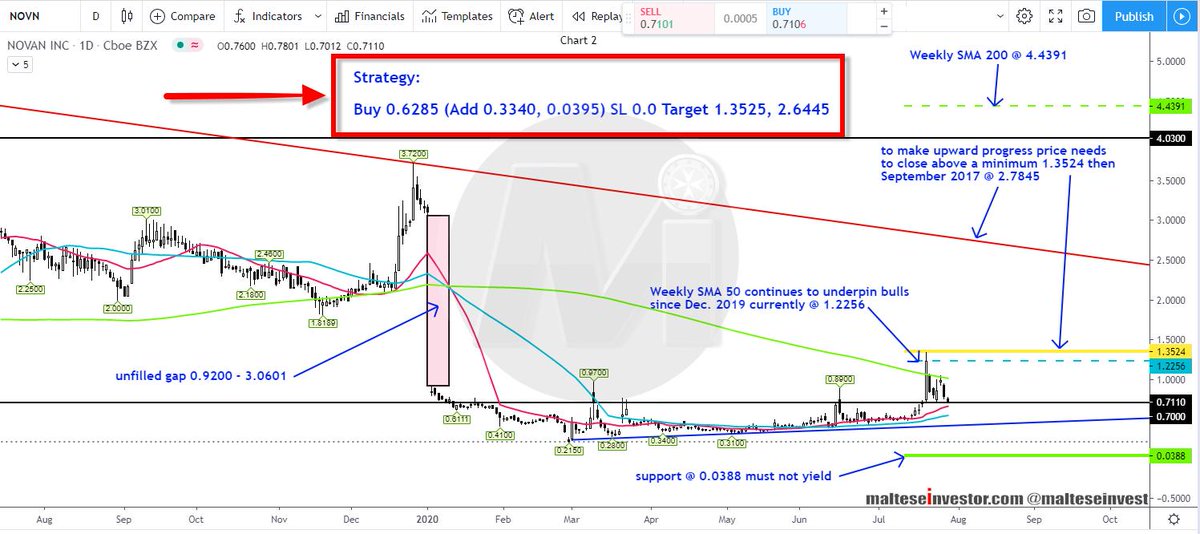
Daily Chart: An unfilled gap at 0.9200 - 3.061 exists. Price is trading back below the SMA 200 at 1.0143 and the SMA 20 and 50 are at 0.6611 and 0.5459 respectively.
The #Strategy is printed on the image.
$NOVN 4/4
threadreaderapp.com/thread/1288505…

