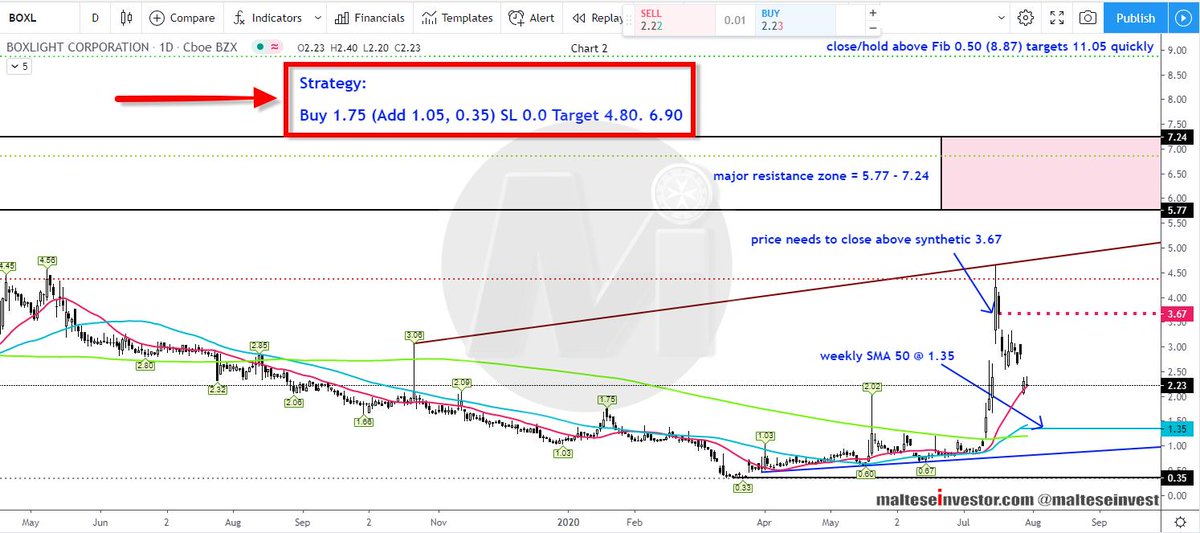
Weekly Chart: It's been one year since price closed back above #SMA 50. As a minimum price needs to hold above synthetic #resistance at 3.67 to challenge the major resistance zone .....
BOXL 2/4
Daily Chart: Good #support is seen from the close proximity of the weekly SMA 50 daily SMA 200 at 135/20 respectively with #trendline support at 0.82, off the all time lows.
The #Strategy is printed on the image.
$BOXL 4/4


