Analysis: #NYSE $OGEN
Case 413 #Oragenics Inc.
DISCLAIMER: The analysis is strictly for educational purposes and should not be construed as an invitation to trade.
#OGEN 1/4
Case 413 #Oragenics Inc.
DISCLAIMER: The analysis is strictly for educational purposes and should not be construed as an invitation to trade.
#OGEN 1/4
Chart 1
Daily Chart: Price rose strongly in July 2020 closing above the Mar. 2019 #trendline but failing to close above Oct. 2018 pivot and synthetic #resistance at 1.75/98 respectively. Price is currently being supported by the Jan. 2019 pivot at .....
OGEN 2/4
Daily Chart: Price rose strongly in July 2020 closing above the Mar. 2019 #trendline but failing to close above Oct. 2018 pivot and synthetic #resistance at 1.75/98 respectively. Price is currently being supported by the Jan. 2019 pivot at .....
OGEN 2/4

Chart 2
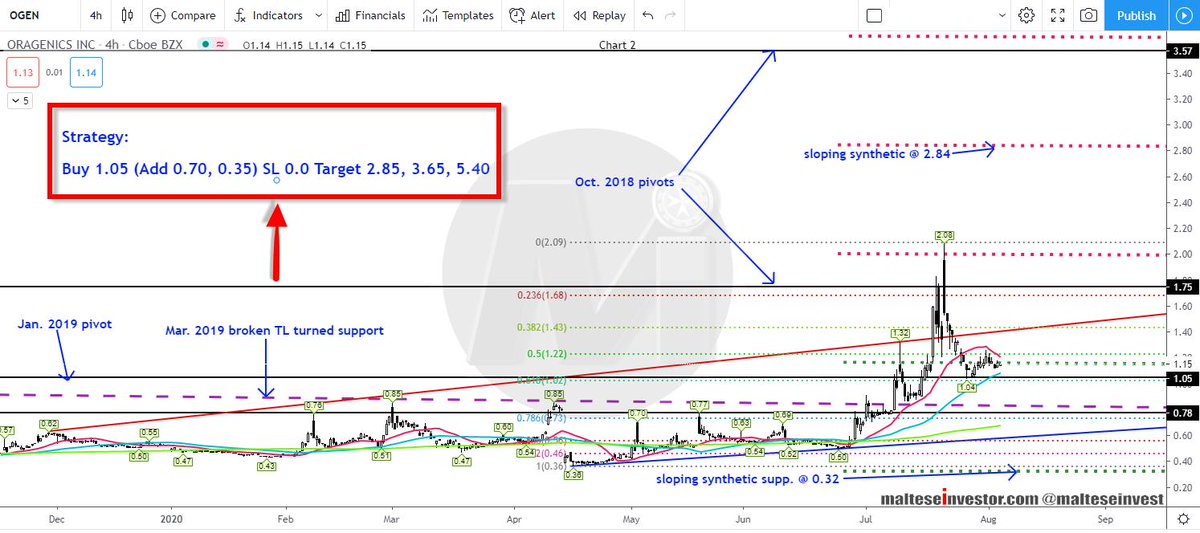
4 Hour Chart: Apr. 2020 trendline support is at 0.58. beneath the all time low of 0.36 lies synthetic support at 0.32.
The #Strategy is printed on the image.
$OGEN 4/4
4 Hour Chart: Apr. 2020 trendline support is at 0.58. beneath the all time low of 0.36 lies synthetic support at 0.32.
The #Strategy is printed on the image.
$OGEN 4/4