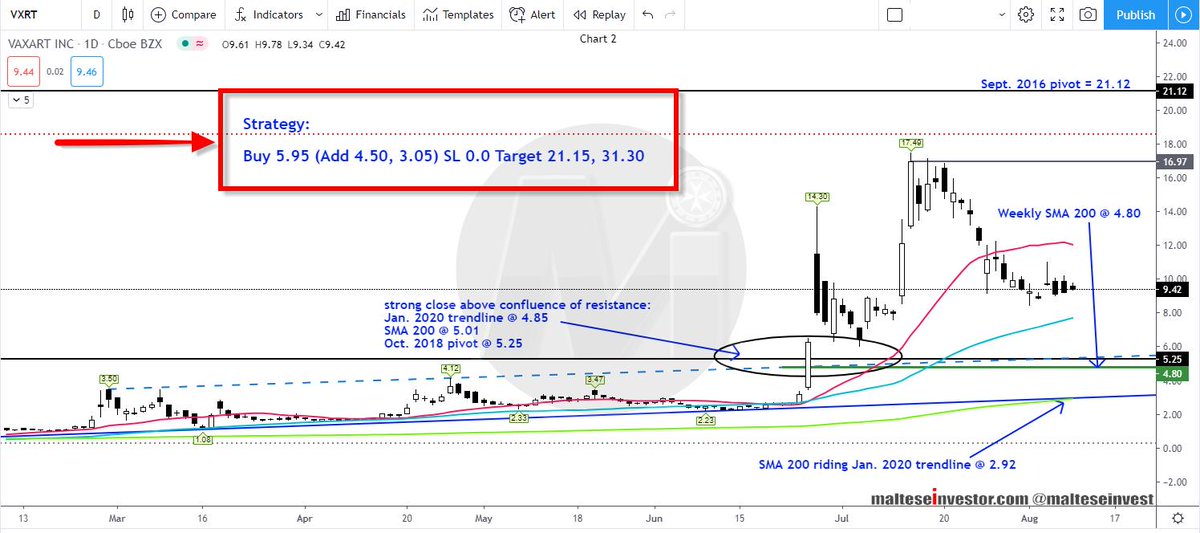
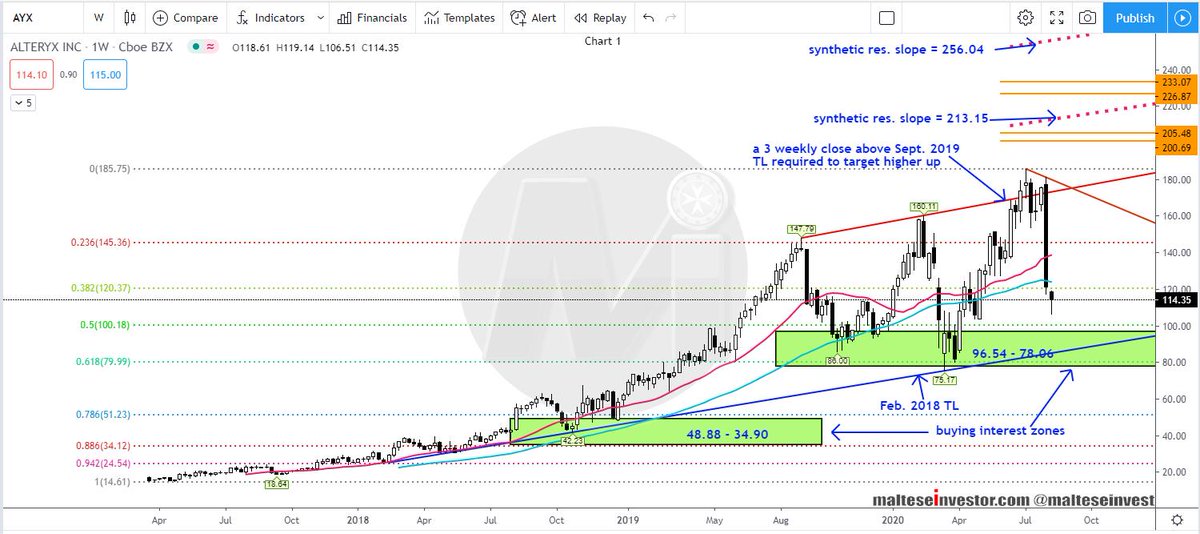
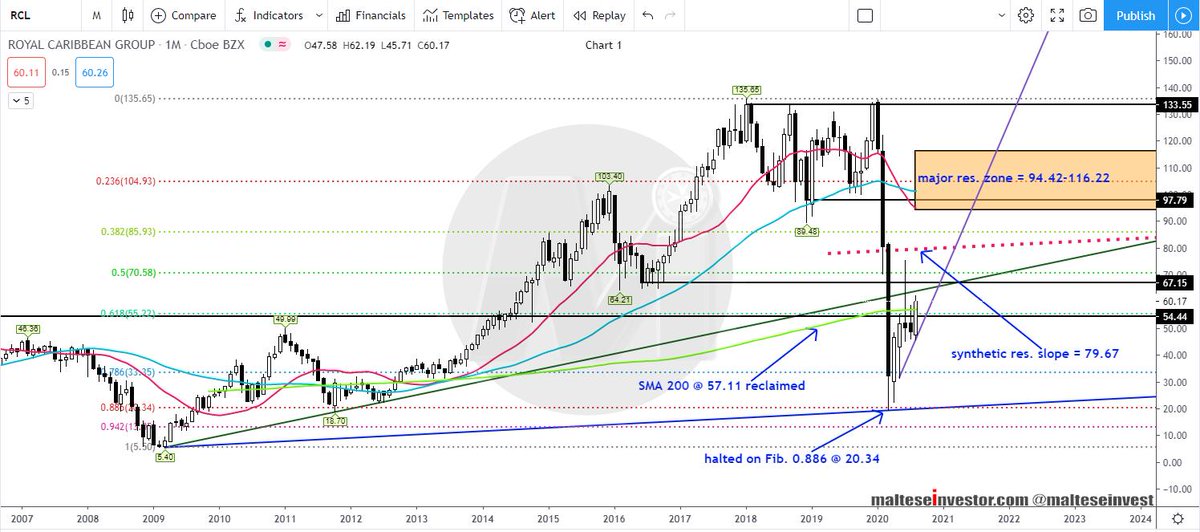
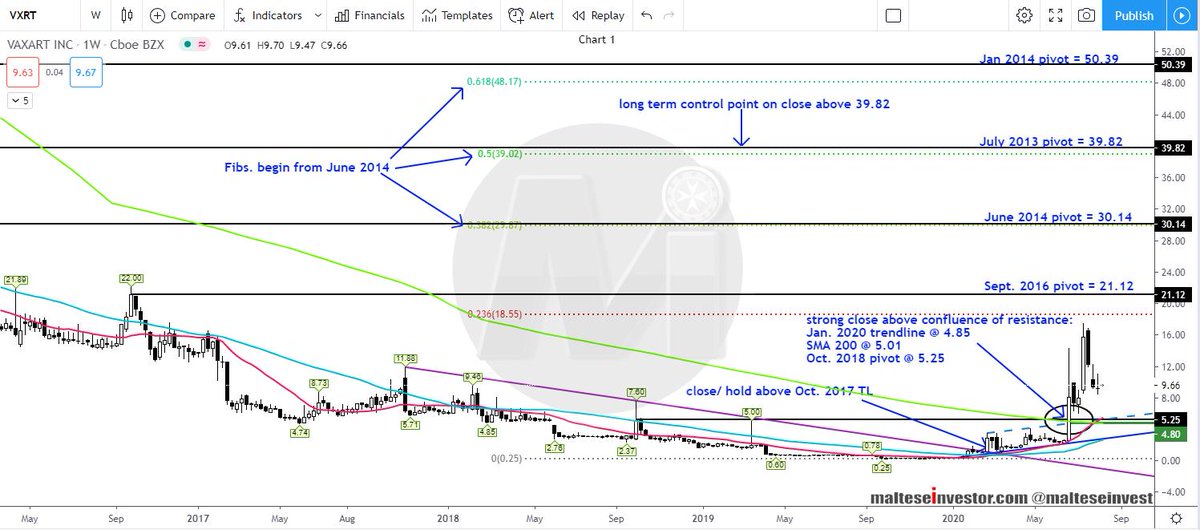
Weekly Chart: The all time low at 0.25 is confirmed following the strong close above Nov. 2017 trendline. June 2020 witnessed a strong close above a #confluence of #resistance - Jan. 2020 #trendline, SMA 200 and Oct. 2018 .....
VXRT 2/5
VXRT 3/5
Daily Chart: Watch for a close below 8.15 as this could target 7.35 quickly, then strong #support starting from 5.86. Major support seen at 5.25 - 4.80 (weekly SMA 200). The daily SMA 200 is .....
VXRT 4/5
The #Strategy is printed on the image.
$VXRT 5/5
