This is my #Missouri #COVID19 evening update 🧵 for Thursday, 8/27. My website has been fully updated - slu-opengis.github.io/covid_daily_vi….
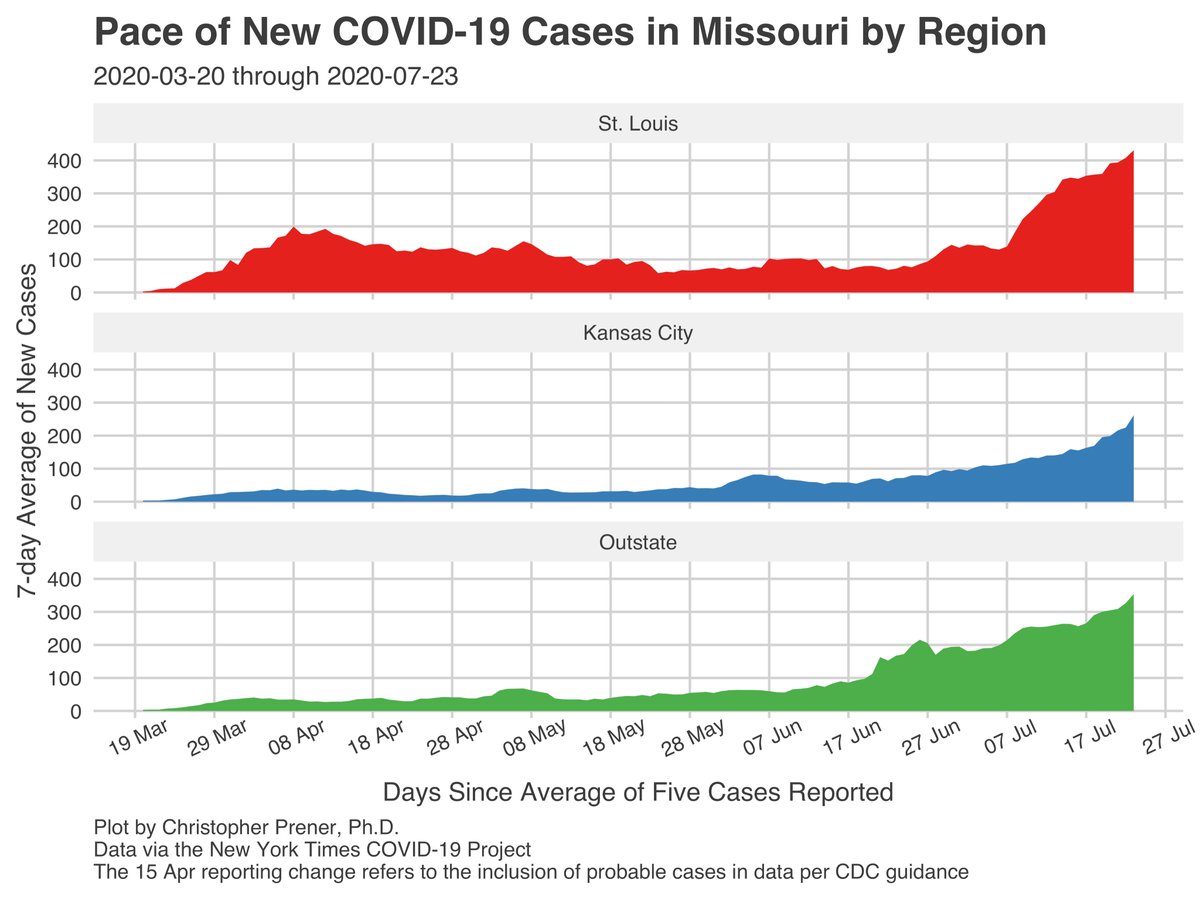
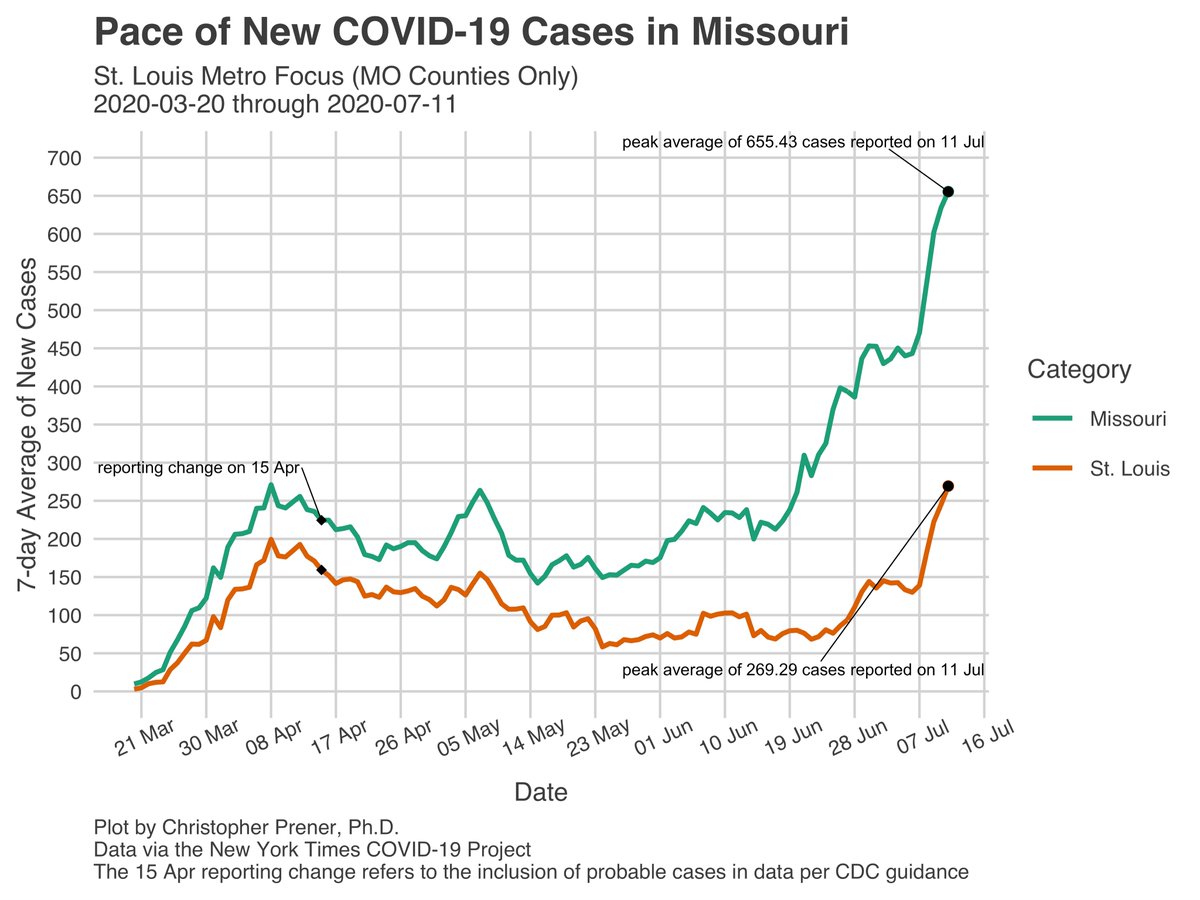
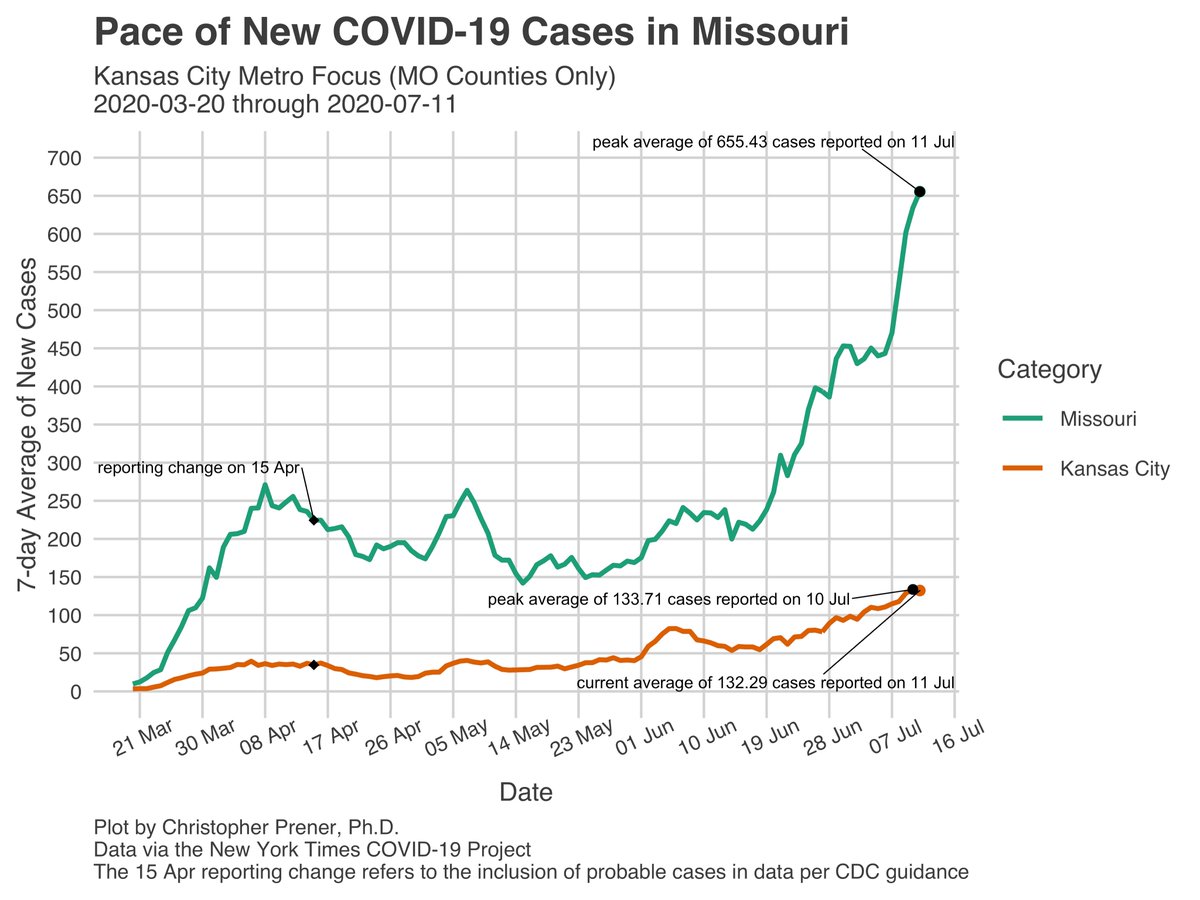
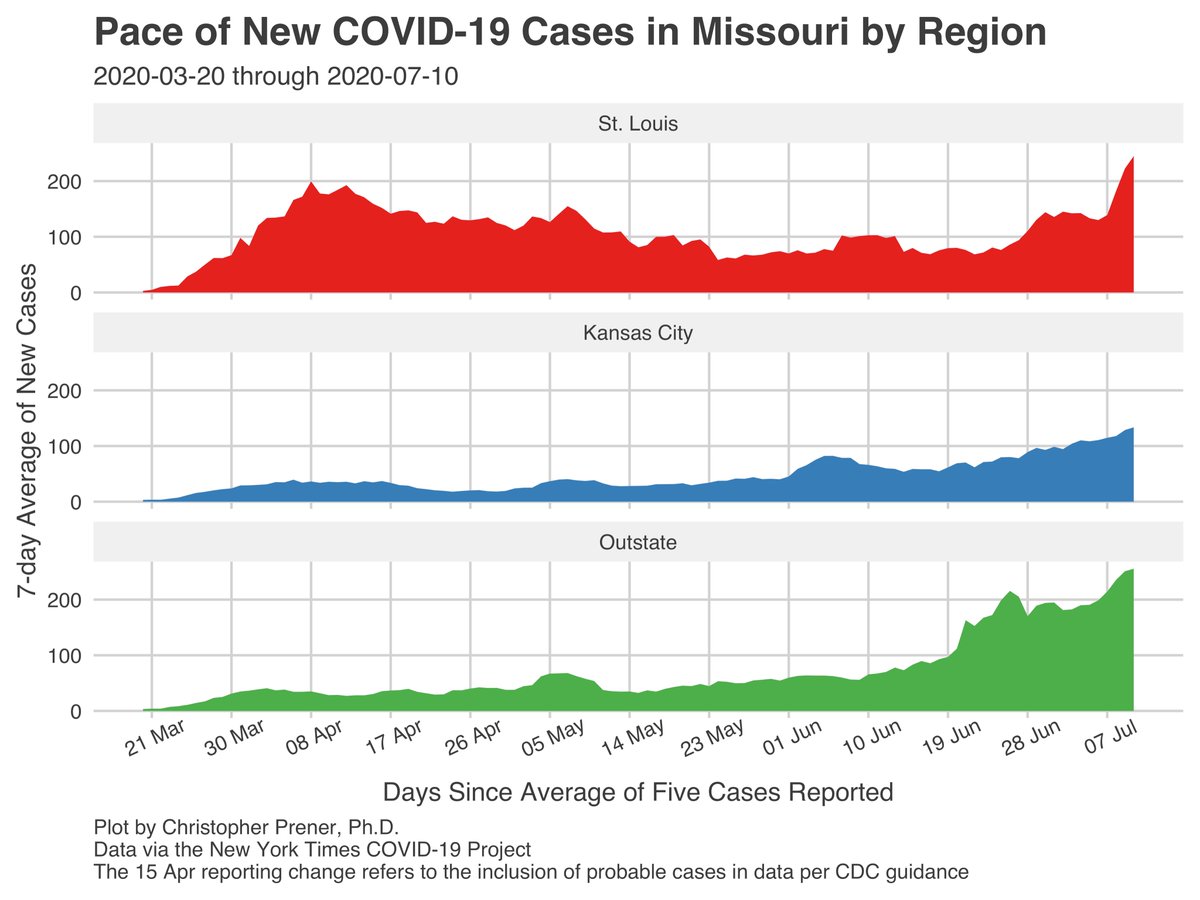
The 7-day average of new cases statewide ticked back up yesterday, with corresponding increases in #KansasCity and in the "outstate" region. 1/16
The 7-day average of new cases statewide ticked back up yesterday, with corresponding increases in #KansasCity and in the "outstate" region. 1/16
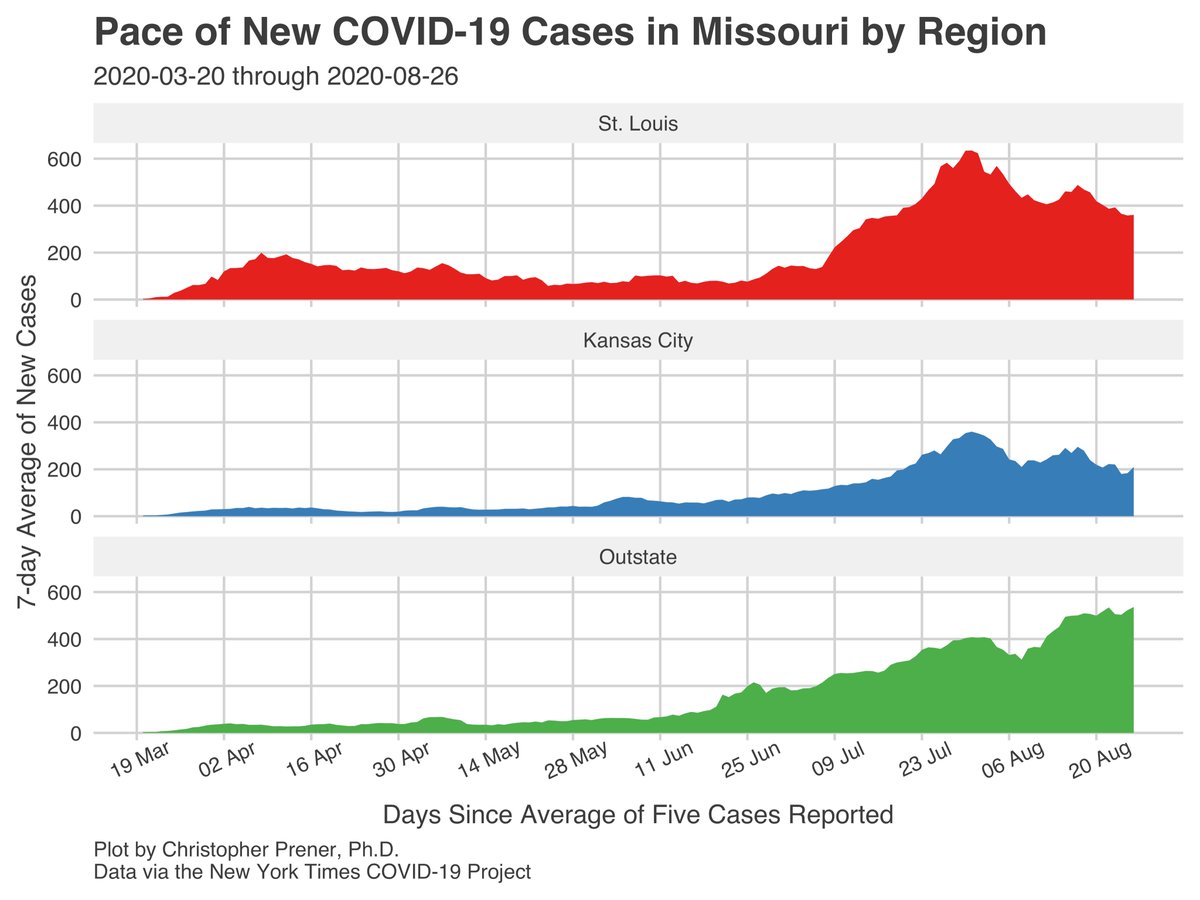
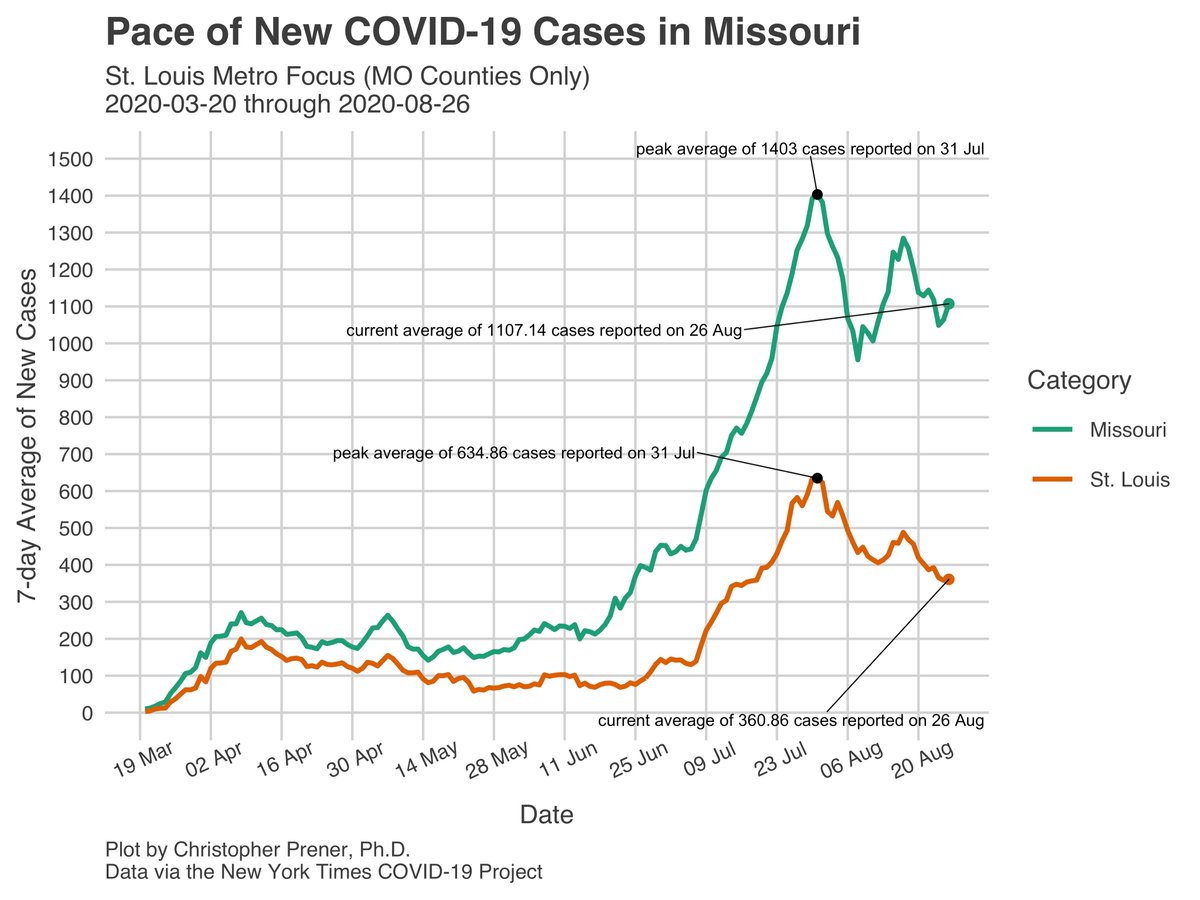
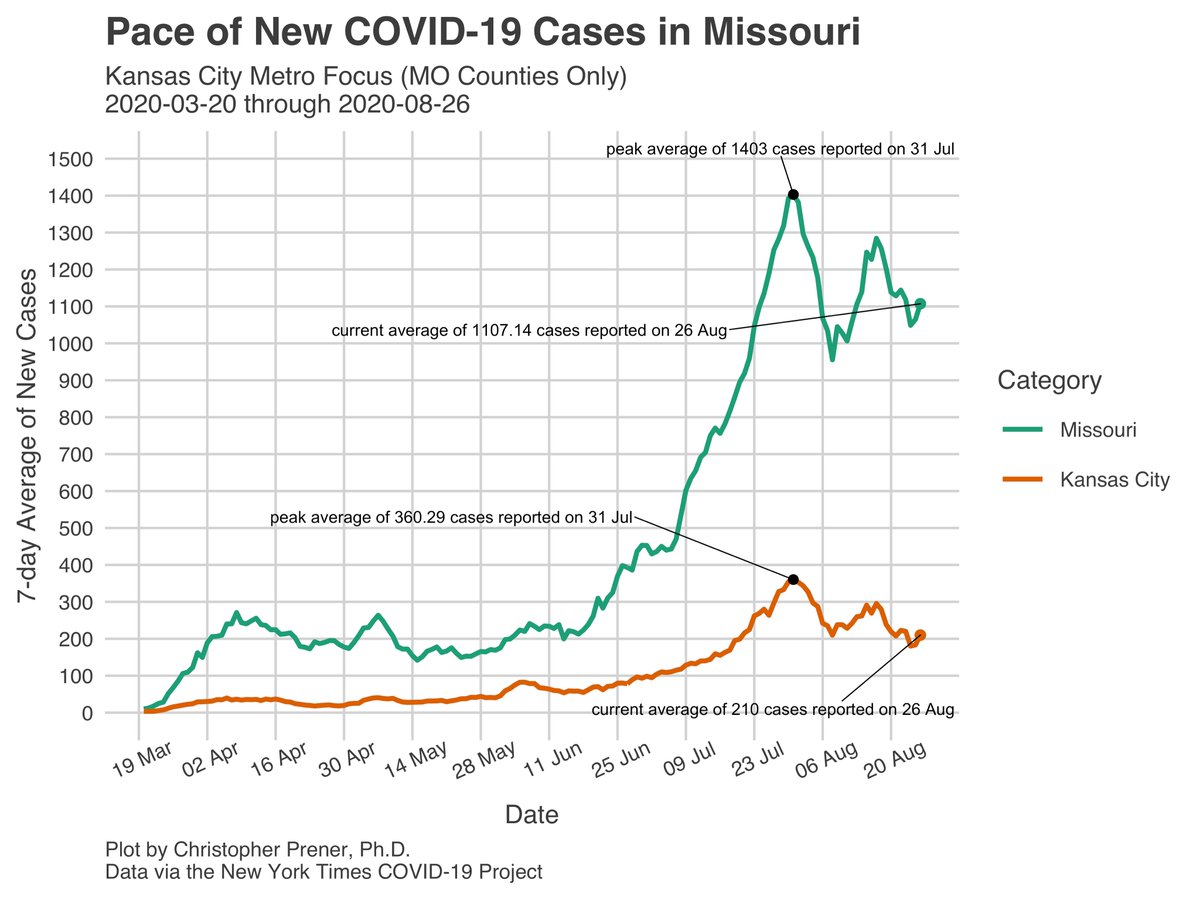
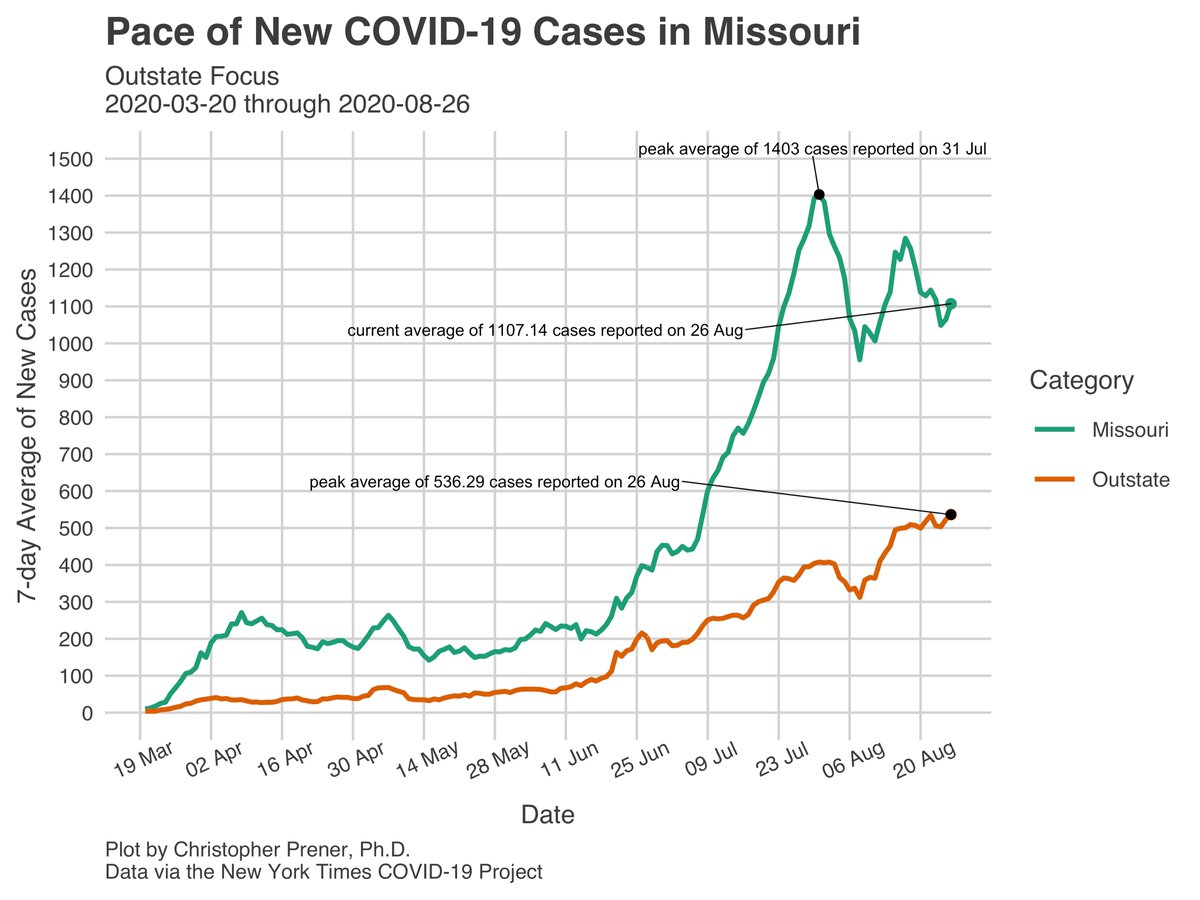
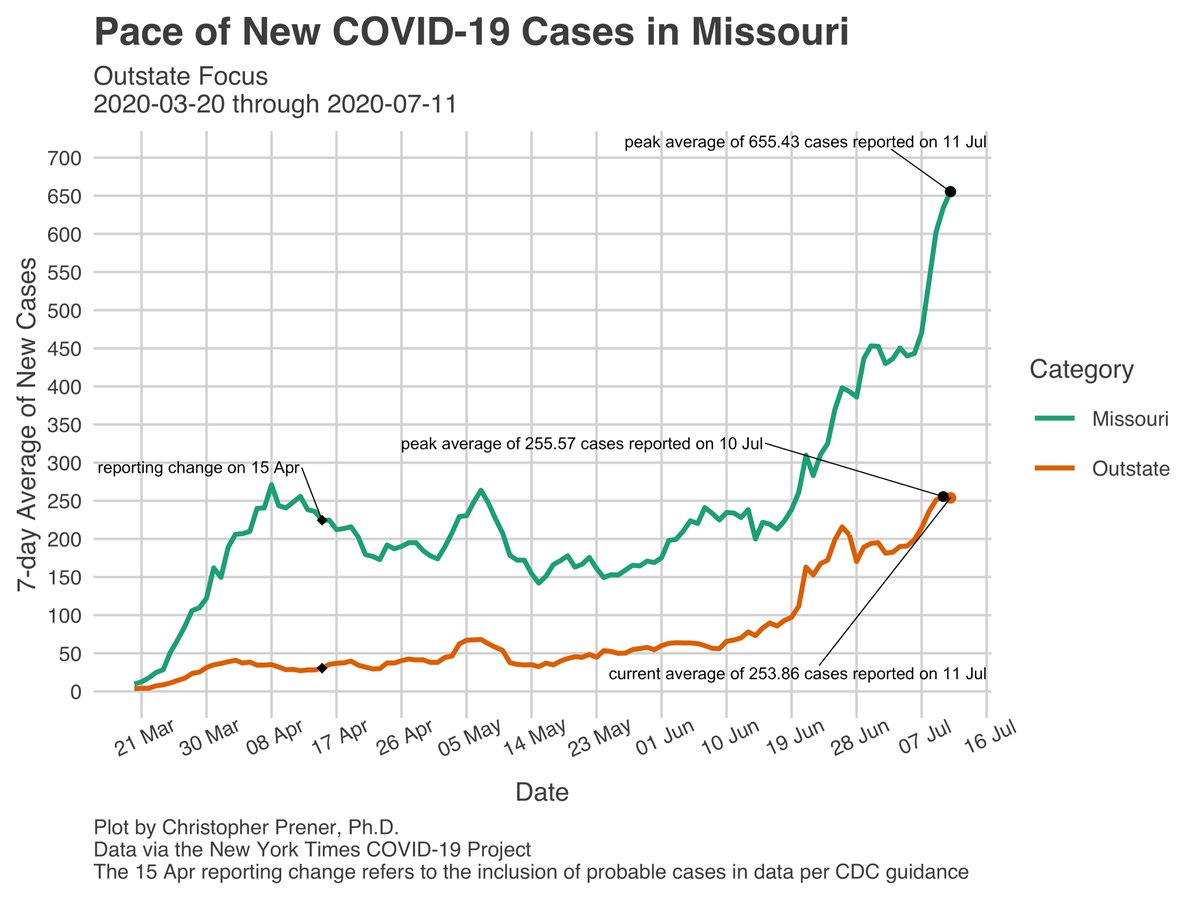
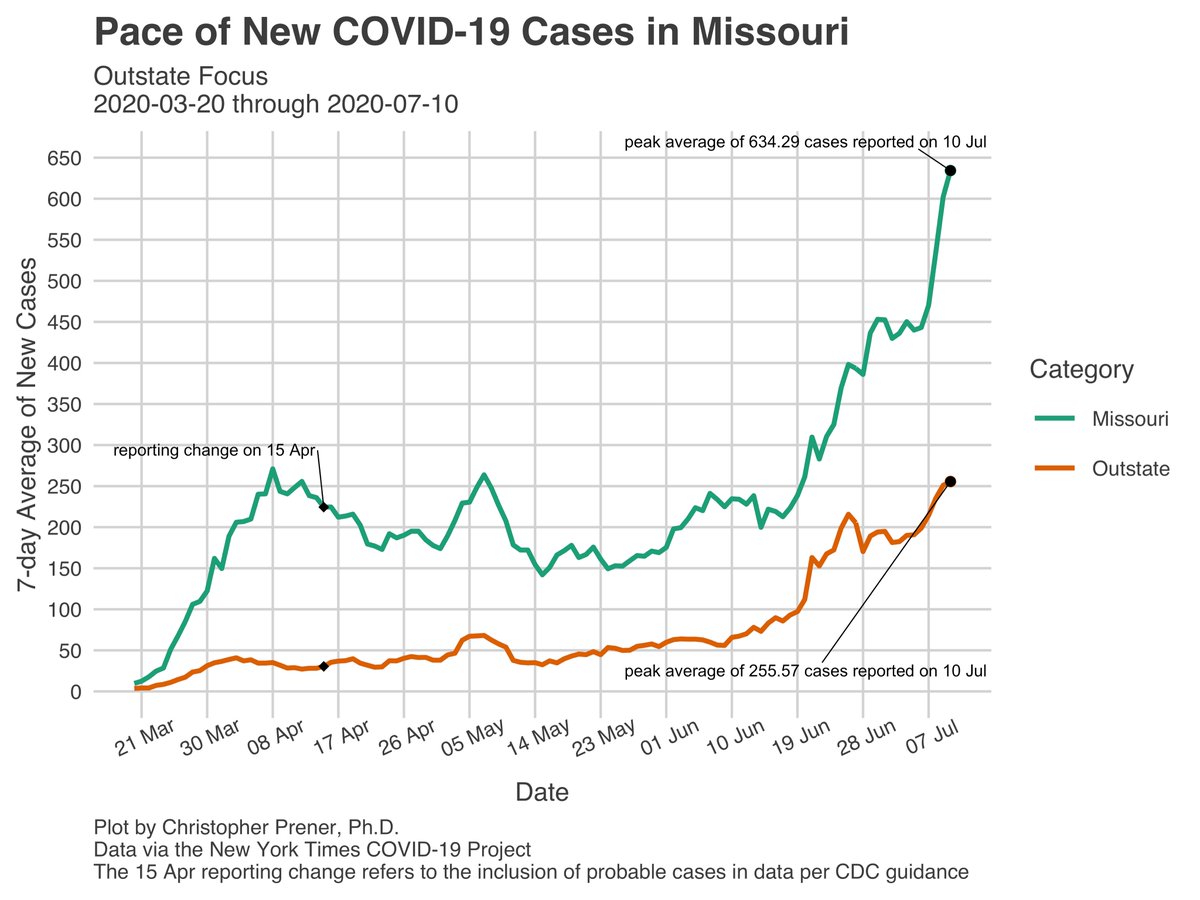
Outstate is back to posting highs relative to past report days ☝️, which now makes up 48.4% of our statewide 7-day average. Only #StLouis continues to show steady improvements. 2/16
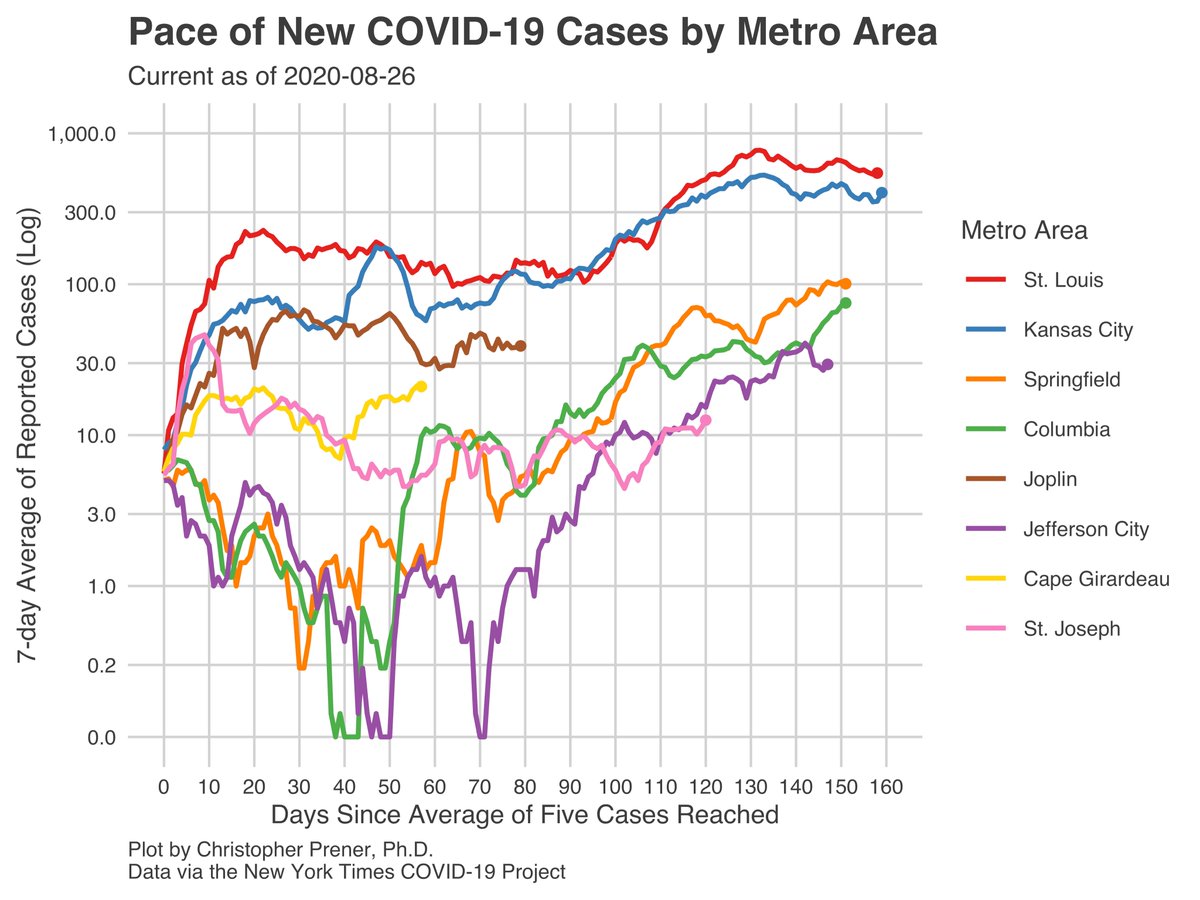
The area around Springfield is a big part of the outstate trend. Greene County is averaging 80 new cases per day on average right now, and the Springfield metro is averaging around 100, though 7-day averages have dropped in surrounding counties. 3/16


Like Springfield, Columbia is also seeing superlative numbers. Boone County is currently adding 64 new cases per day on average right now, and both the Columbia and Jeff City metros are at or near all time highs, as the Springfield metro is. 4/16


I’m increasingly worried about what is happing in and around Cape Girardeau whose metro 7-day average is, like other metros, at its all time high for the pandemic. St. Francois County is the biggest concern, though, adding just over 44 new cases per day on average. 5/16


In Northern Missouri, Nodaway and Marion counties continue to add new cases. Nodaway has passed Gentry County’s per capita rate, and if it were to continue on its current trajectory, would also pass the St. Louis County per capita rate in September. 6/16


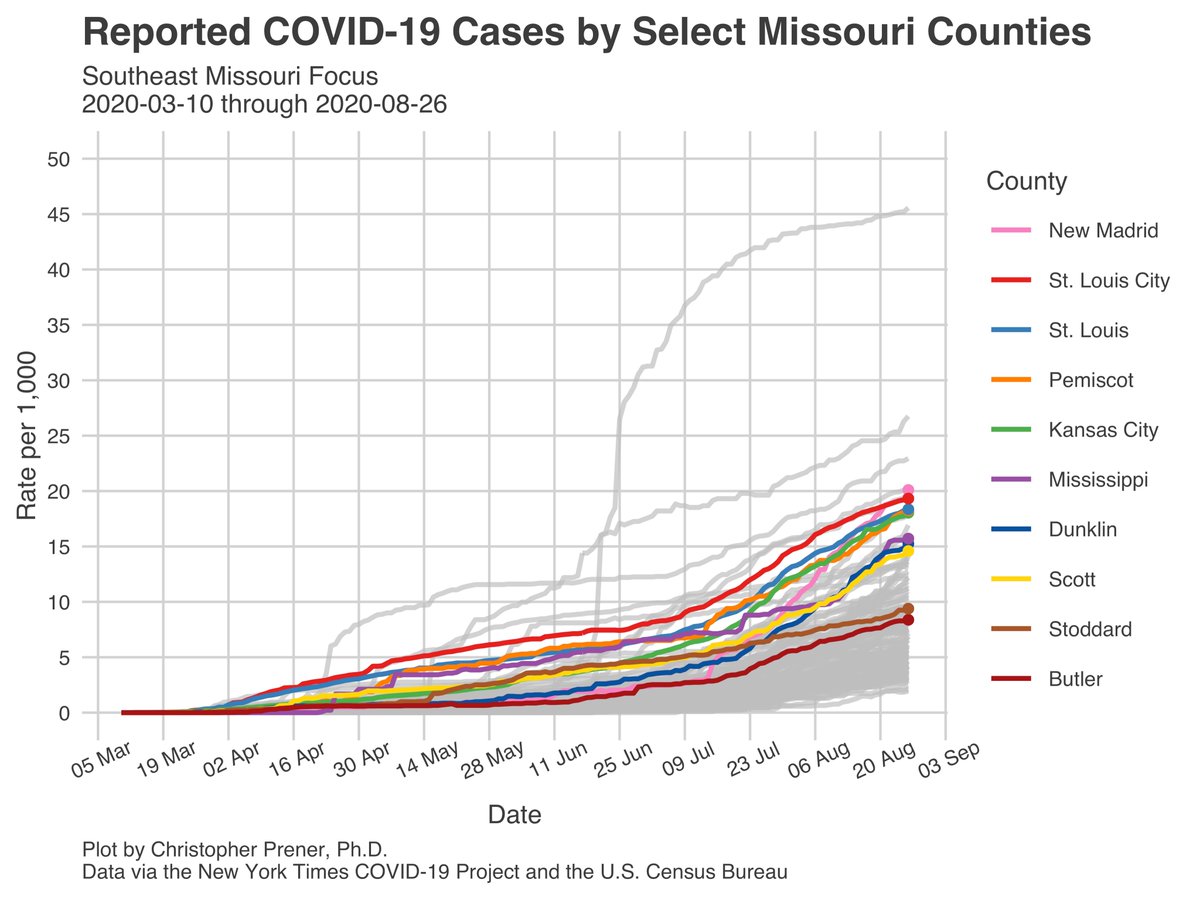
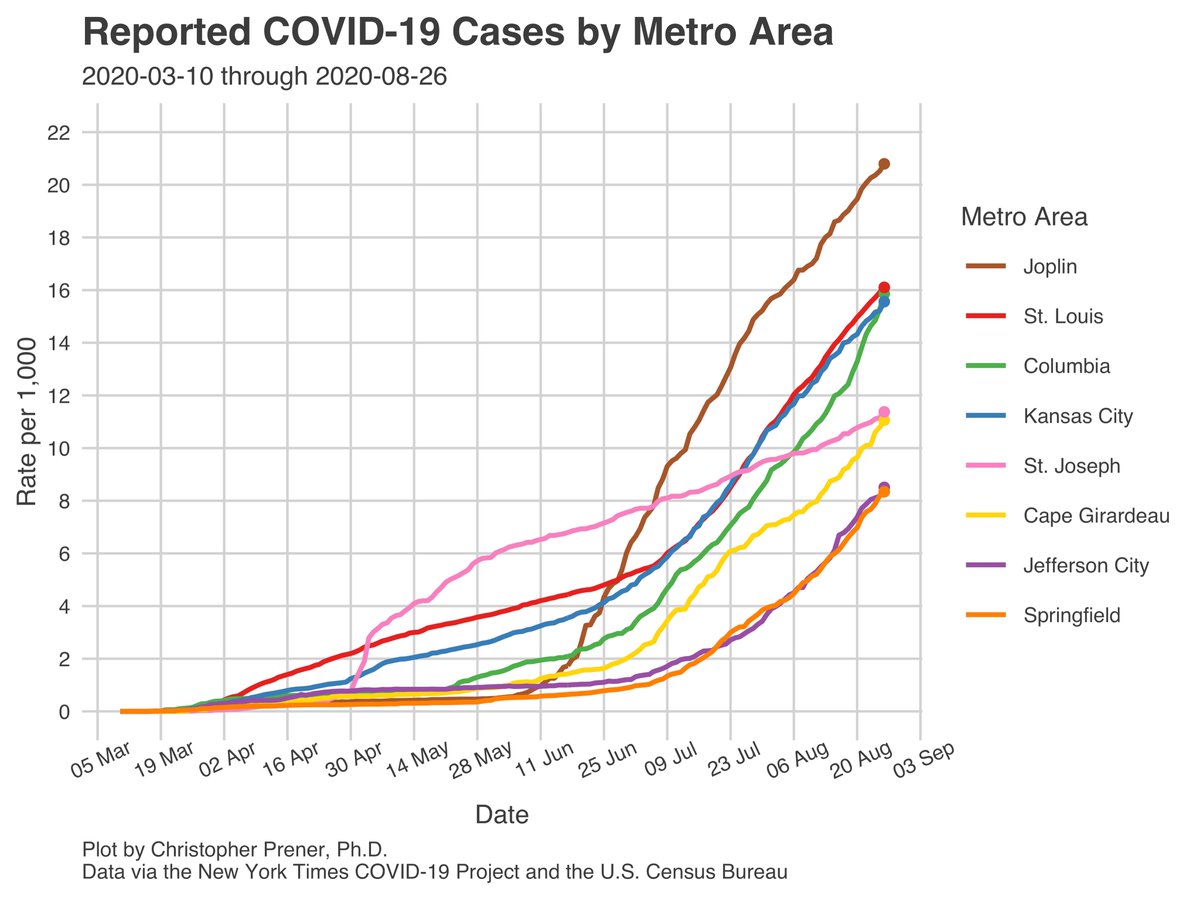
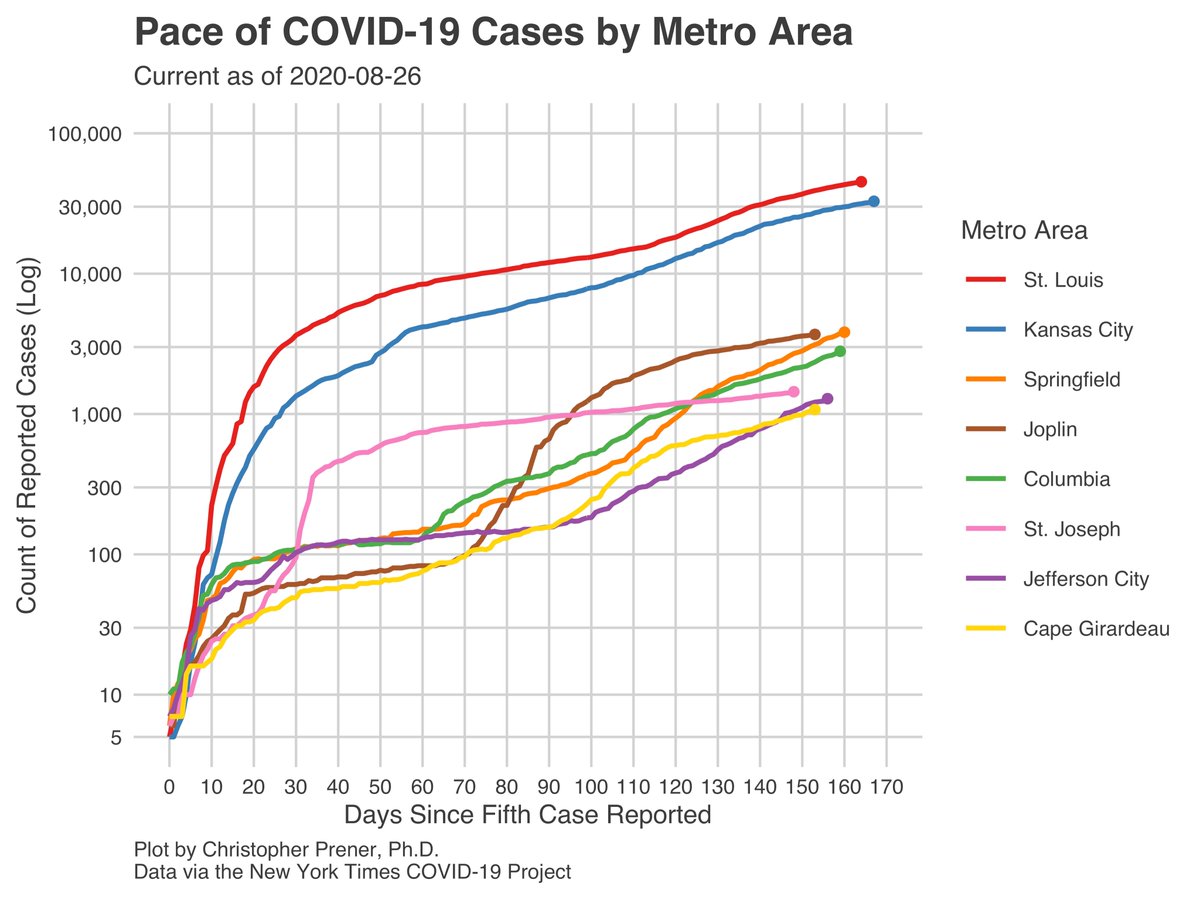
Finally, in the area around Lake of the Ozarks continues to slowly but steadily accumulate new cases. Camden County, for example, began June plateaued at 37 total cases. They’ll likely surpass 500 total cases before August ends. 7/16


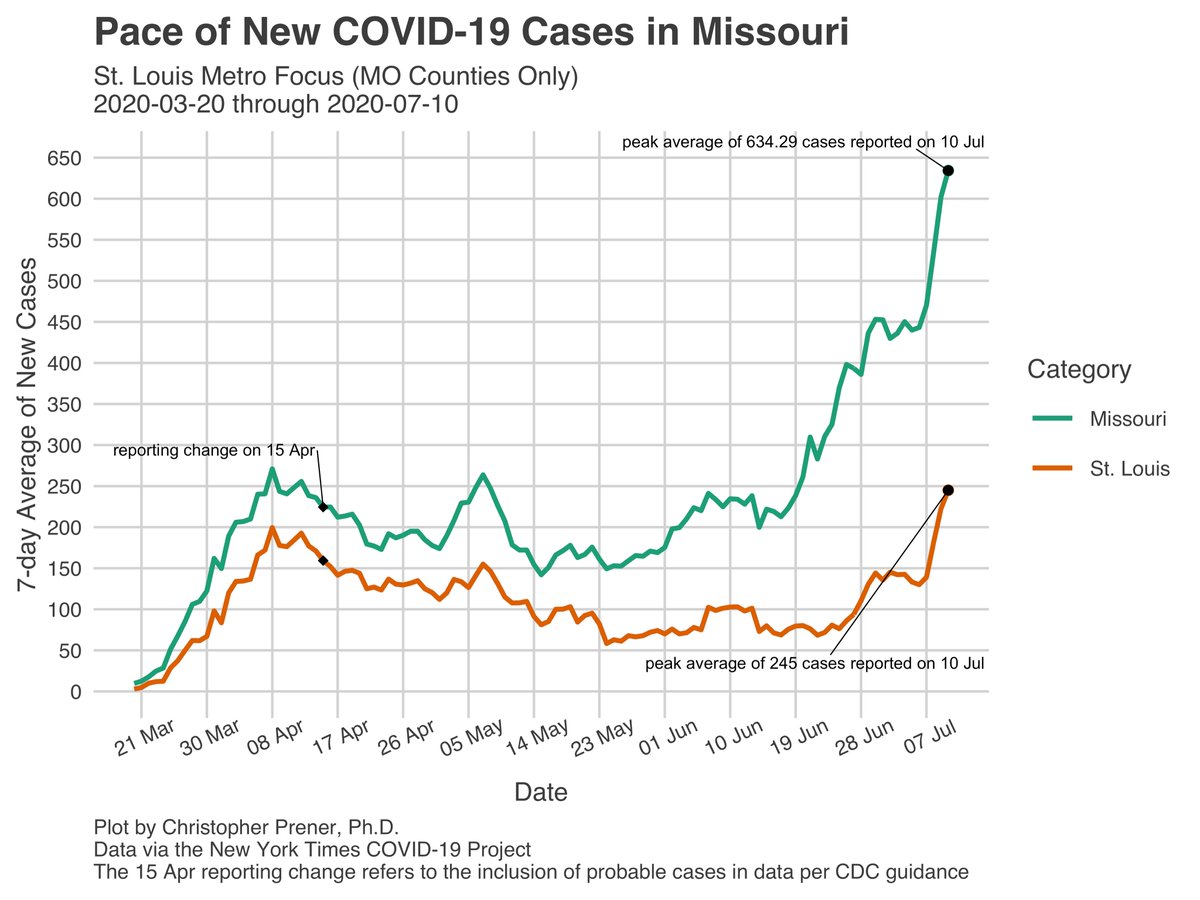
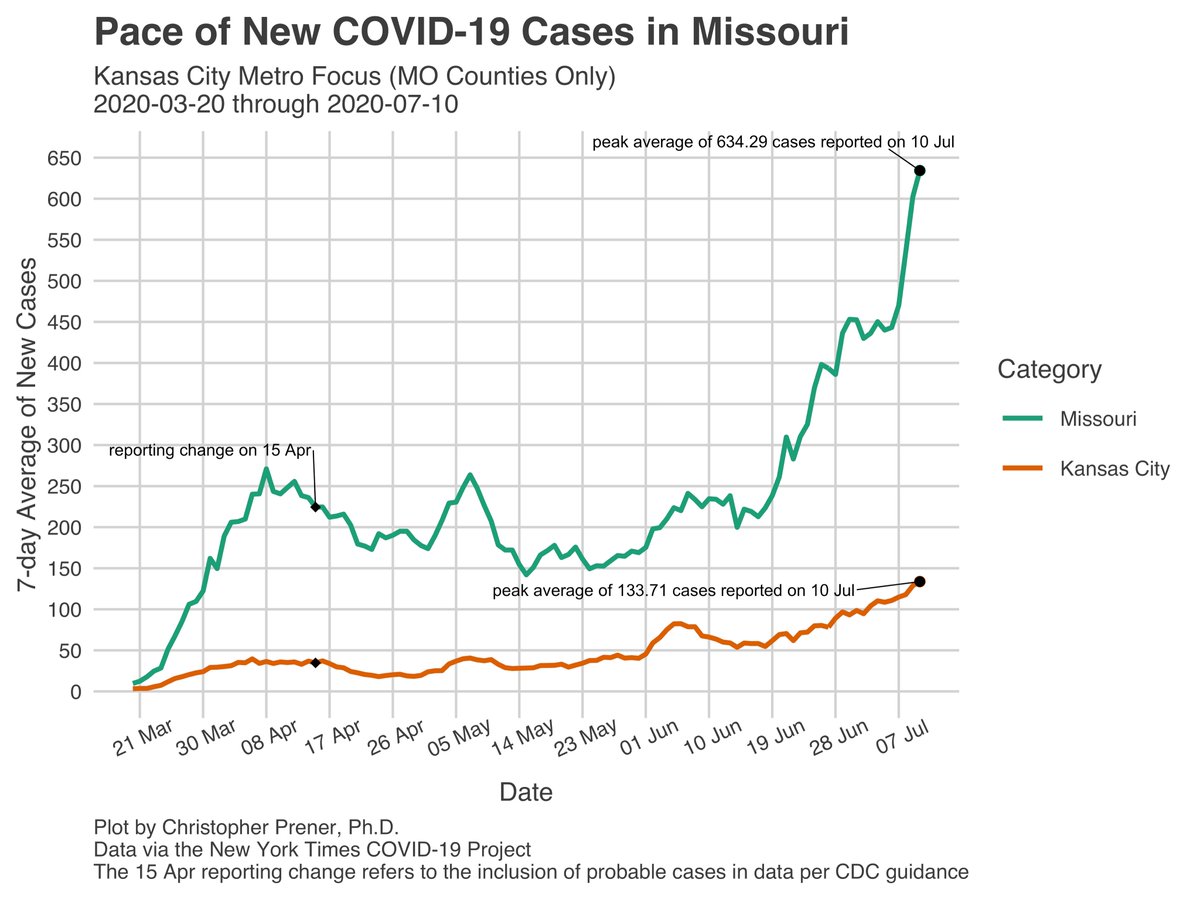
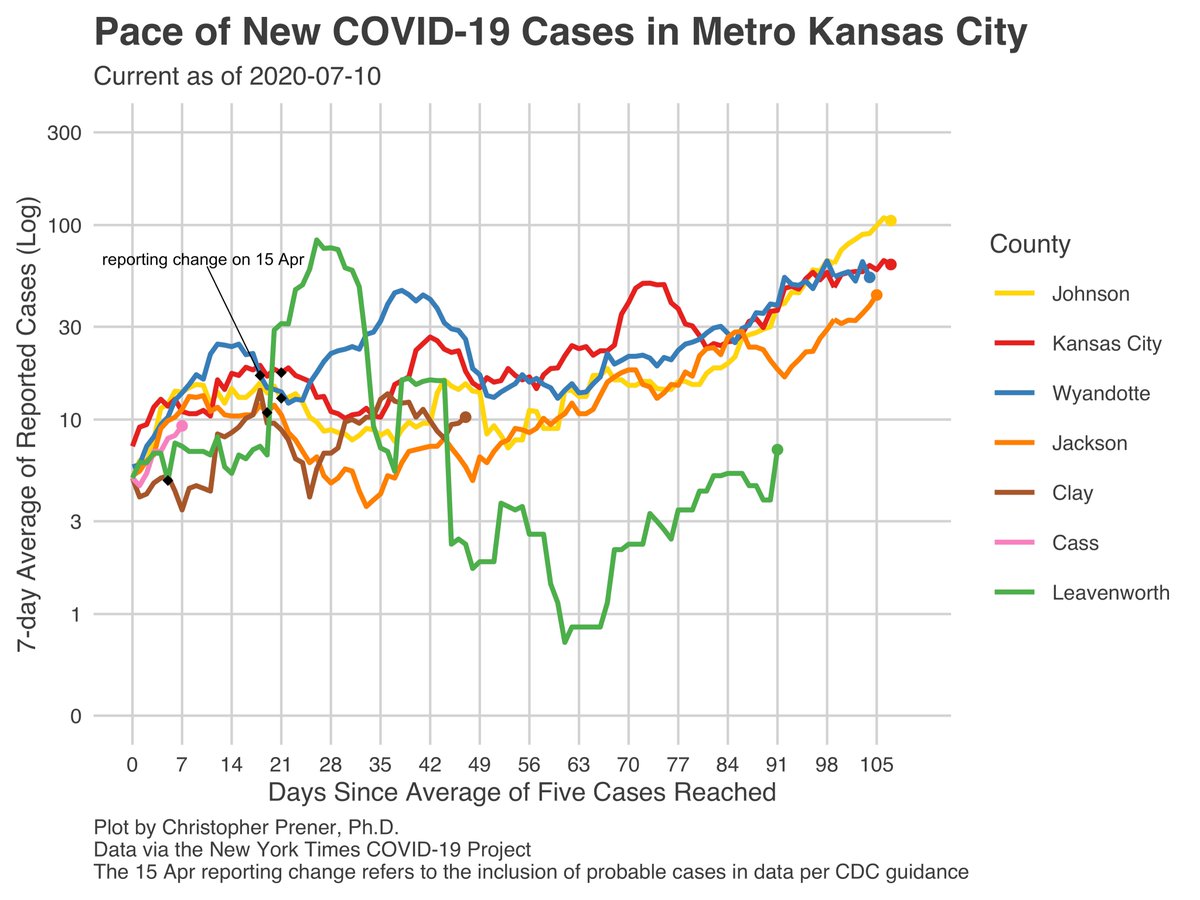
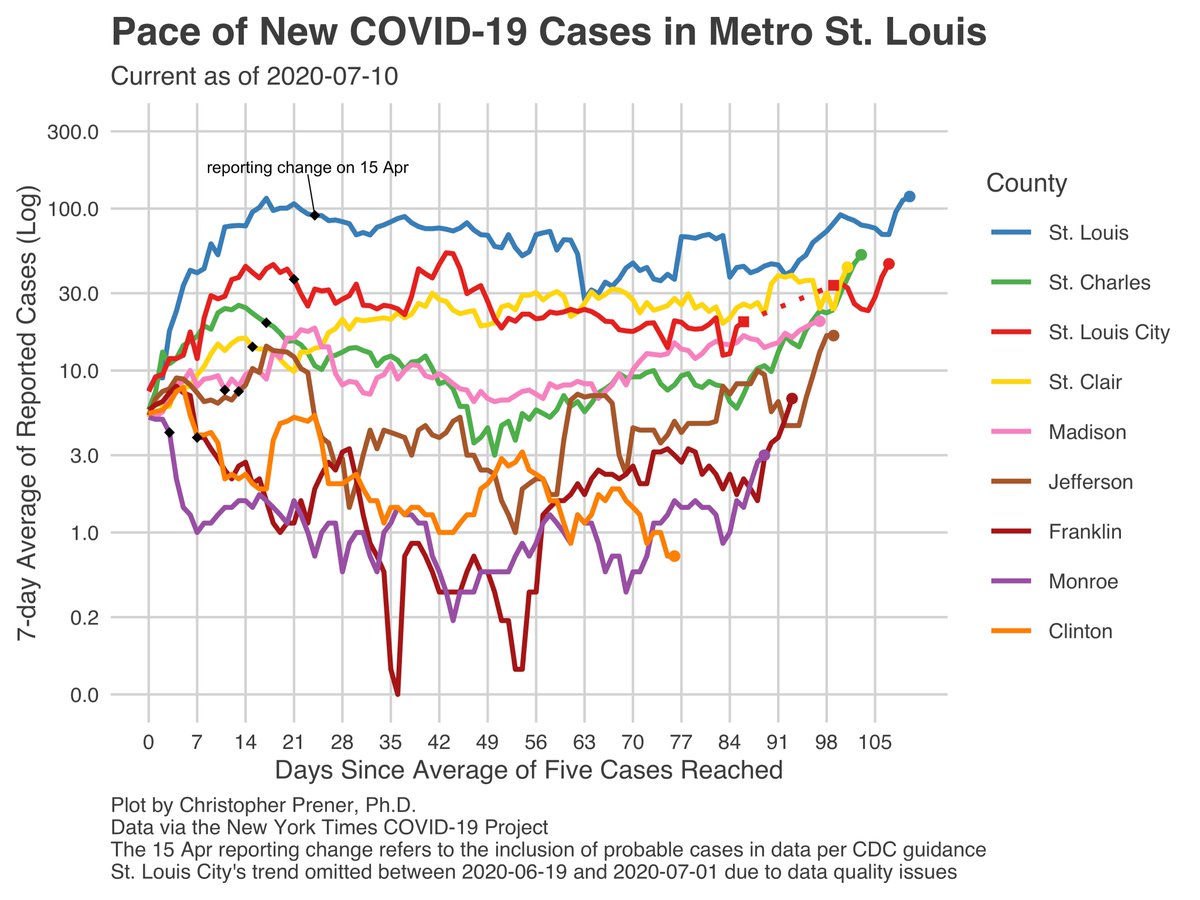
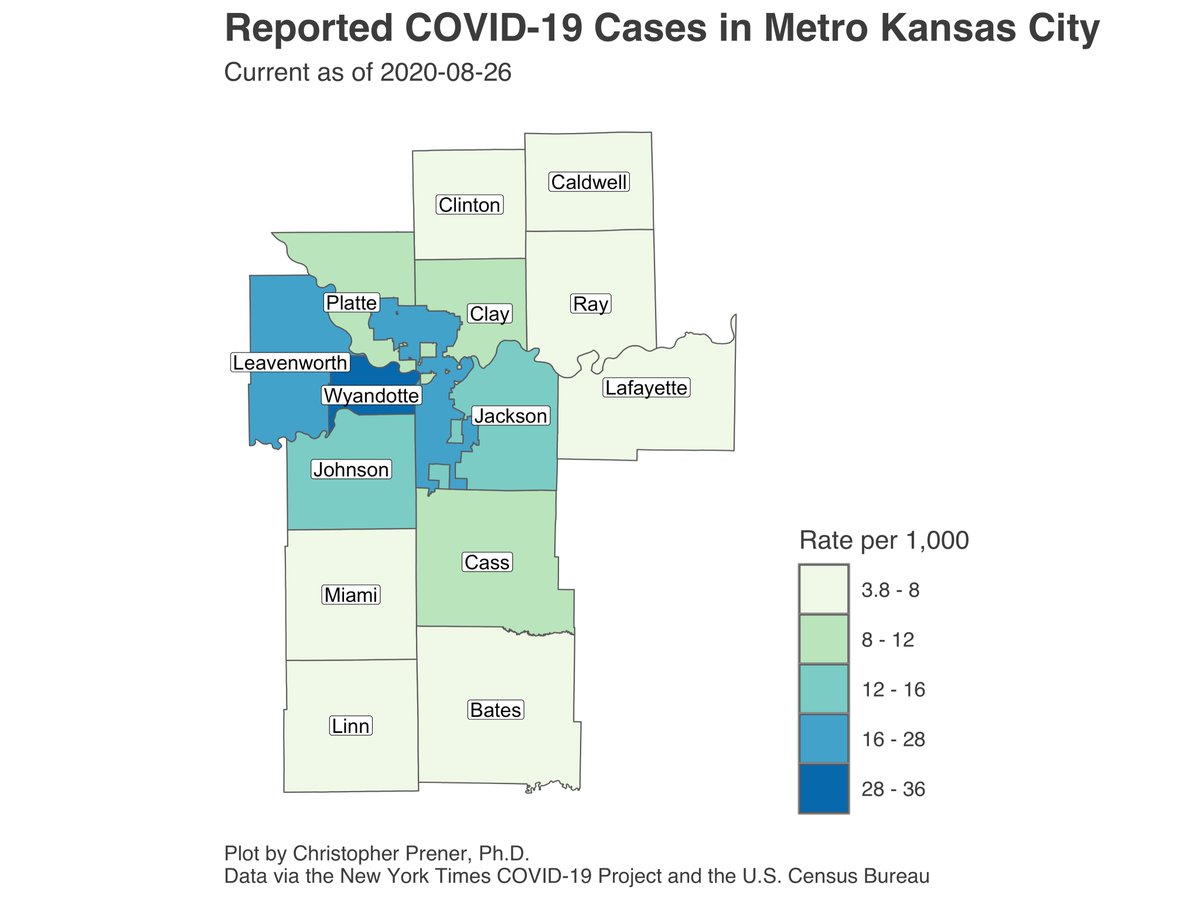
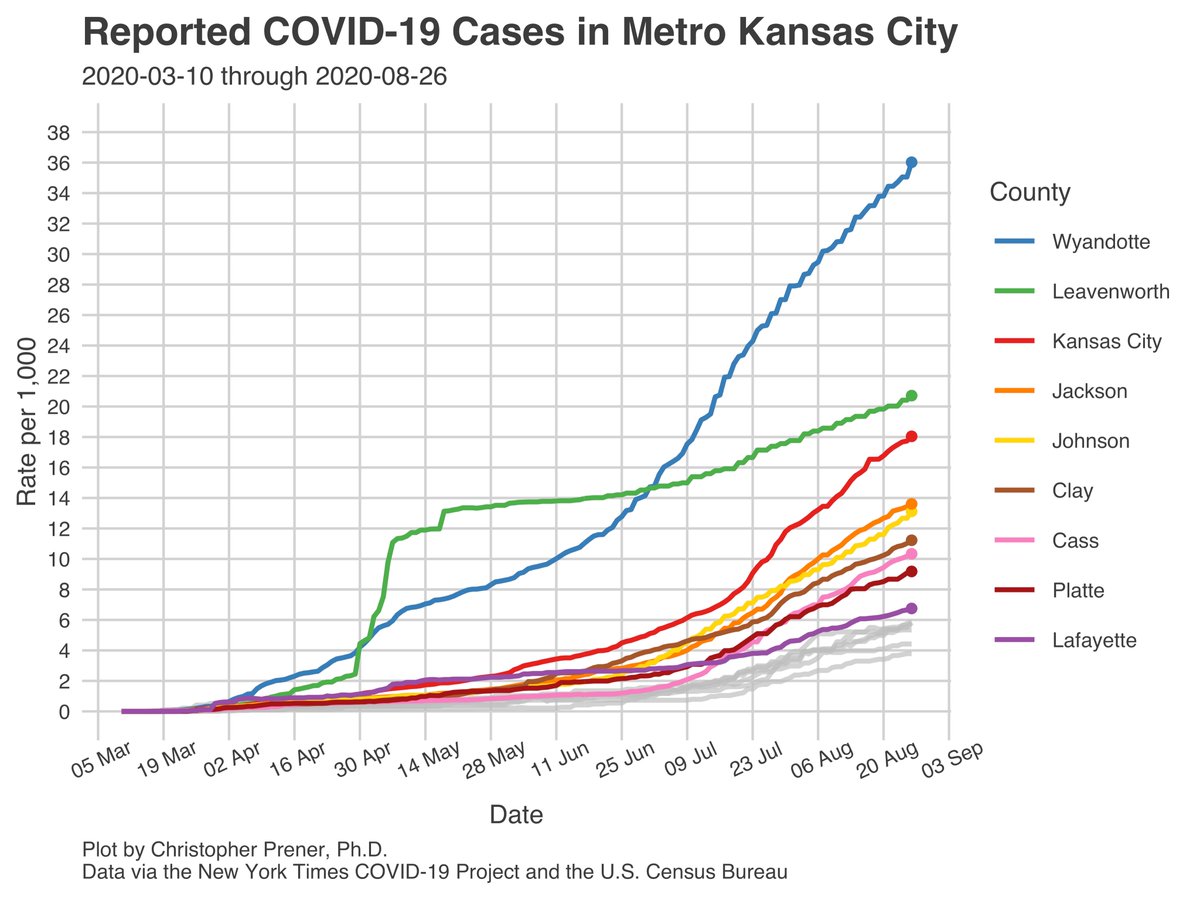
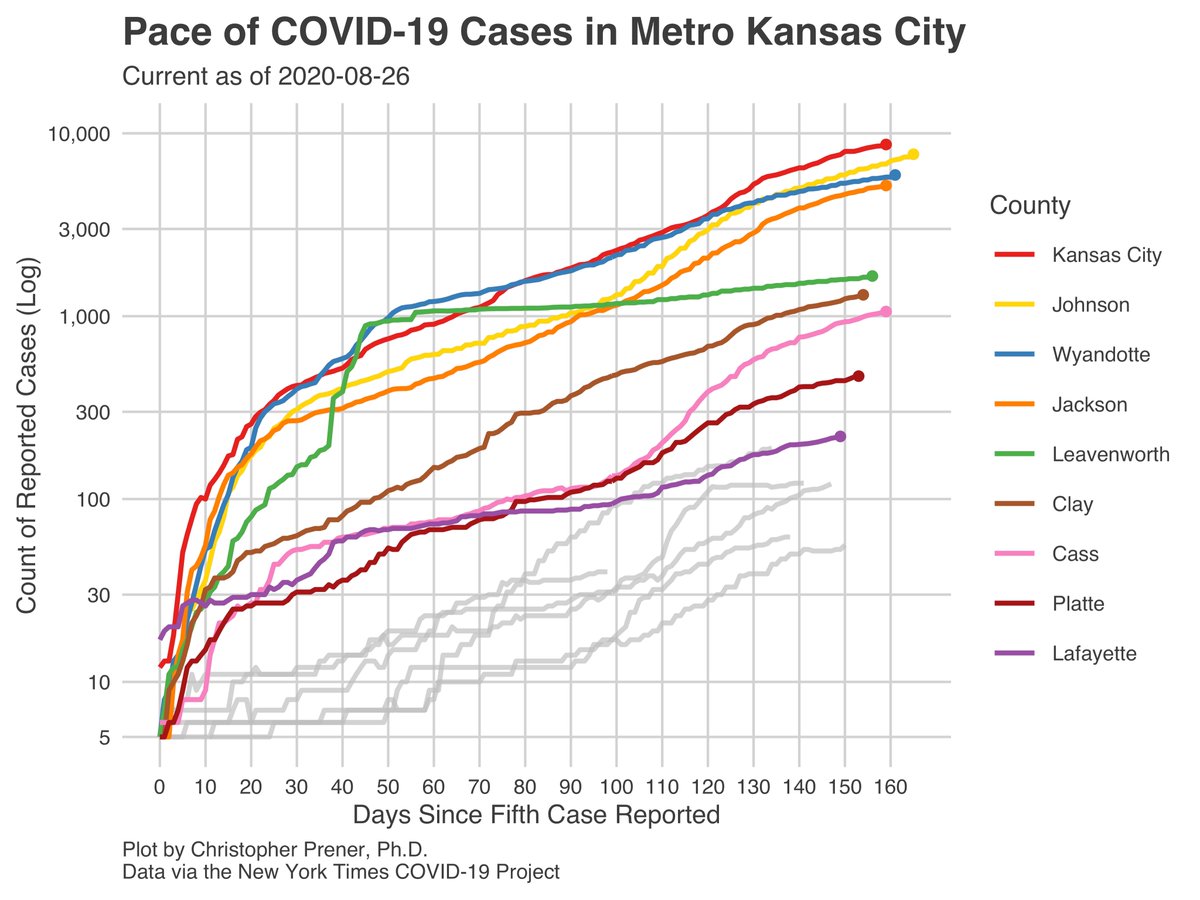
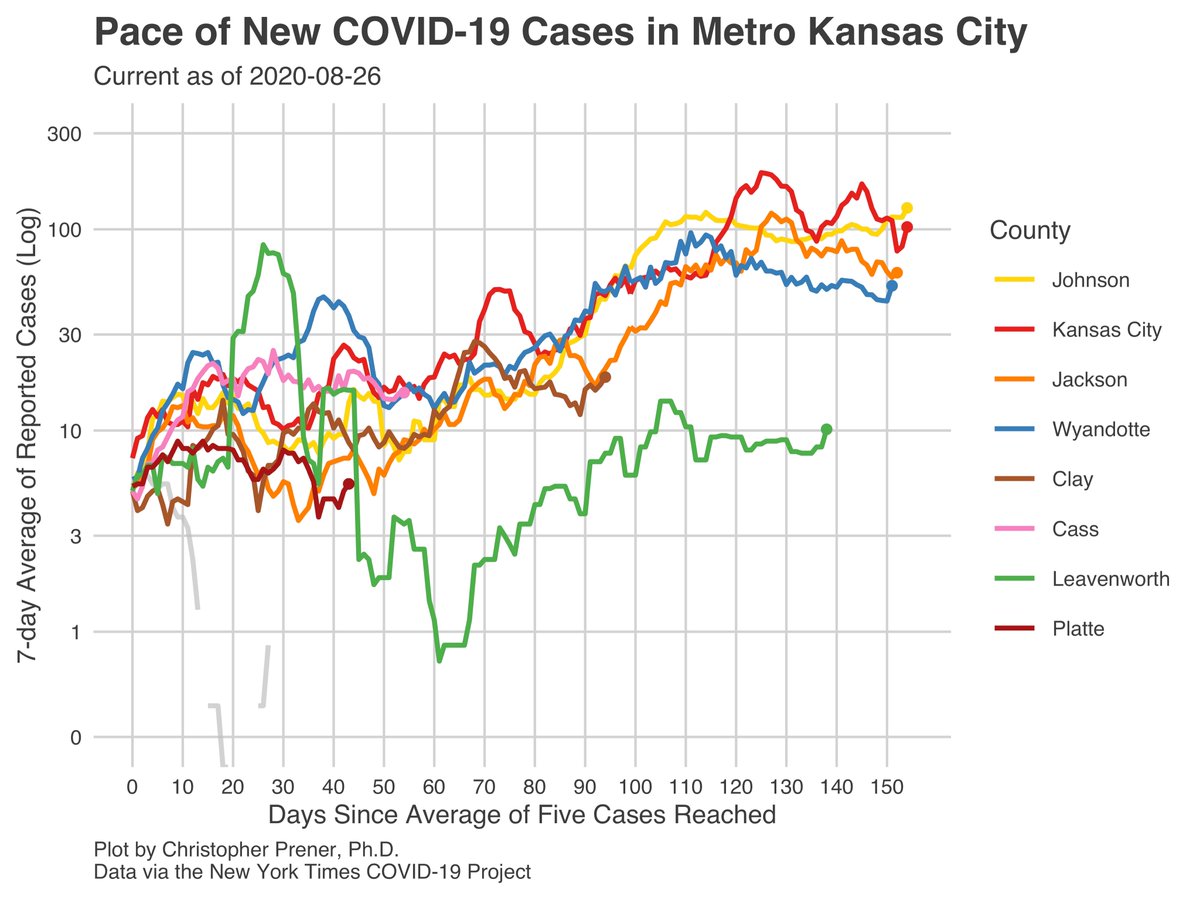
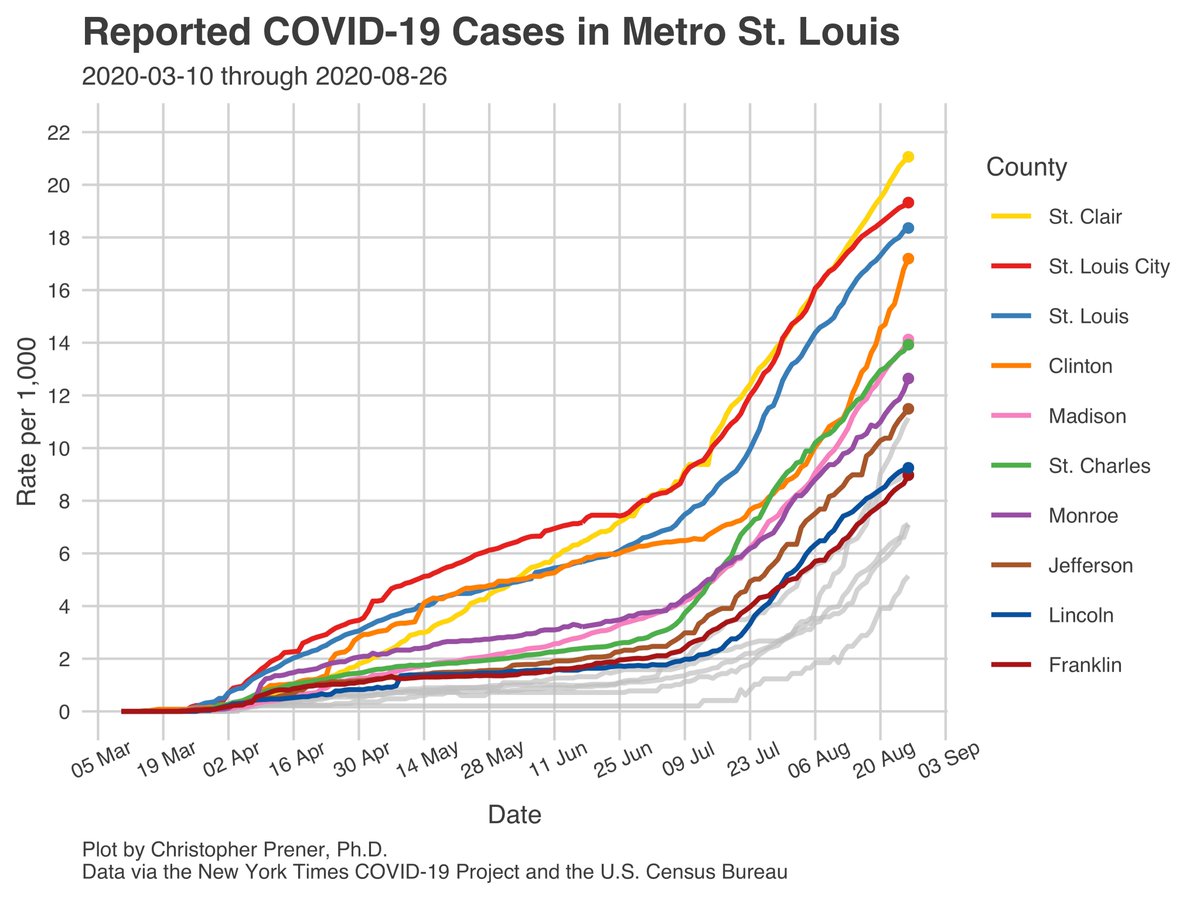
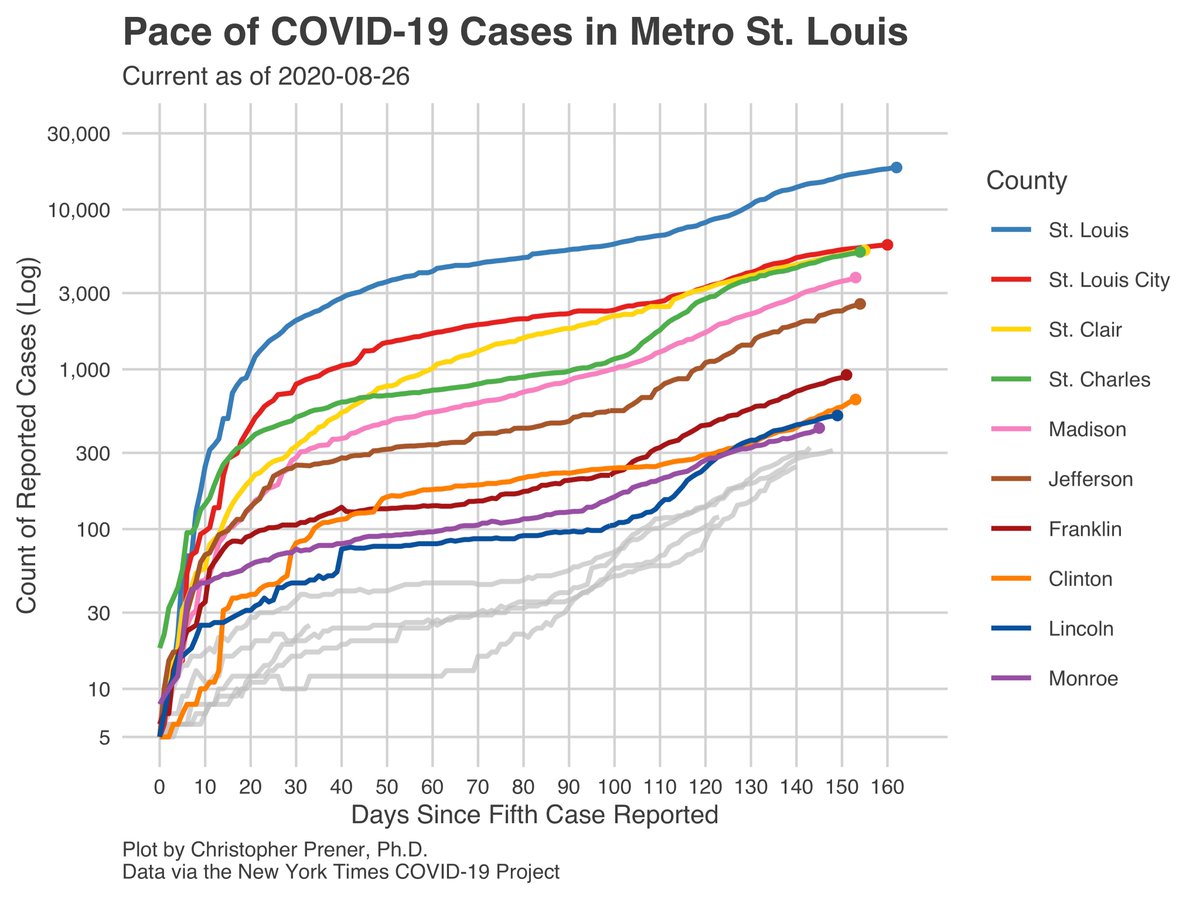
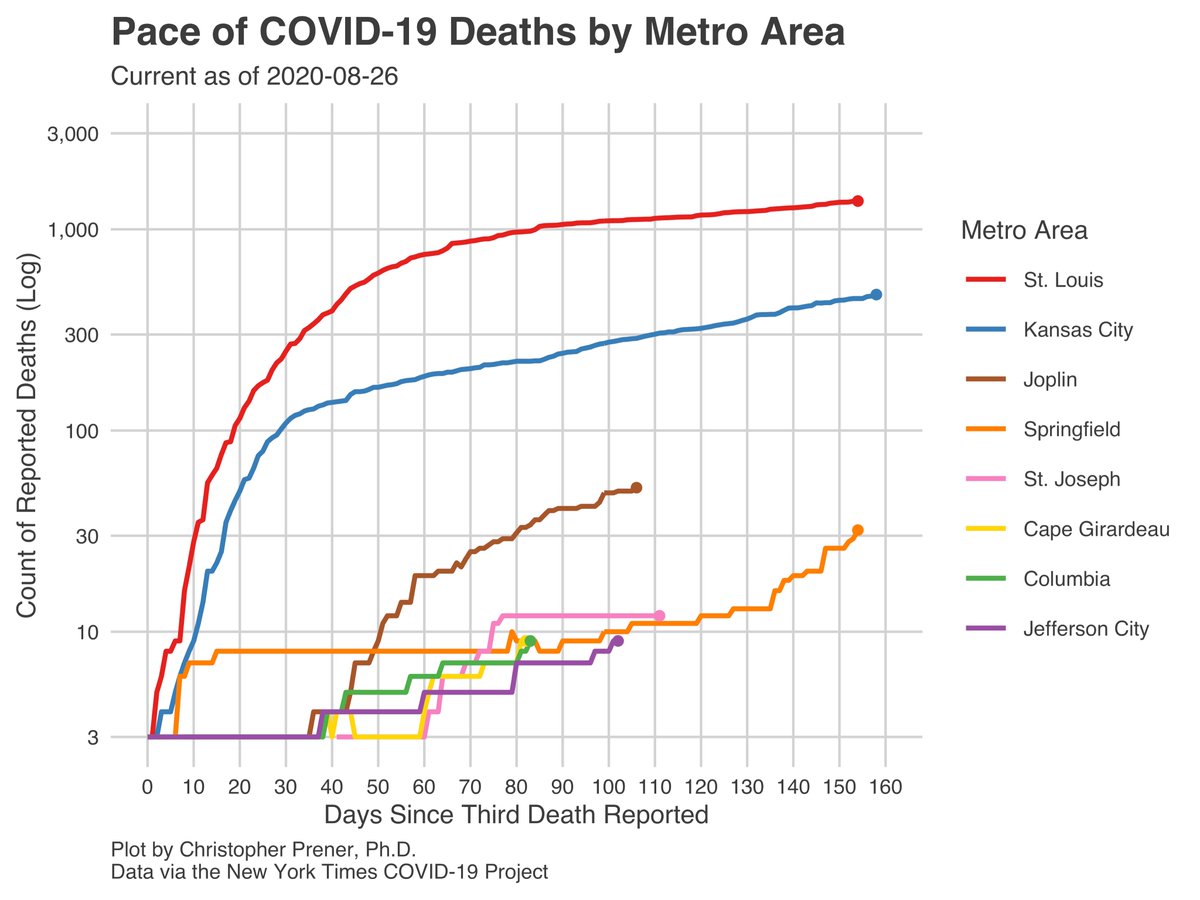
I’ve mentioned metro case rates a few times, and you can see them summarized in plots below. These underscore the substantial shift outstate from the #StLouis and #KansasCity metros, the second time we’ve really experienced this during the pandemic. 8/16
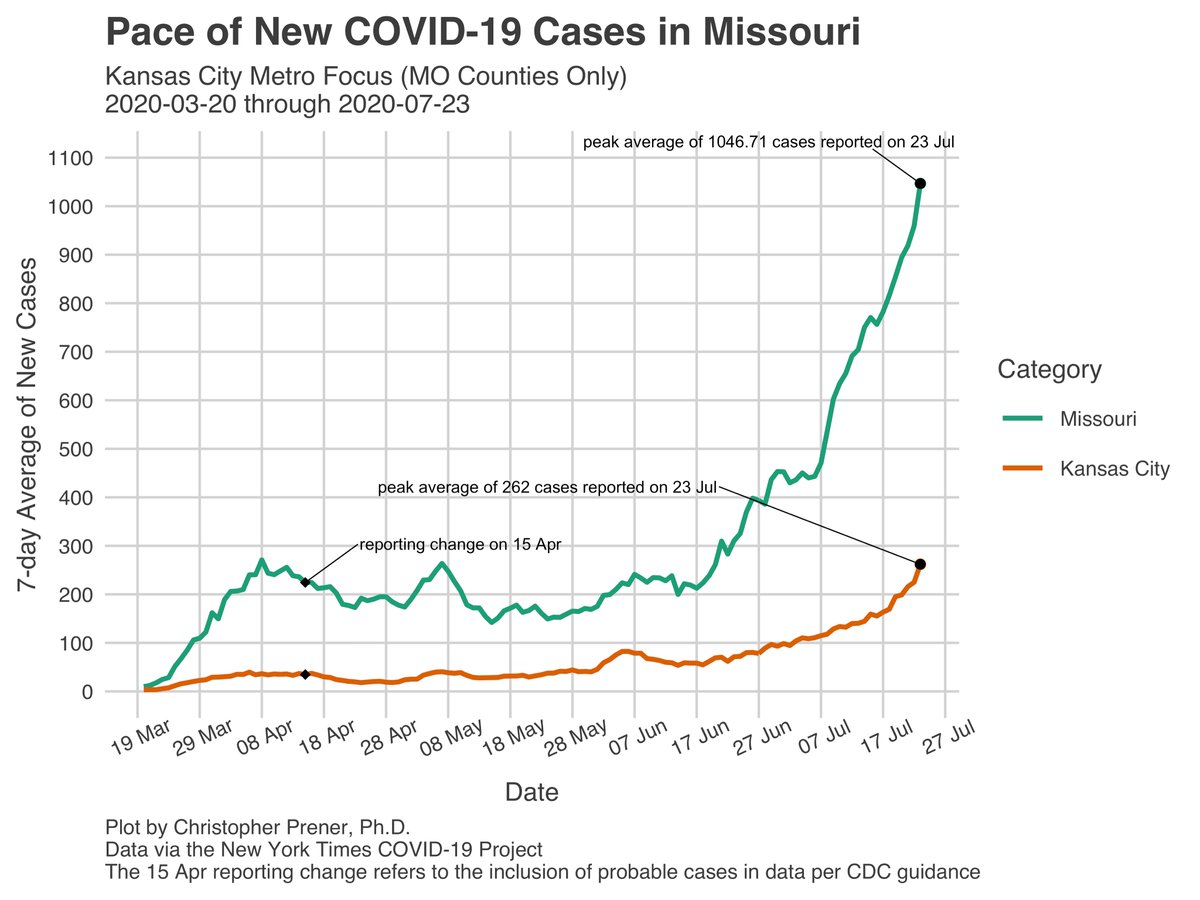
In #KansasCity, I feel slightly less positive than I did on Tuesday. There are notable upticks in the 7-day averages of new cases in a number of counties, including the city of Kansas City itself. 9/16
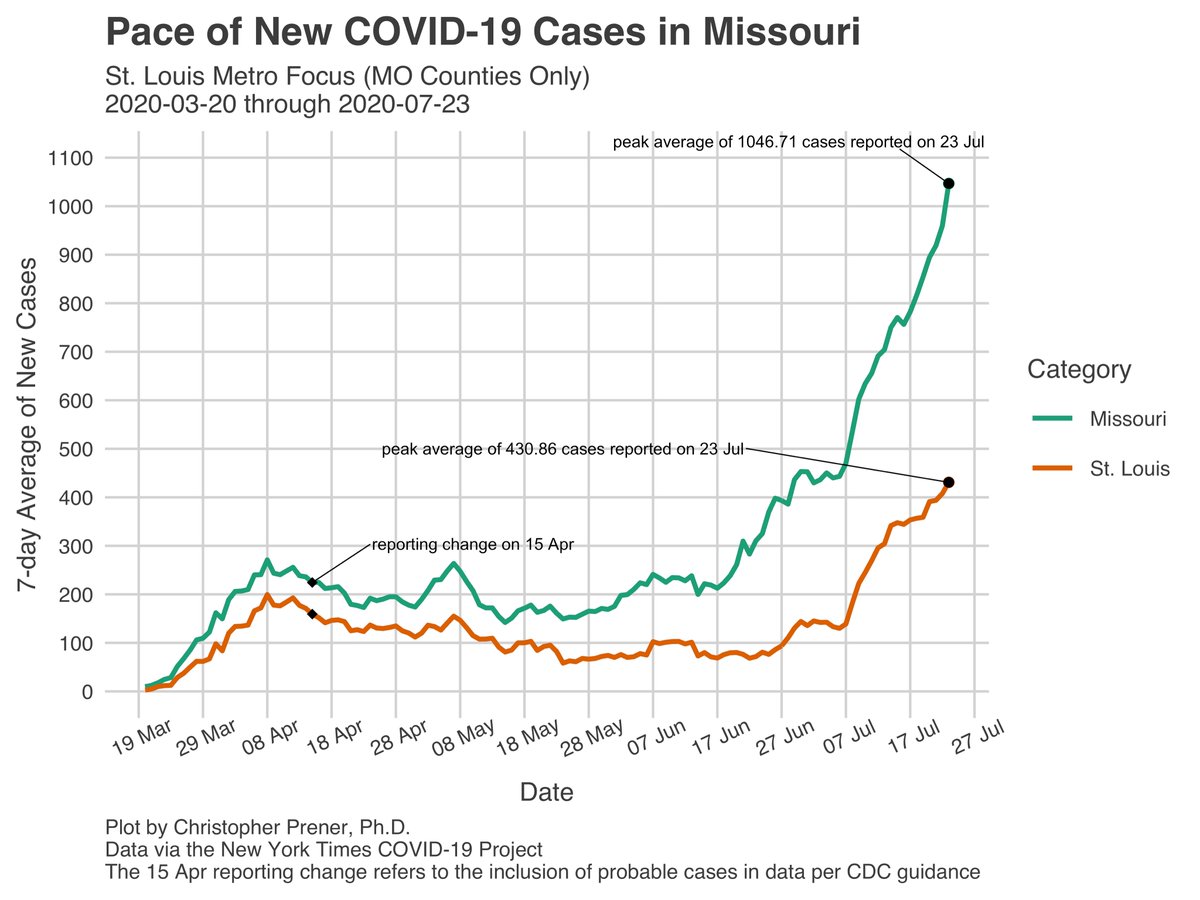
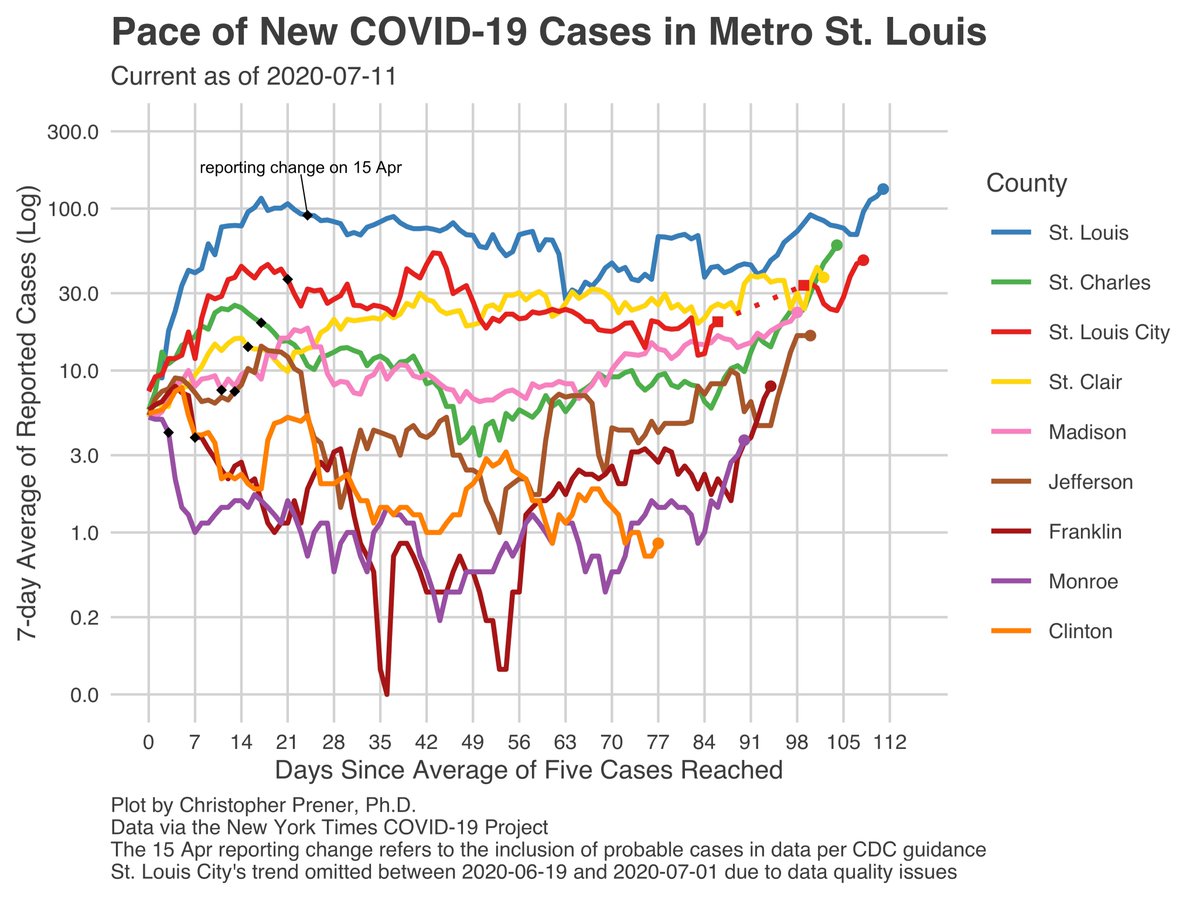
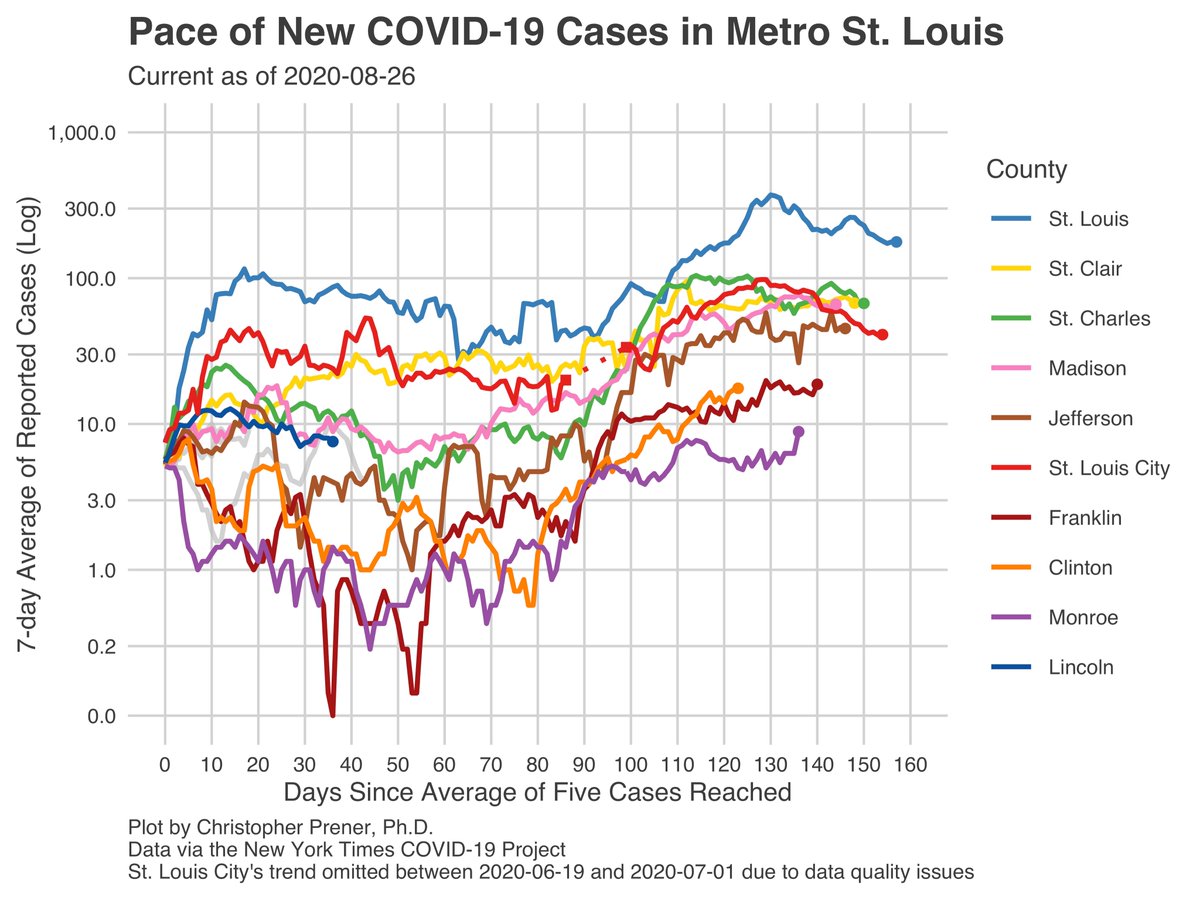
In #StLouis, though, my optimism continues. There continue to be durable downward in average new case trends for the city, the county, and St. Charles County. However, the 7-day averages in Metro East, and Jefferson/Franklin counties, are not showing the same improvements. 10/16
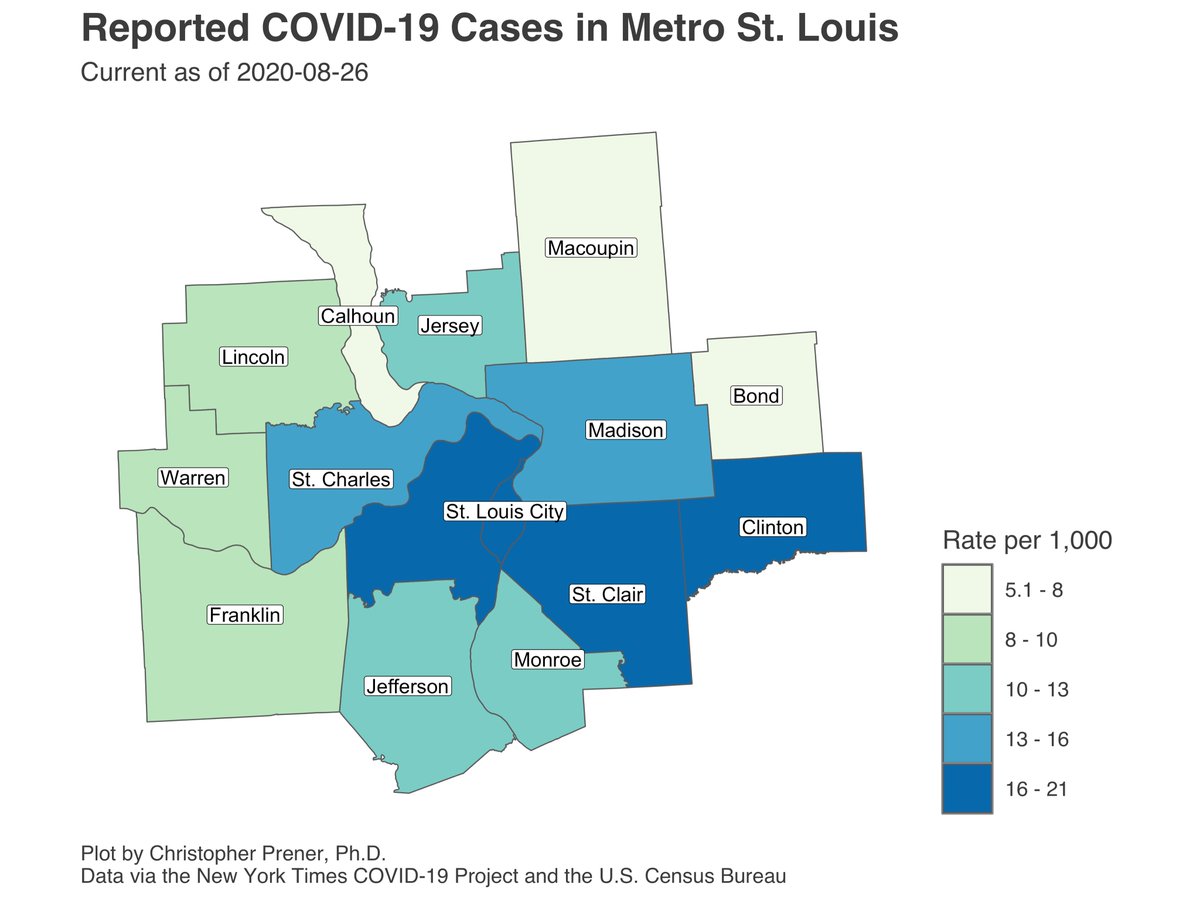
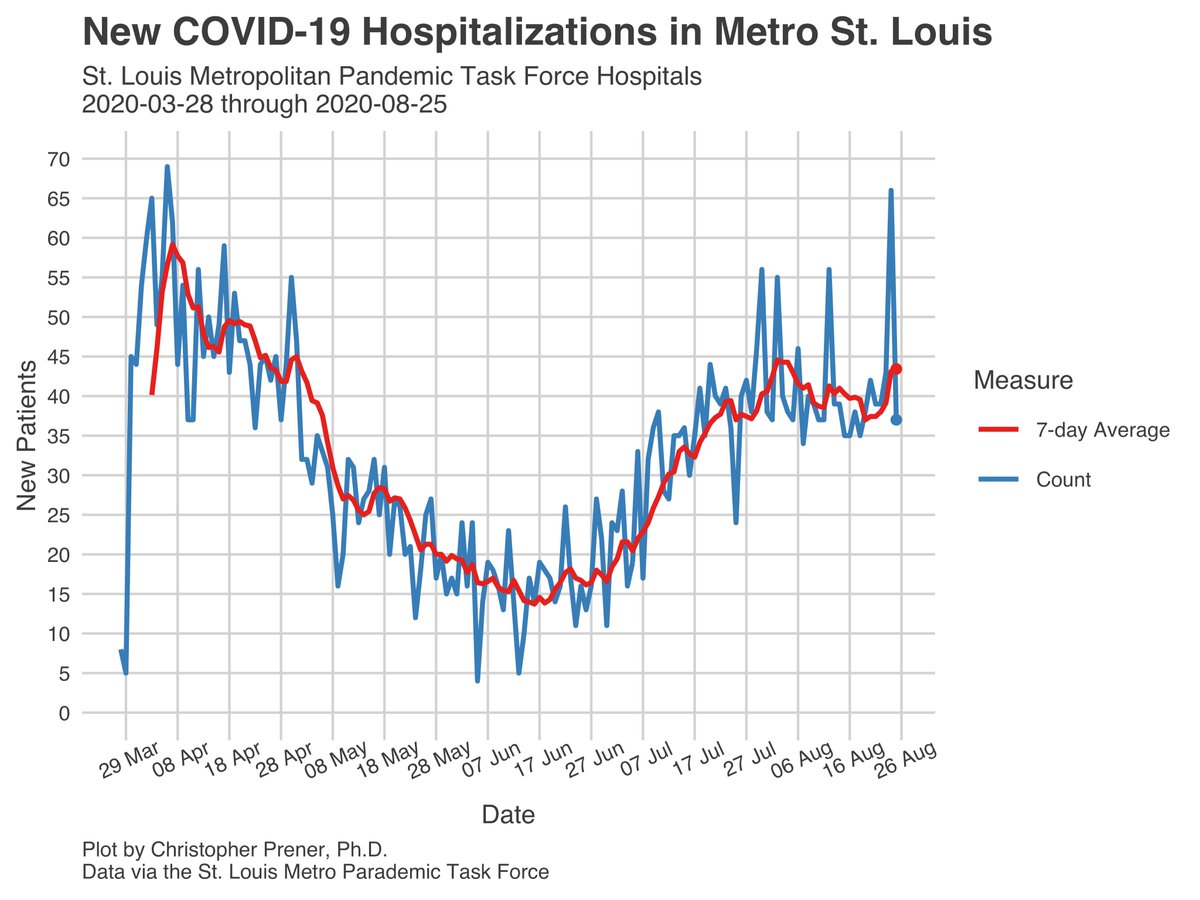
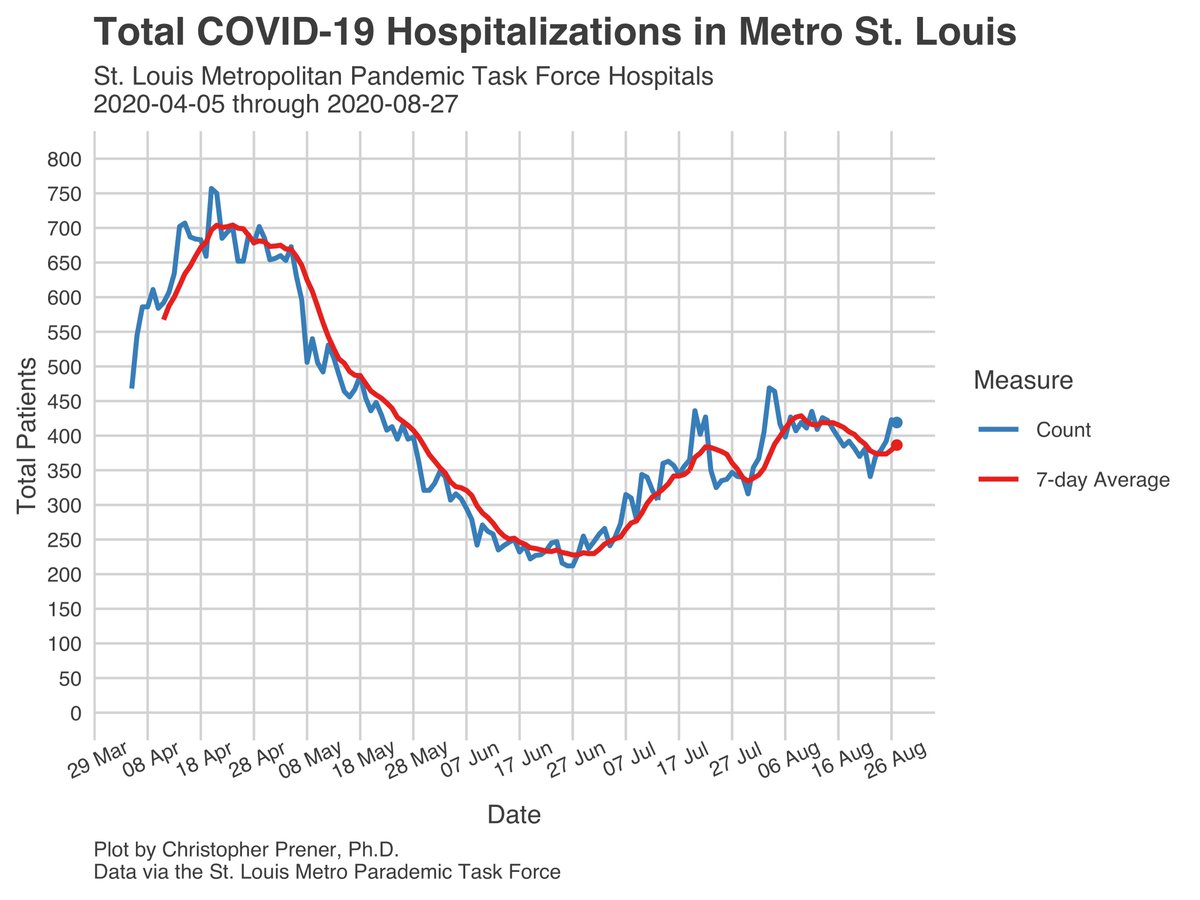
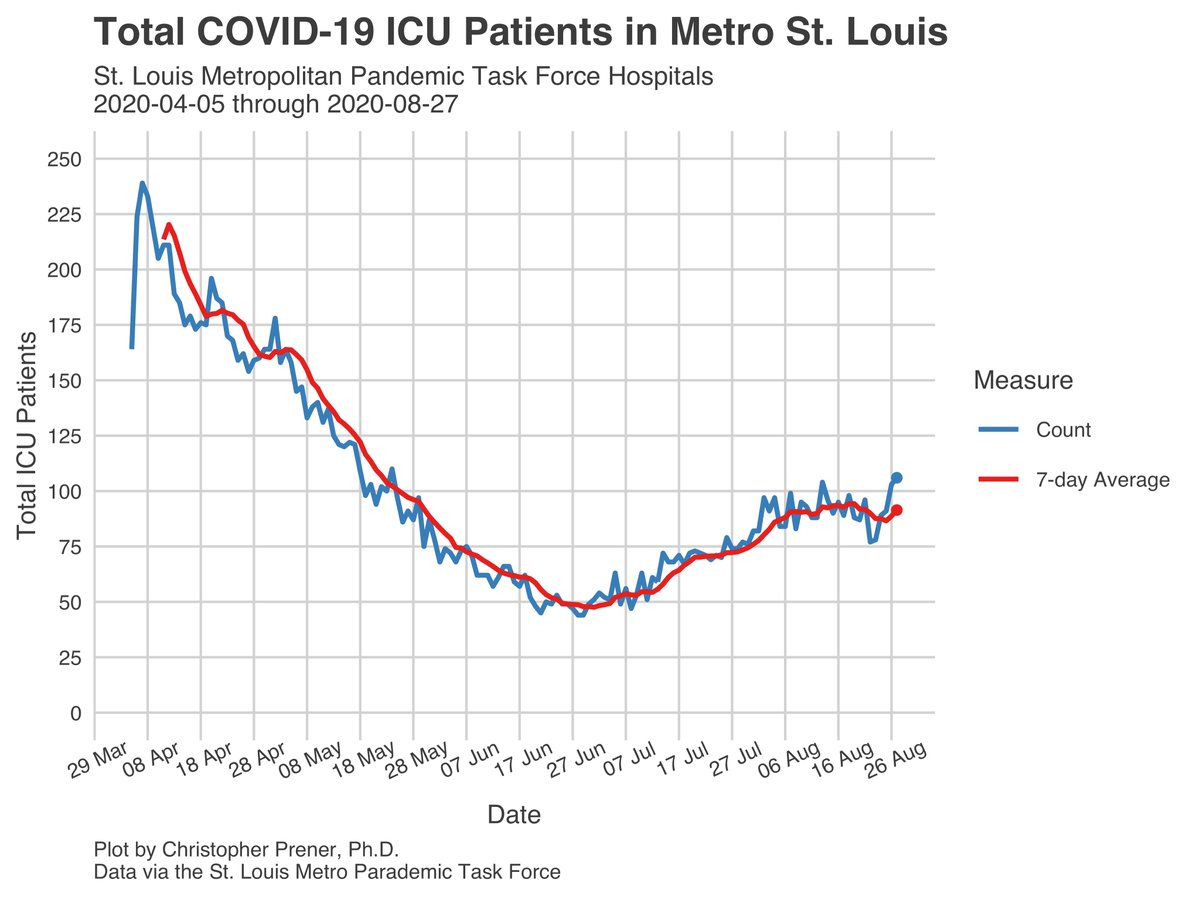
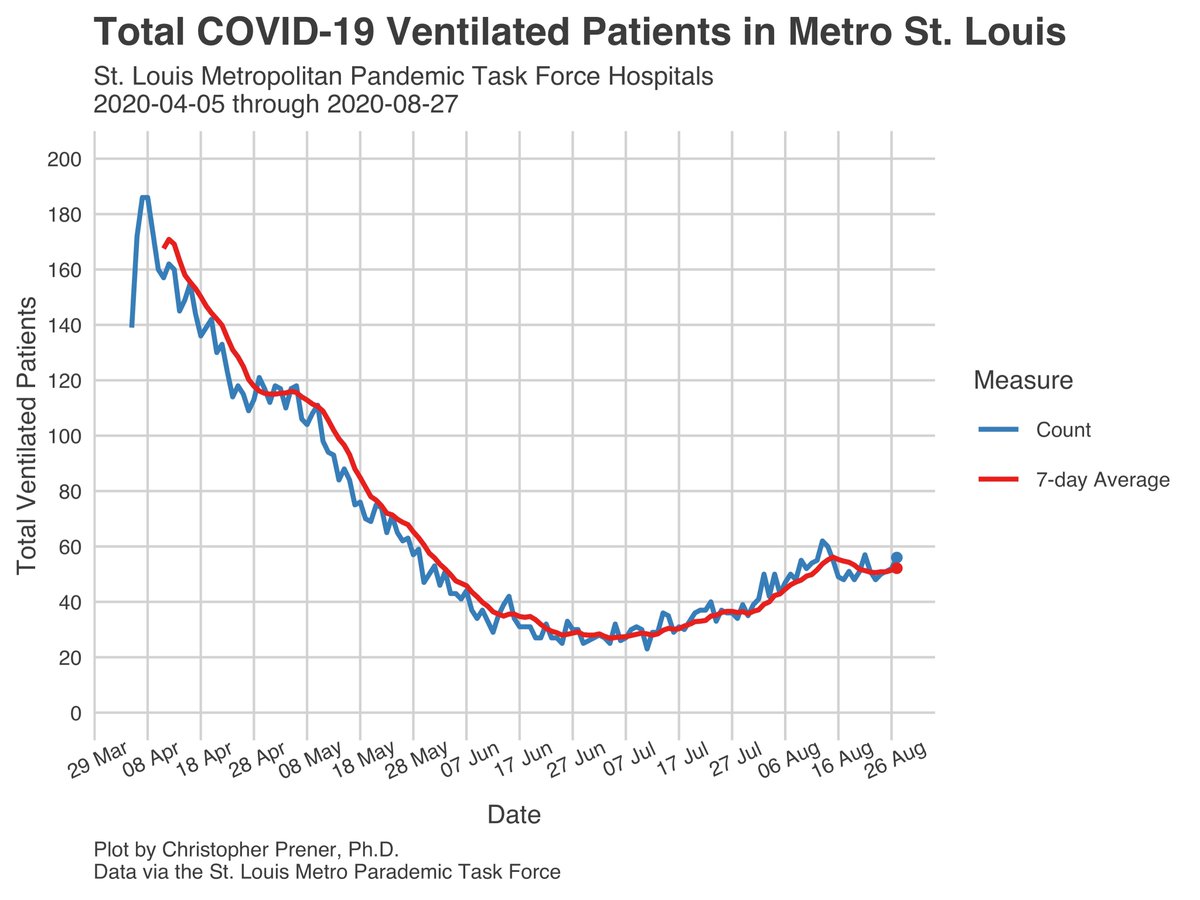
Hospitalizations in #StLouis are continuing to show broad plateaus. The new admissions number from a couple days ago has been revised down to 66. I want folks to pay attention to how “noisy” that particular blue line is - wide swings happen regularly. Focus on the trend! 11/16
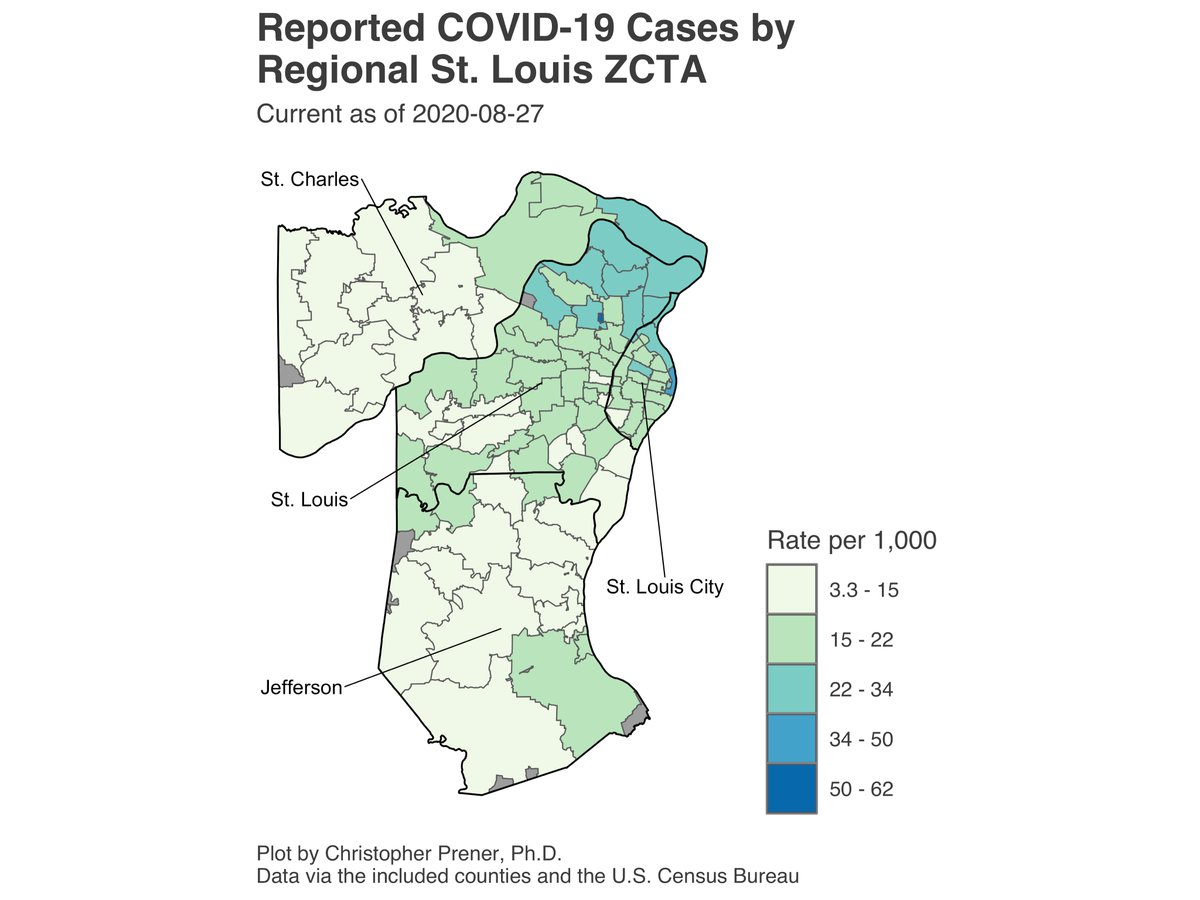
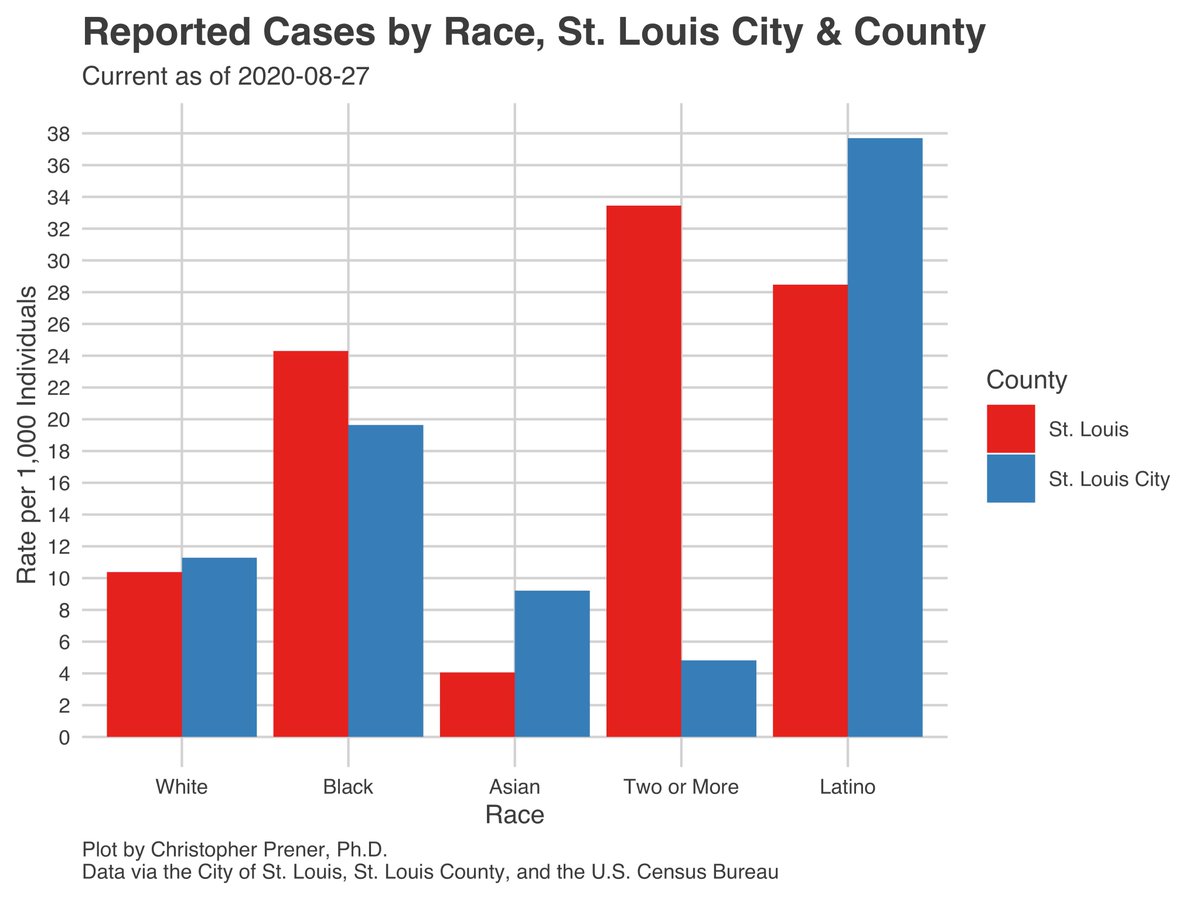
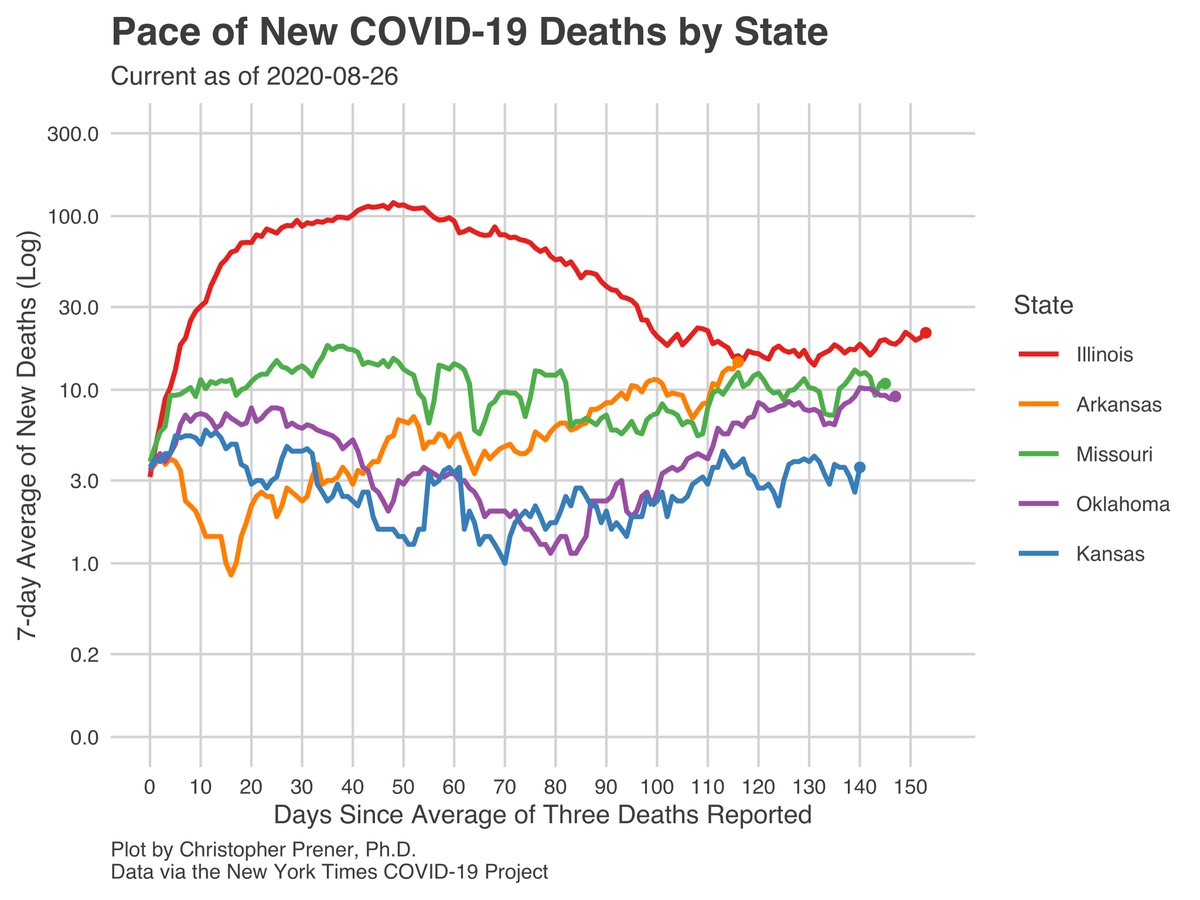
Also in #StLouis - the story is largely the same both in terms of geography (highest rates in North City and North County, with the highest in Kinloch) and in terms of racial disparities in morbidity and mortality. 12/16

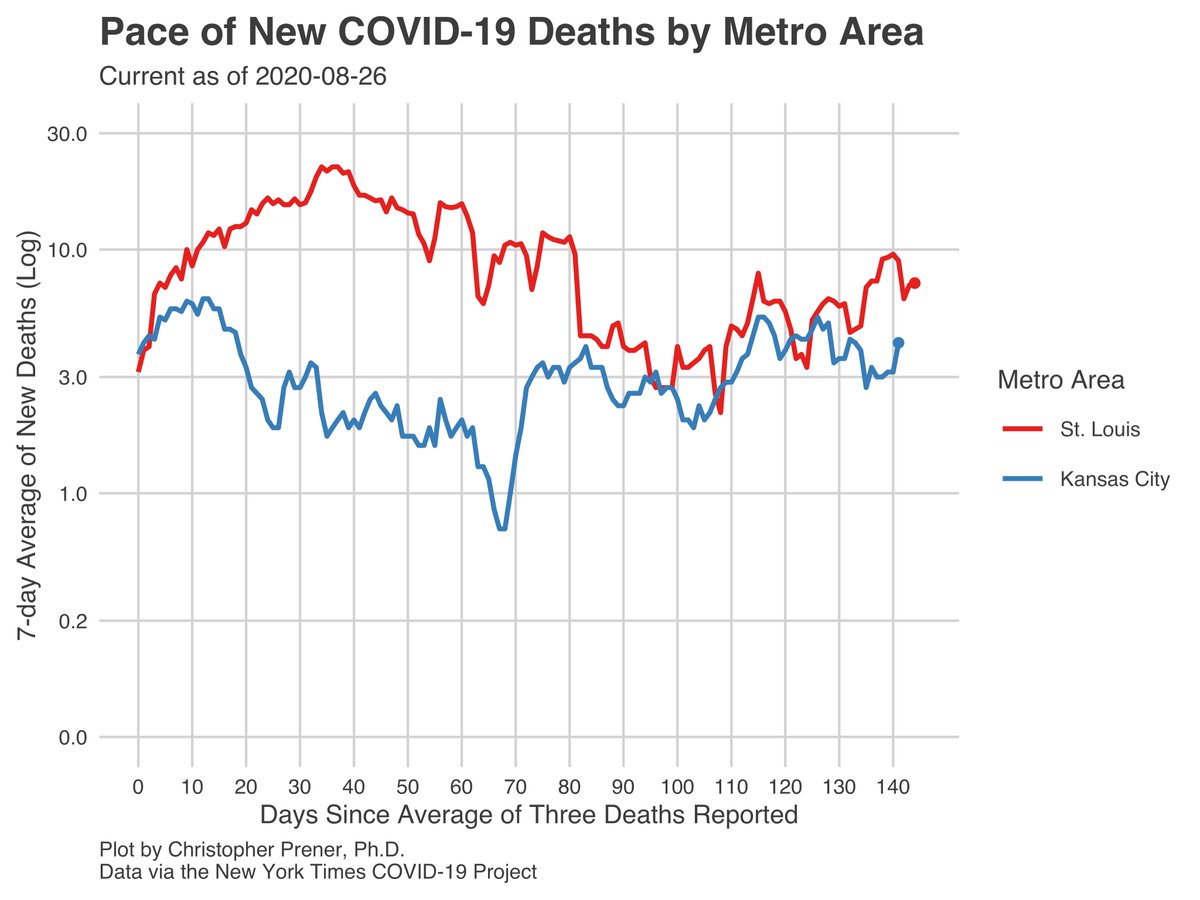
I also want to highlight mortality trends, which continue to oscillate both statewide and in the fourth metros of greatest concern - #StLouis, #KansasCity, Joplin, and Springfield. Right now they’re pointing upward, but seem to see-saw up and down regularly. 13/16
Finally, I want to point out that our statewide percent positive is back up over 14%, but I would put a little less stock in this metric right now - we’ve had a decline in testing volume and % positive loses a bit of its precision when the testing environment changes. 14/16


My standard caveats about uncertainty - infections (1) are historical data that reflect infections 2-3 weeks ago, (2) are biased by testing patterns, (3) may include probable but unconfirmed cases in some counties, and (4) rates are not individual probabilities of illness. 15/16
Additional maps and plots are on my tracking site - slu-opengis.github.io/covid_daily_vi….
Next 🧵 will be next Tuesday, 9/1.
16/16
Next 🧵 will be next Tuesday, 9/1.
16/16