If @nytimes report is correct that diagnosis in vaccine recipient is transverse myelitis (TM), then level of concern goes up tinyurl.com/yygkas9s Why? First, biologic plausibility: an immunologically-mediated attack is what we worry about re: vaccine side effects (1/4; Thread)
Second, transverse myelitis is fairly unusual, with estimated 24 cases/million in U.S. (if you include transverse myelitis that turn out to be initial presentation of multiple sclerosis, and not just isolated transverse myelitis, which is even rarer) tinyurl.com/y4dugqg7 (2/4)
Via back-of-envelope math, over 2 months, among 15,000 people (approximate # that have been vaccinated; ~half of 30K in the trial; the other half get placebo), the baseline expectation is that 0.06 pt would get TM in absence of vaccine. So concern re: cause & effect is real (3/4)
We'll need to wait for more info (Is TM truly the diagnosis? Did patient have other risk factors for TM? Any hint of other immunologic side effects in other vaccine recipients?). But, based on the above, the concerns have merit and a full investigation seems prudent (4/4).(End)

• • •

Missing some Tweet in this thread? You can try to force a refresh
 

Keep Current with Bob Wachter

Bob Wachter Profile picture

Stay in touch and get notified when new unrolls are available from this author!

Read all threads

This Thread may be Removed Anytime!

PDF

Twitter may remove this content at anytime! Save it as PDF for later use!

Try unrolling a thread yourself!

how to unroll video
  1. Follow @ThreadReaderApp to mention us!

  2. From a Twitter thread mention us with a keyword "unroll"
@threadreaderapp unroll

Practice here first or read more on our help page!

More from @Bob_Wachter

11 Sep
1/ Covid (@UCSF) Chronicles, Day 177

Nice to re-start our Covid grand rounds today. Available here: tinyurl.com/yyw5myns. We covered a range of epi issues (the shape of the pandemic, changing mortality rate of Covid) and highlighted a novel new therapeutic approach: AeroNabs.
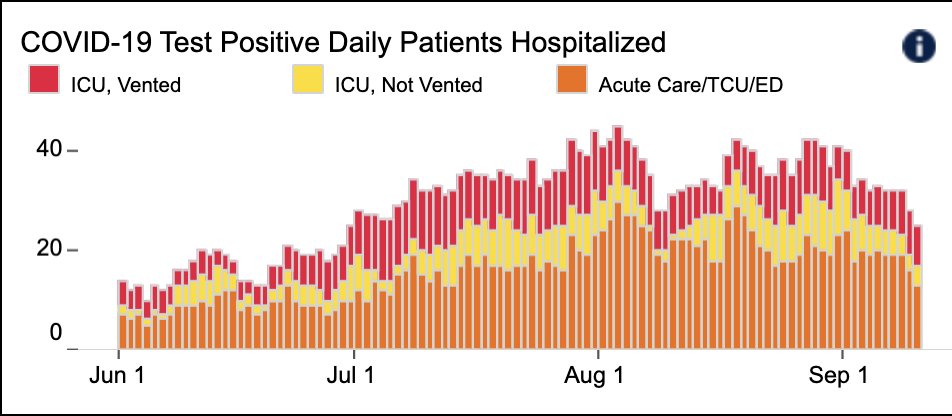
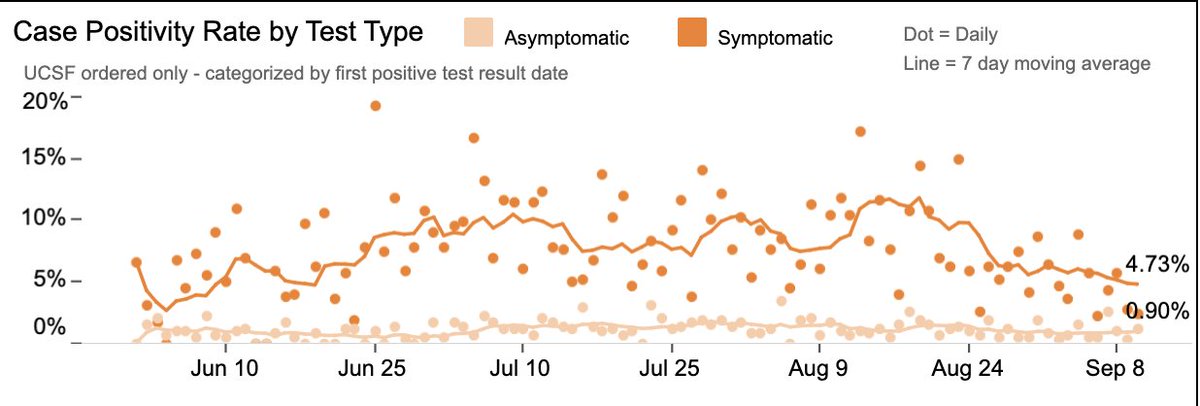
2/ @UCSFHospitals: continued good news, with fewer hospitalized pts (23, w/ 7 on vents), lowest since June (Fig on L). Test positivity 2.7%: 4.7% in pts w/ symptoms (down); 0.9% in pts w/o (a bit up) (Fig R). Sx/Asx ratio usually ~10:1; not sure what 5:1 ratio means. Prob a blip.
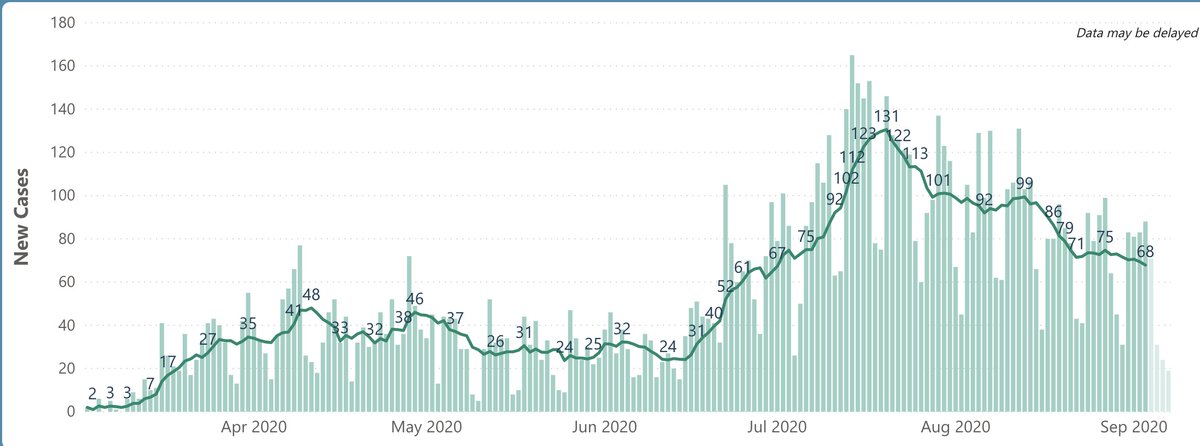
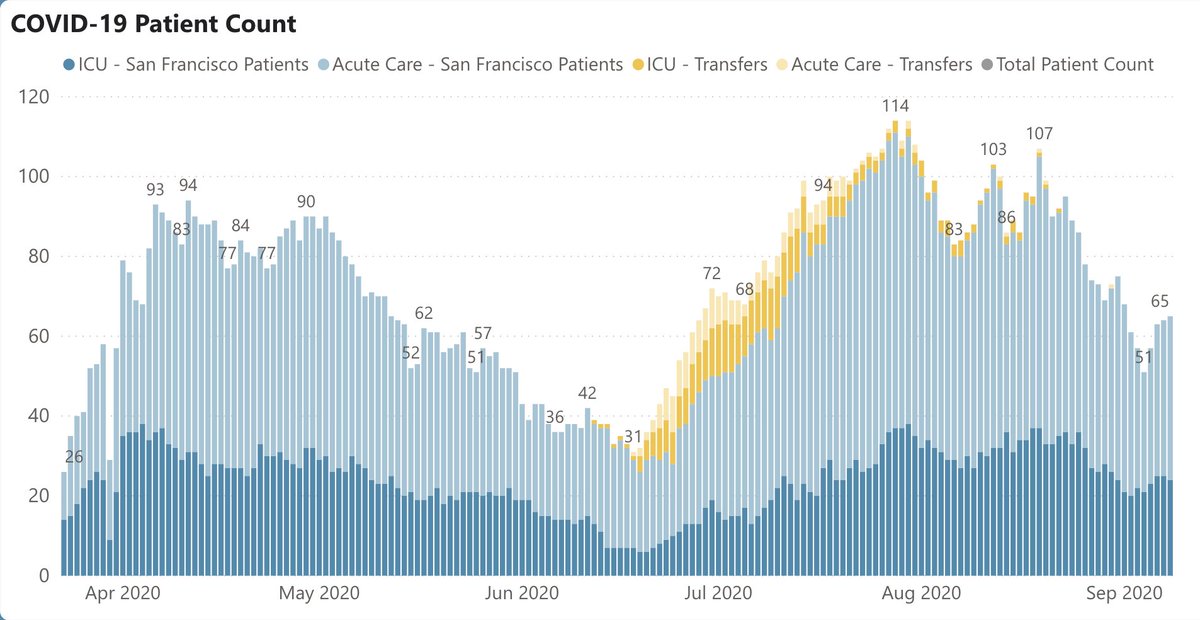
3/ SF: daily case rate down to 68, half of the peak in July (Fig on L). Total of 88 deaths since March; more on this amazing # later. SF case positivity rate 2.1%. SF hospitalizations also going in right direction: 65 total, also ~half of peak in July (Fig R).
Read 23 tweets
5 Sep
1/ Covid (@UCSF) Chronicles, Day 171

Ending 2 weeks off in (totally) smoke-free & (relatively) Covid-free New Hampshire. As I resurface, I’m reminded of the scene in Hamilton in which Jefferson, after 5 yrs in Paris, asks “What’d I miss?” tinyurl.com/y5a87hna Answer: plenty.
2/ I’ll start with an update on local numbers, then segue to the most meaningful events and trends since mid-August. I’ll focus on 3 biggies: the phase of the pandemic, testing, & vaccines. Of course, in today's world, you can’t talk about any of it without talking politics too.
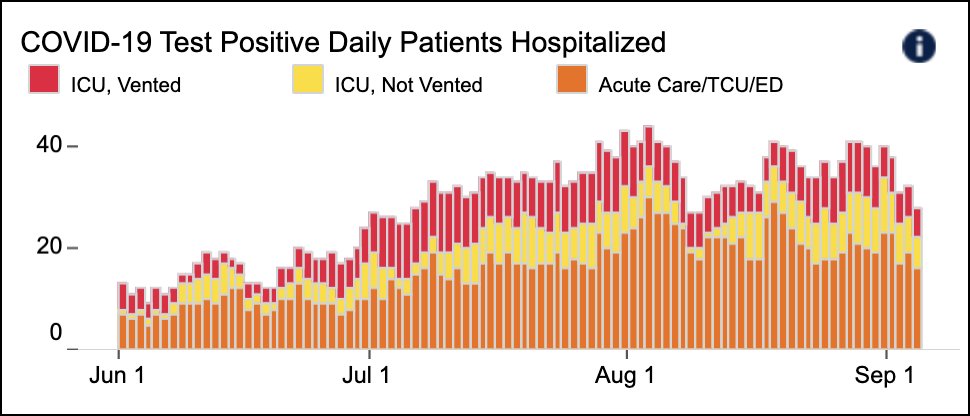
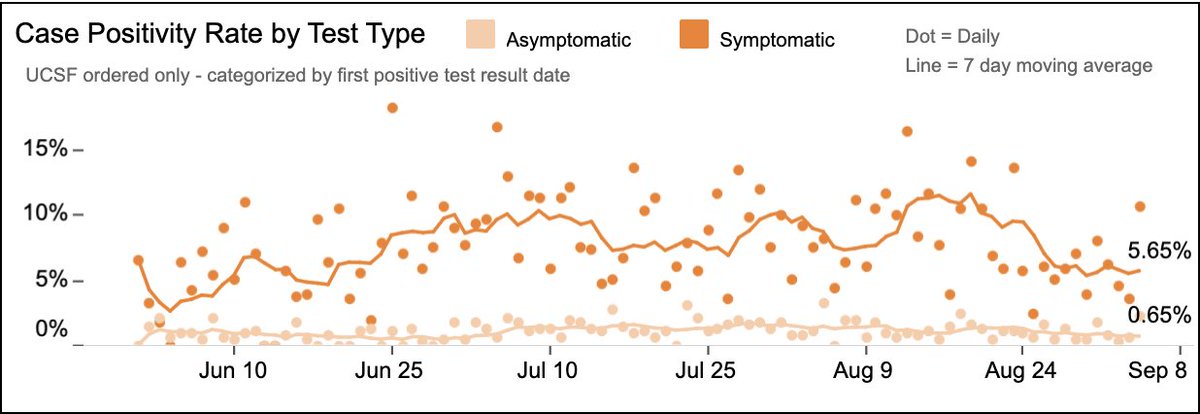
3/ Beginning with @UCSF and SF: things are looking pretty good. @UCSFHospitals, 28 cases, 6 on vents (Fig L). While not matching our lows of May/June, big improvement from last mth. Case positivity rate also down by ~50% (Fig R): 5.65% in pts w/ symptoms; 0.65% in asymptomatic.
Read 25 tweets
22 Aug
1/ Covid (@UCSF) Chronicles, Day 157

We’re only 6 months into Covid in the U.S., a little early for déjà vu, but I’m definitely experiencing it – the calm-before-the-storm feeling I had in May, as the numbers fell in the Northeast and we thought that we were over the worst.
2/ Today, after SF updates, I’ll lay out my thinking about what the next few months may have in store, including the prospects of another surge. I’m worried that September will be mellow – just as May was – and we’ll let our guard down… only to be slammed again in October.
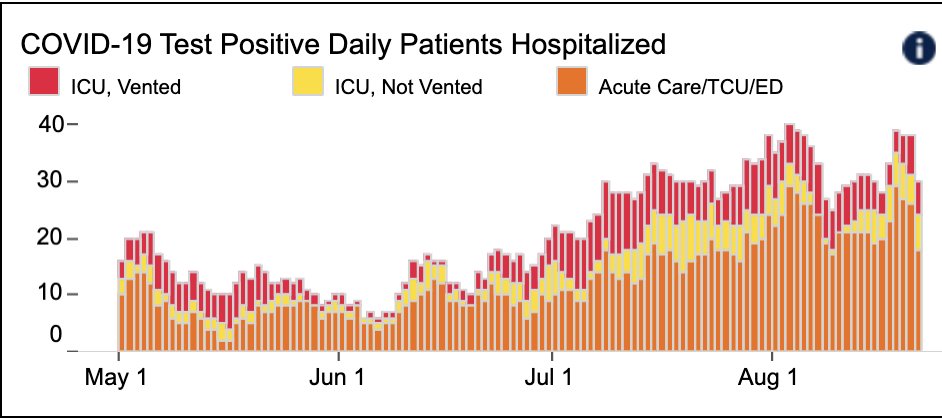
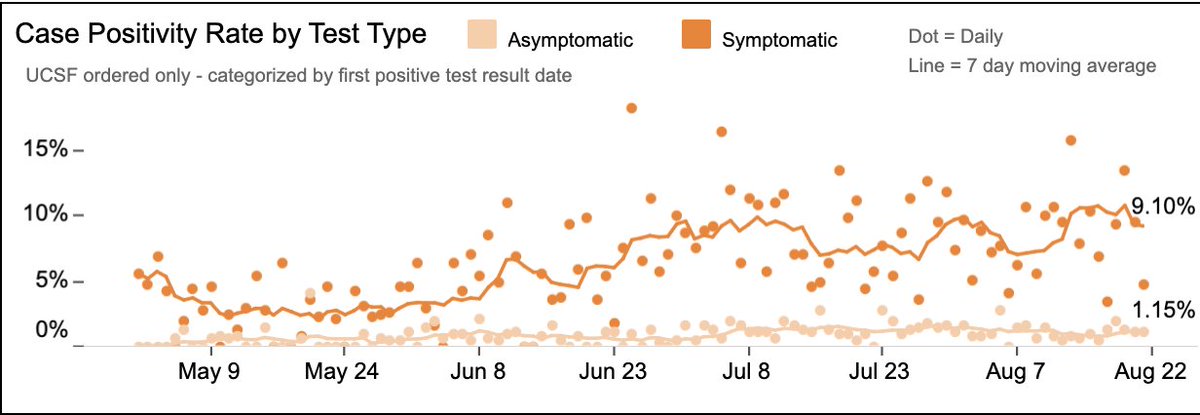
3/ @UCSFHospitals, 30 pts, 6 on vents (Fig L). Test positivity rate 2.6%; 9.1% in pts w/ symptoms; 1.15% in pts w/o (Fig R). All of these numbers are up a bit in the last month. We have plenty of capacity, but it would be good to come down from these too-high plateaus.
Read 24 tweets
15 Aug
1/ Covid (@UCSF) Chronicles, Day 150

Today, 150 days since I began my Covid tweets, I’m going to do something odd: write the speech that Trump should give. I have no faith he’ll do so, but it’s worth recognizing how little it would take to change course & save lives. Here goes:
2/ My fellow Americans:
3/ It’s been six months since the coronavirus – the virus that causes Covid-19 – first entered our country. In that time, the disease has killed more than 160,000 of our fellow citizens, sickened millions, devastated our economy, & exposed a number of fault lines in our society.
Read 25 tweets
14 Aug
1/ Covid (@UCSF) Chronicles, Day 149

Grand rounds today: . As we hit Covid’s 6 month mark in the U.S., we’re desperate for innovative approaches. Today, I decided to focus on 3 impressive ones – across a range of disciplines: testing, epi, & narrative.
2/ First, local updates. Things are still OK @UCSF, SF, & CA. @UCSFHospitals, 29 pts, only 5 on vents (Fig) – lowest vent # in about a month. Interestingly, @ZSFGCare (our county hospital) has more Covid: 38 pts, 14 vents. In March/April, UCSF & ZSFG tended to run about even…
3/ …so this is likely another sign that Covid is hitting underserved populations more heavily, since ZSFG is city’s safety net hospital. SF is averaging 91 cases/d, down ~30% from peak last mth (Fig on L). Hospitalizations up a bit @ 94 (Fig R), but still well below peak of 114.
Read 25 tweets
8 Aug
1/ Covid (@UCSF) Chronicles, Day 143

Happy Friday. Today I’ll begin with a deeper-than-usual dive into our local situation: SF, @UCSF, and CA. I’ll follow with a few observations from my recent stint caring for patients on the wards @UCSFHospitals.
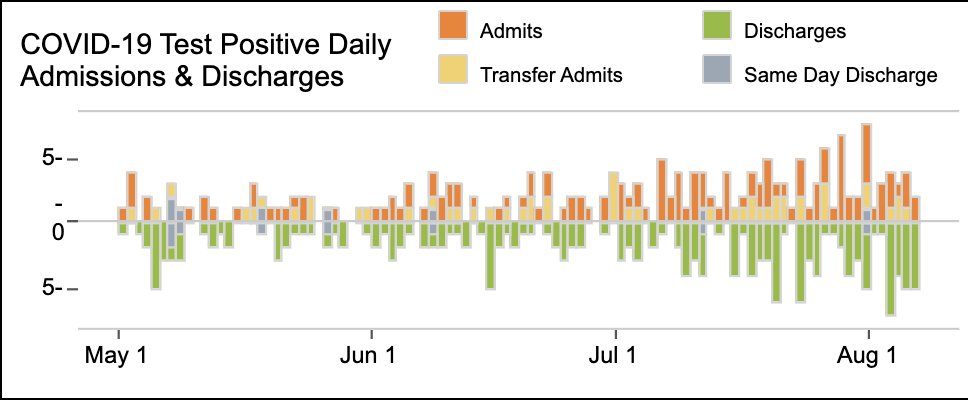
2/ @UCSF & SF trending better. @UCSFHospitals, 29 pts (lowest since July 27), 9 on vents (Fig L). Fig R is admits/discharges, showing more d/c’s. Avg length of stay is 8d for non-ICU pts, 22d for ICU pts, which explains lag between less virus in community & fewer hosp pts.
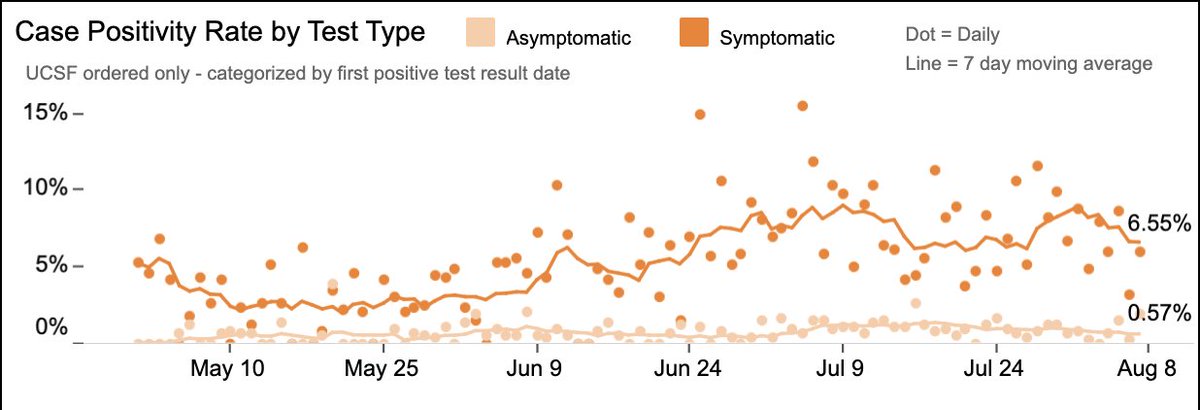
3/ Overall @UCSF case-positivity rate is 2.4%. Rates in pts with Covid symptoms (6.55%) & without (0.57%) both falling. Latter # is my quick-&-dirty way of estimating the odds that a person on a SF elevator with me is infected. Not quite at May levels (~0.3%), but getting closer.
Read 25 tweets

Did Thread Reader help you today?

Support us! We are indie developers!


This site is made by just two indie developers on a laptop doing marketing, support and development! Read more about the story.

Become a Premium Member ($3/month or $30/year) and get exclusive features!

Become Premium

Too expensive? Make a small donation by buying us coffee ($5) or help with server cost ($10)

Donate via Paypal Become our Patreon

Thank you for your support!

Follow Us on Twitter!