Stocks for 24/09/20 Intraday
Based on NR7:
#KOTAKBANK
#GLENMARK
#BIOCON
#TITAN
#ICICIPRULI
Based on NR4:
#BANDHANBNK
#HDFCBANK
#CIPLA
#GRANULES
#CADILAHC
Including NR4 too to increase my options for tomorrow
Based on NR7:
#KOTAKBANK
#GLENMARK
#BIOCON
#TITAN
#ICICIPRULI
Based on NR4:
#BANDHANBNK
#HDFCBANK
#CIPLA
#GRANULES
#CADILAHC
Including NR4 too to increase my options for tomorrow
Some of you asked what I meant by "Volatility Concept"
while selecting stocks
Basically, you don't want stocks which are not moving organically, doing pump/dump, staying flat, or forming too many gaps
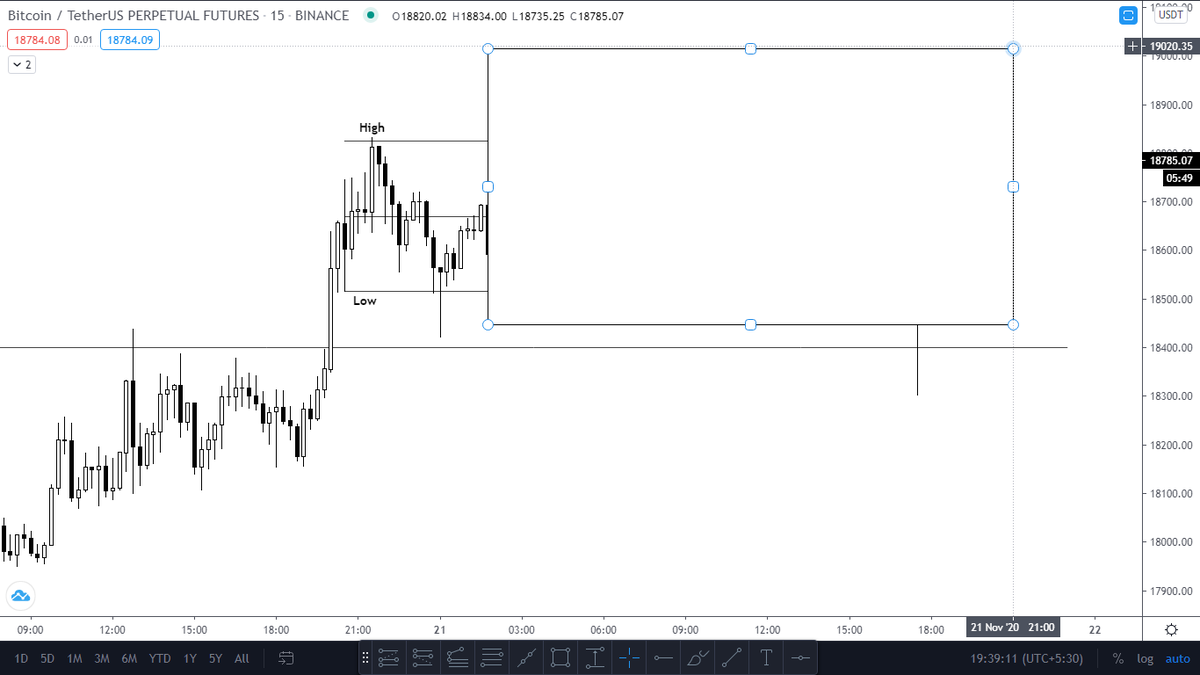
These were NR7 stocks which I rejected because of above reasons:

while selecting stocks
Basically, you don't want stocks which are not moving organically, doing pump/dump, staying flat, or forming too many gaps
These were NR7 stocks which I rejected because of above reasons:


Results of the Day: 4/10 Stocks gave tradeable moves
A tricky, no easy setups day today
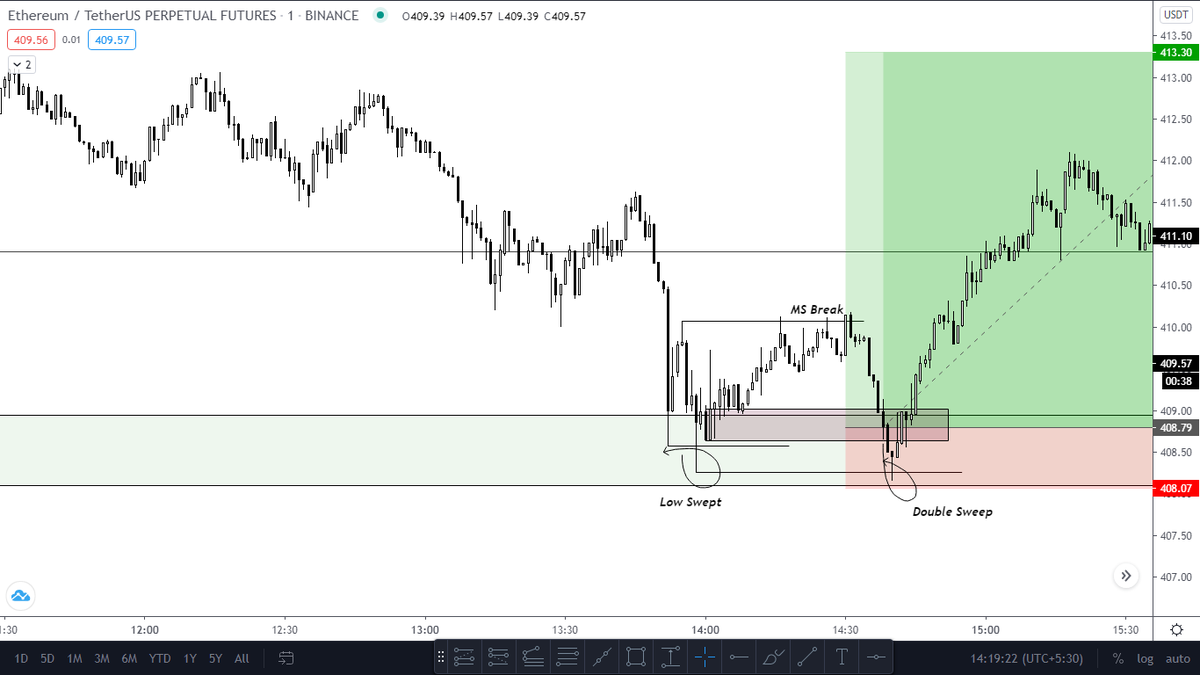
1/4 : #KOTAKBANK : PROFIT : +1.7R
As posted earlier:
It gave a loss of -1R, followed by another signal giving +2R
A tricky, no easy setups day today
1/4 : #KOTAKBANK : PROFIT : +1.7R
As posted earlier:
https://twitter.com/Swapniltrader/status/1309049132850520064?s=20
It gave a loss of -1R, followed by another signal giving +2R

2/4 : #ICICIPRULI : PROFIT : +1.2R
Same concept, price rejecting from highs.
However, follow through was lacking and formed a lot of indecision candles. Exit after two consecutive Bullish candles
Same concept, price rejecting from highs.
However, follow through was lacking and formed a lot of indecision candles. Exit after two consecutive Bullish candles

3/4 : #BANDHANBNK : BREAKEVEN
Price was going down but giving Buying wicks. Long was triggered after it finally gave strong Bullish Engulfing candle.
However, again there was no follow through and Exit was done after a strong Bearish candle
Price was going down but giving Buying wicks. Long was triggered after it finally gave strong Bullish Engulfing candle.
However, again there was no follow through and Exit was done after a strong Bearish candle

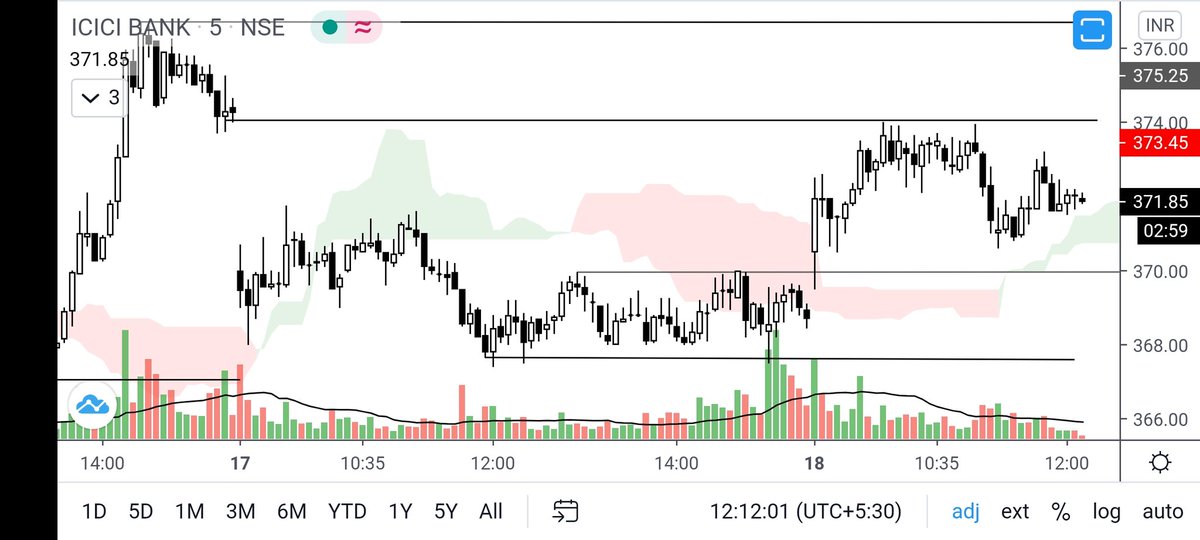
4/4 : #CIPLA : PROFIT : +2.2R
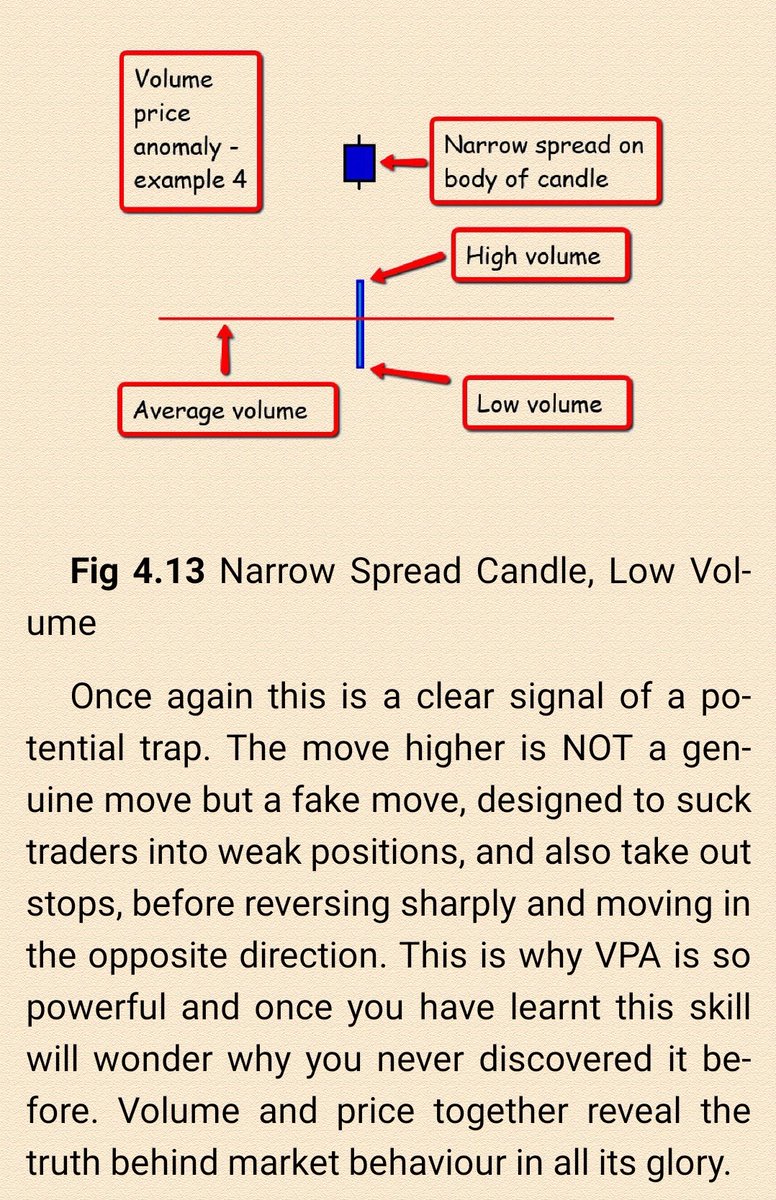
Using a screenshot from Volume Price Analysis by Anna Coulling to explain this, Price was going up with good Volume but the range of candles were small, signalling abnormality. A strong bearish candle triggered short trade

Using a screenshot from Volume Price Analysis by Anna Coulling to explain this, Price was going up with good Volume but the range of candles were small, signalling abnormality. A strong bearish candle triggered short trade


• • •
Missing some Tweet in this thread? You can try to
force a refresh


