1/9 Bitcoin has performed remarkably these past few weeks despite:
-Most of DeFi falling 50-80%
-CFTC charging BitMEX
-POTUS contracting Covid
-Delayed stimulus talks
-FCA announcing a derivative ban for retail
Why? Let’s see what we can find on-chain
-Most of DeFi falling 50-80%
-CFTC charging BitMEX
-POTUS contracting Covid
-Delayed stimulus talks
-FCA announcing a derivative ban for retail
Why? Let’s see what we can find on-chain
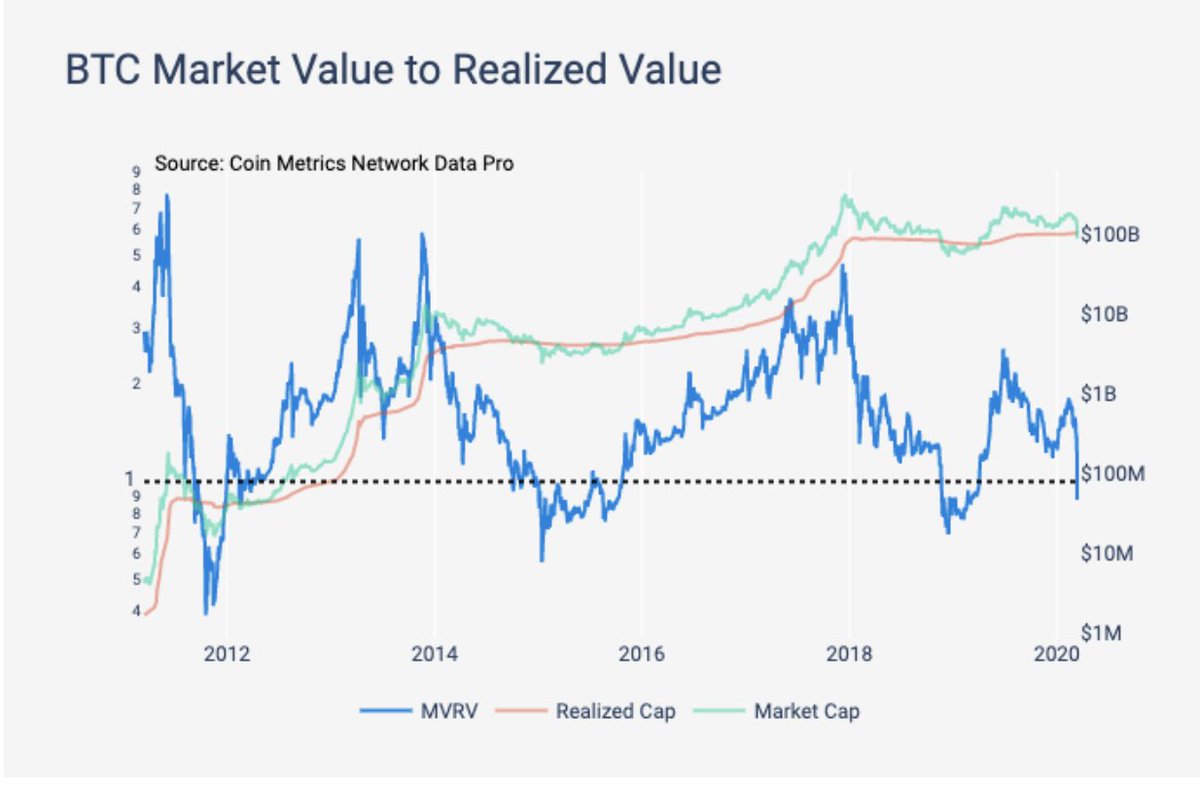
2/9 Bitcoin’s Realized Cap has been steadily increasing just as it did before the 2017 bull market took off. If it continues as it did in 2017, 2021 should be an interesting year.
network-charts.coinmetrics.io/#399
network-charts.coinmetrics.io/#399

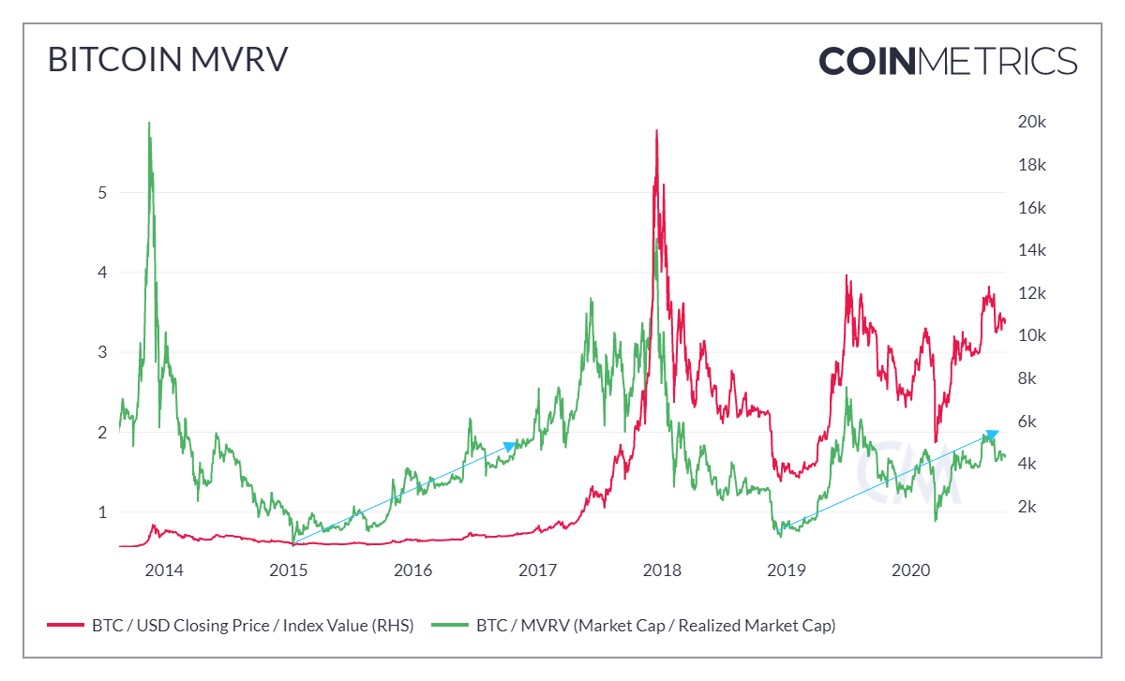
3/9 Bitcoin MVRV, whilst more volatile this market cycle, is also is holding the same trajectory it did during the 2016/17 bull market
network-charts.coinmetrics.io/#400
network-charts.coinmetrics.io/#400
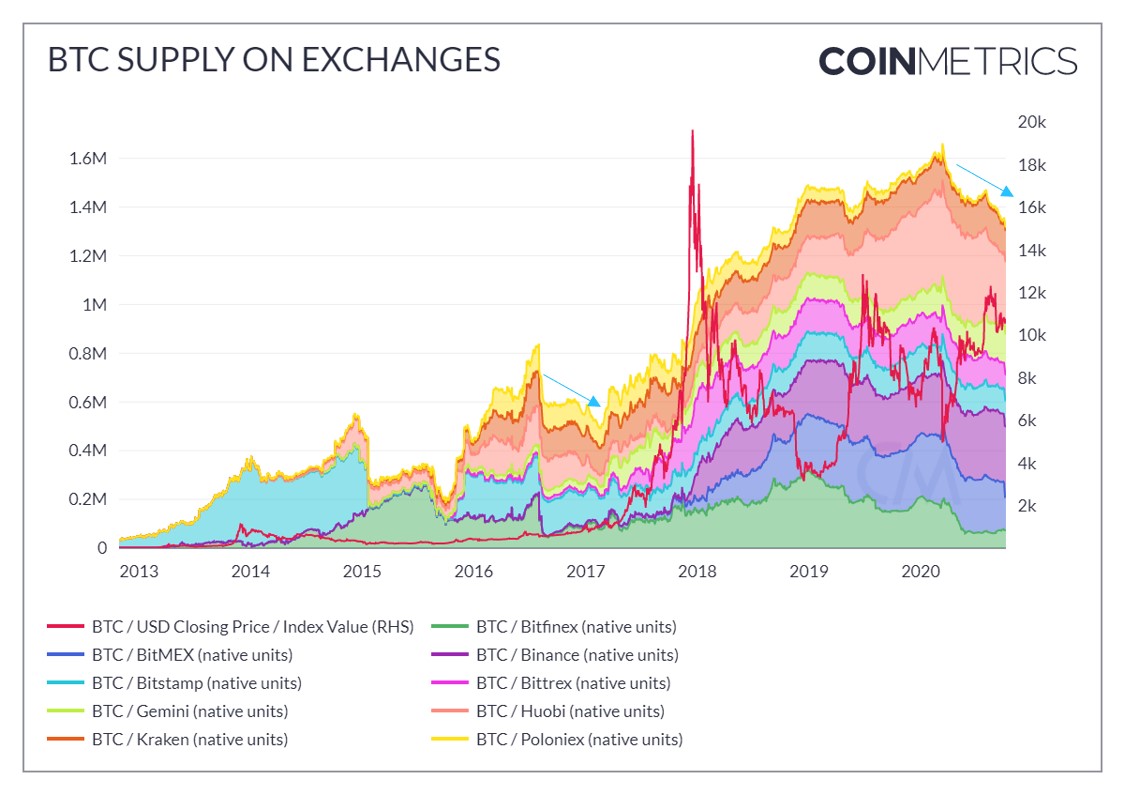
4/9 Looking at the supply of Bitcoin on exchanges is a good indication as to whether or not users are increasing trading activity, or increasing hodl activity. With supply reducing it looks like the tendency recently has been driven by hodlers
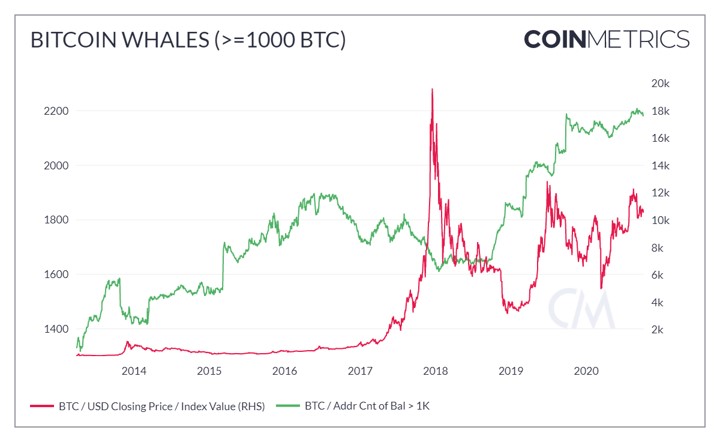
5/9 Despite the recent volatility, the number of Bitcoin whales continues to increase, indicating the growing number of large holders that have positive expectations for the future of Bitcoin
6/9 There have only been 6.8m BTC, or 36.7% of total supply, that have been active in the last year. Whilst the total supply of Bitcoin continues to grow, the free float and active supply indicate that scarcity might be higher than some may expect

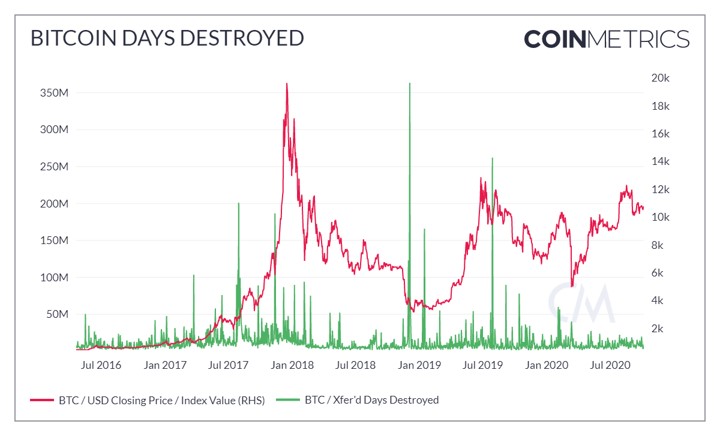
7/9 Most of the post March activity in Bitcoin has not been led or followed by increases in Days Destroyed (the re-activation of long term held Bitcoin), further supporting the idea that long term holders are expecting the medium term price action to be positive
8/9 Bitcoin Transfer count continues to grow steadily, indicating the user base/usage of the network is increasing in a healthy fashion

9/9 All this to say we like what we are seeing on-chain from a fundamental growth perspective! (and think @Square and @michael_saylor might too 😉)
• • •
Missing some Tweet in this thread? You can try to
force a refresh