This is my study of Bitcoin's market cap gain per dollar of net capital captured. It's presently sitting at $3.30 of price gain per dollar invested.

Some interesting findings below...

πŸ‘‡ Image
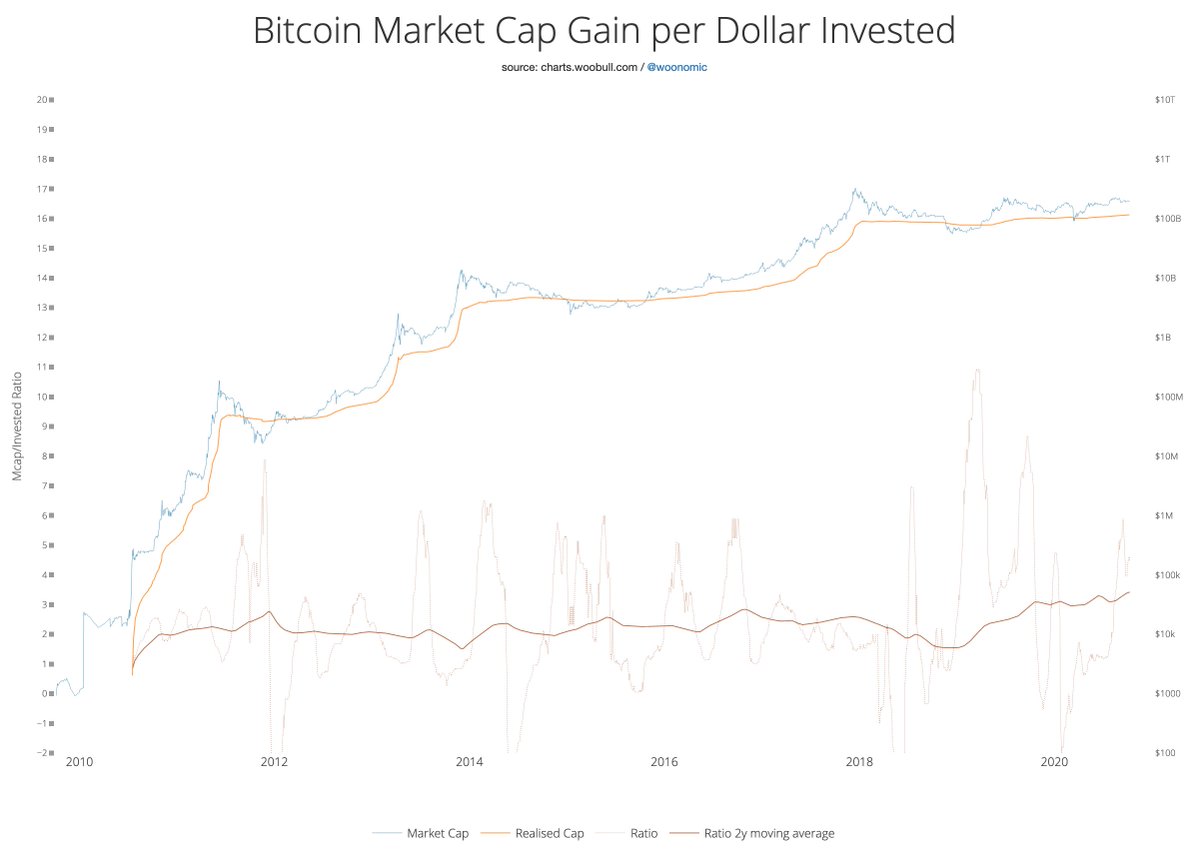
Reflectivity is increasing over each macro cycle! This is the tendency of HODLers to hold onto their coins harder as price increases. Image
I had expected reflexivity to increase during the mania phase of BULL markets, but it looks quite constant from the last two cycles.

This tells us that mania phases are driven by equally significant capital instead side effects of supply drying up. Image
This cycle in interesting; reflexivity is increasing rather than static compared to last cycles.

While we now need more capital invested to get similar % gains in price, the effect of HODLers holding onto coins tighter is magnifying "number go up" per dollar invested. Image
Methodology for this study here described here.

β€’ β€’ β€’

Missing some Tweet in this thread? You can try to force a refresh
γ€€

Keep Current with Willy Woo

Willy Woo Profile picture

Stay in touch and get notified when new unrolls are available from this author!

Read all threads

This Thread may be Removed Anytime!

PDF

Twitter may remove this content at anytime! Save it as PDF for later use!

Try unrolling a thread yourself!

how to unroll video
  1. Follow @ThreadReaderApp to mention us!

  2. From a Twitter thread mention us with a keyword "unroll"
@threadreaderapp unroll

Practice here first or read more on our help page!

More from @woonomic

31 Mar
A time-lapse map of the price when coins last moved.

Clusters of strong price discovery:
$55k (7% of supply last moved above this)
$47k (15%)

$46.4k is the price I'm modelling that we won't visit again during in this bull market (daily close).
Shear cliffs are areas where coin supply moves steeply upwards in price discovery. (green)

Flows downwards are bear market movements where coins move downwards to lower prices, investors accepting losses (red).
Horizontal bands are dense areas of where coins last moved, hence strong price discovery, acting as support and resistance.
Read 5 tweets
29 Mar
Let report these top fake accounts before more people get scammed πŸ™πŸ™Œ:

@Woonomiic1 (5456)
@Woonomicz (5427)
@woonomic5 (3157)
@Woonoom_ic (2793)
@woonnommic (1199)
@woonom1c (1002)
You're a defender of the scam-trodden by working through these πŸ‘πŸ‘:
@_woonomlc (411)
@woonomiiic (340)
@woonimic (234)
@woonomci (219)
@wo0nomic (195)
@woonemic (118)
Willy Woo dedication prize goes to you reporting this bunch πŸ˜‡πŸ˜‡:

@woonommiic (76)
@woonomiics (54)
@wconomic (27)
@WilliWoonomic (13)
@wonomiic (12)
@woonomic1 (8)
@voonomic11 (6)
@woonomic52 (5)
@woonomjc (4)
@voonomic93 (2)
@woonomic40 (2)
@voonomic20 (2)
Read 5 tweets
26 Mar
According to CT, NZ Pension fund deployed 5% into BTC back in Oct 2020 (2 months after MicroStrategy).

Sep 2020 it was $1.75b NZD AUM. That's roughly a $60m USD buy of BTC.

cointelegraph.com/news/new-zeala…
BTC would represent 20%+ of the fund in March 2021. I imagine they would have rebalanced since then, selling down some of their GBTC the last few weeks, given it's a diversified fund.
This is probably the original article from Stuff. It cites $350m AUM, some mismatch from my own search finding $1.75b AUM Sep 2020.

stuff.co.nz/business/12463…
Read 4 tweets
25 Mar
Hmmmm..... Rick Astley spotted buying the dip, rabidly.
Zooming in from weekly to daily... oh yes. Today we have a new all-time-high in BTC leaving the exchanges for 2021. And a new dip buying prize to award.
It's also a new Rick Astley high score.

Remember, the red bars is the daily count of coins moving to Rick Astley, the HODLer of last resort, who never gives up or deserts BTC.
Read 4 tweets
23 Mar
The 2015 -> 2017 bull market
"Making a name"

Density map of the coin supply at the price they last moved. #Bitcoin
The 2012 -> 2013 bull market
"Mt Gox and Silkroad"
The 2019 -> 2021 bull market
"The Herd"
Read 4 tweets
19 Mar
A tale of 3 charts...

From March 2020, #Bitcoin undergoes steep and continued supply shock in sync to USD money printing.

1) Speculative inventory on exchanges deplete.
2) Supply held by speculative "weak hands" deplete.

These are the coins held by wallet users that have a history of selling coins.

This is conservative as BTC held by "strong hands" using exchanges as custody will be classified as "highly liquid" / "weak hands" in this chart.
3) USD money printing took a steep inflationary jump starting March 2020.
Read 6 tweets

Did Thread Reader help you today?

Support us! We are indie developers!


This site is made by just two indie developers on a laptop doing marketing, support and development! Read more about the story.

Become a Premium Member ($3/month or $30/year) and get exclusive features!

Become Premium

Too expensive? Make a small donation by buying us coffee ($5) or help with server cost ($10)

Donate via Paypal Become our Patreon

Thank you for your support!

Follow Us on Twitter!