10/12 Texas Border Update - THREAD

* Counties that border Mexico, 9% of the population, accounted for almost 27% of TX fatalities between Jun & now
* 7 of Top 23 counties in fatalities are border counties (Orange)
* 5 of Top 12
* Border Deaths per million - crazy high

1/n
Here is the breakdown for all the Texas Border counties. At the bottom you'll notice that the Border accounts for 9.01% of Texas' population. Yet for the entire pandemic, the border accounts for 23.41% of the fatalities. This is up half a point from my last report in Sept

2/n
For the Entire Pandemic, you can see on this chart that fatalities on the border were running right at population through mid June. July saw a surge that raised the proportion to 24% by the end of August, and has remained there, decreasing slightly in recent weeks

3/n
If you narrow the timeframe to start at the beginning of June, border peaked at 26.5% of all Texas fatalities reported around the end of August. Nearly 3X their population. Has settled at 25.5% in that timeframe.

4/n
5/n

Mexican nationals are allowed to cross the border for medical care, even with the border being closed. Read through the links below for supporting information

5/n

6/n

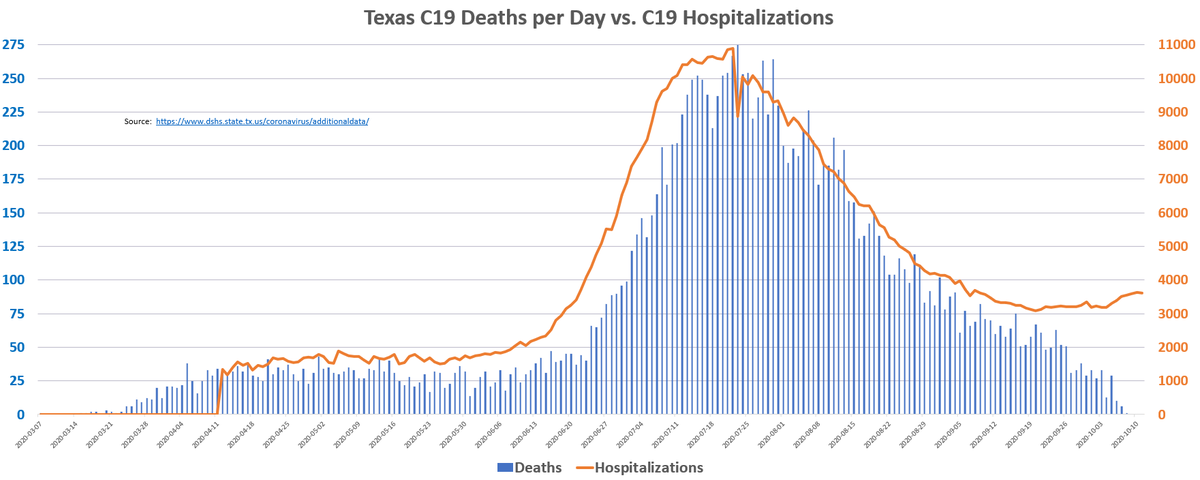
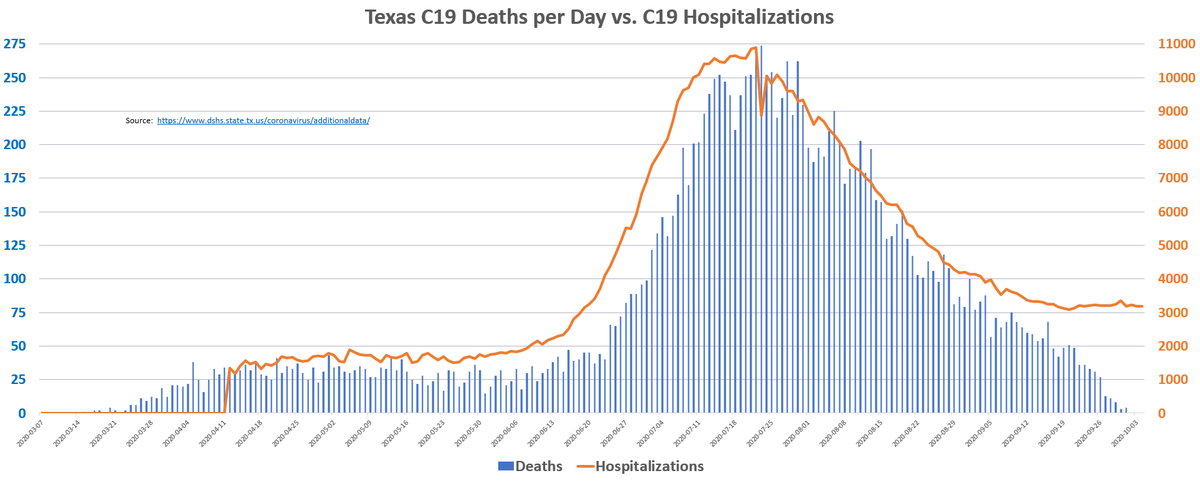
Mexico and Texas's hospitalization curves were mirrors of each other.

6/n

7/end

* Border Deaths per Million - 1450
* All other Texas Deaths per Million - 470
* Border raises Deaths per Million for the state by 19% to 558
* You can basically ballpark 19% of all Texas deaths were Mexican nationals, Ex-pats, migrants, and border transportation corridor

• • •

Missing some Tweet in this thread? You can try to force a refresh
 

Keep Current with Alex Rodriguez

Alex Rodriguez Profile picture

Stay in touch and get notified when new unrolls are available from this author!

Read all threads

This Thread may be Removed Anytime!

PDF

Twitter may remove this content at anytime! Save it as PDF for later use!

Try unrolling a thread yourself!

how to unroll video
  1. Follow @ThreadReaderApp to mention us!

  2. From a Twitter thread mention us with a keyword "unroll"
@threadreaderapp unroll

Practice here first or read more on our help page!

More from @therealarod1984

14 Oct
Scott Atlas: Prolonged lockdowns a Complete Disaster

* Working class & low income people destroyed
* 46% of cancers not diagnosed
* 50% chemo appts missed
* 50% missed immunizations
* 200K missed cases of abuse
* 25% of young people considering suicide

a.msn.com/05/en-us/BB19Z…
Found a better link
Read 4 tweets
12 Oct
10/11 TX C-19 Hospital Census: Capacity

* Census - 3622 - up 430 beds Week over Week (WoW)
* % Beds used by C19 - 5.56%
* ICU C19 - 1142, up 71 beds WoW
* Hospital bed capacity - record 65,151
* C19 % beds used (orange) diverging from C19 census (blue)

1/n

#RationalGround Image
TX Hospital Bed Capacity - Up Bigly

* 10/11 Bed Capacity - 65,151 (Image 1)
* Highest since June 5
* Up 7,084 beds from last week
* Meanwhile free beds are down 41 WoW (Image 2), meaning 7K more patients than last week.
* Delayed Care / Elective surgery increasing rapidly

2/n ImageImage
10/11 ICU vs General Bed Census

ICU still basically flat with a small rise the past 3 days. Meanwhile General census is up over 300 in the past 8 days alone.

With more electives and delayed care being admitted, all being PCR tested = rise in census numbers.

3/n Image
Read 6 tweets
12 Oct
TX Fatalities by Date of Death vs Hospitalizations- 10/11

* Fatalities peak on 7/23
* Hospital census has bumped up right along with an increase in Hospital capacity
* 532 Fatalities reported the past 7 days, a rise of 5.7% over last week's 502

THREAD 1/n Image
I broke down the Hospital situation on Saturday morning and will be updating again today. Below. Hospitals appear to be returning to a more "normal" state. Bed inventory has risen quickly. Delayed care/ elective surgery patients on the increase.

2/n

10/11 - DOD report for the past 7 days

* 532 Fatalities reported, up from 503 last week
* 81 Dates revised
* 130 from Sept 15 and older
* 50 August fatalities
* 21 July fatalities

Better but still quite a bit of Death Cert matching going back 2 and 3 months.

3/n ImageImage
Read 4 tweets
5 Oct
Back to Texas this afternoon, if you missed @EthicalSkeptic great analysis of Texas last night, I've included it below. Nice to see my assertions confirmed by the great TES! In this thread I'll do my usual breakdown of Hospitalizations vs fatalities, both DoD and DoR.

1/n
TX Fatalities by Date of Death vs Hospitalizations- 10/4

* Fatalities peak on 7/23
* Hospital census false floor of ~3200 beds ~5% of capacity
* TES highlighted LTC as partial reason for this
* Otherwise my assertions linked below were TES confirmed

2/n

3/n

10/4 - DoD Report

* 202 Fatalities reported the past 3 days
* Down 20.8% from the same 3 day period LW (255)
* 56 Dates Revised past 3 days
* 38 > 4 weeks old
* 25 > 6 weeks old
* 13 > 8 weeks old
* Not as good as 10/1, but still less DC laundering than we saw in Sept
Read 4 tweets
3 Oct
.
*** There is Nothing New Under the Sun ***

Viewing the 2020 Covid-19 Pandemic through the lens of “American Pandemic, The Lost Worlds of the 1918 Influenza Epidemic” by Nancy K Bristow

“What has been will be again, what has been done will be done again" Ecc 1:9

THREAD 1/n
2/n

“American Pandemic” is a history of those that lived & died in the Pandemic, w/ heavy focus on the rise of public health establishments

While there are differences between the 2 pandemics, there are striking similarities - hotbuttons like Masks, Lockdowns, Schools, etc

2/n
.
** We will start with Two Striking Differences **

* Striking Difference 1 - Fatalities (click image below)

(I will release 1-2 new tweets per day, with hopes to eventually turn this into a longform article. This may end up being about a 10-12 Tweet thread)

3/n Image
Read 10 tweets
30 Sep
9/29 Texas C-19 Hospital Census: False Floor

* Census - 3251 - up 44 beds Week over Week (WoW)
* Census Down 70.2% since 7/22 Peak
* % Beds used by C19 - 5.86%
* ICU C19 - 1044, down 22 WoW
* Hospital commentary, leading Indicators analysis next

#RationalGround

1/n Image
2/n

Hospital Commentary:

* ICU continues to decline as % of total C19
* 9/29 - 32.11%
* 9/22 - 33.21%
* 9/15 - 34.76%

* False floor
** Delayed care patients - nosocomial
** PCR Ct functional false positives
** Cares Act $ putting pressure to code as C19
3/n - Case & Pos% Commentary

* Test Positivity Rate is at lowest point since MAY 26.
* 2nd chart - New reported cases have declined substantially the last 5 days.
* 7D average of new cases is 2872, lowest since June 19 ImageImage
Read 6 tweets

Did Thread Reader help you today?

Support us! We are indie developers!


This site is made by just two indie developers on a laptop doing marketing, support and development! Read more about the story.

Become a Premium Member ($3/month or $30/year) and get exclusive features!

Become Premium

Too expensive? Make a small donation by buying us coffee ($5) or help with server cost ($10)

Donate via Paypal Become our Patreon

Thank you for your support!

Follow Us on Twitter!