Scott Atlas: Prolonged lockdowns a Complete Disaster
* Working class & low income people destroyed
* 46% of cancers not diagnosed
* 50% chemo appts missed
* 50% missed immunizations
* 200K missed cases of abuse
* 25% of young people considering suicide
* Counties that border Mexico, 9% of the population, accounted for almost 27% of TX fatalities between Jun & now
* 7 of Top 23 counties in fatalities are border counties (Orange)
* 5 of Top 12
* Border Deaths per million - crazy high
1/n
Here is the breakdown for all the Texas Border counties. At the bottom you'll notice that the Border accounts for 9.01% of Texas' population. Yet for the entire pandemic, the border accounts for 23.41% of the fatalities. This is up half a point from my last report in Sept
2/n
For the Entire Pandemic, you can see on this chart that fatalities on the border were running right at population through mid June. July saw a surge that raised the proportion to 24% by the end of August, and has remained there, decreasing slightly in recent weeks
* Census - 3622 - up 430 beds Week over Week (WoW)
* % Beds used by C19 - 5.56%
* ICU C19 - 1142, up 71 beds WoW
* Hospital bed capacity - record 65,151
* C19 % beds used (orange) diverging from C19 census (blue)
* 10/11 Bed Capacity - 65,151 (Image 1)
* Highest since June 5
* Up 7,084 beds from last week
* Meanwhile free beds are down 41 WoW (Image 2), meaning 7K more patients than last week.
* Delayed Care / Elective surgery increasing rapidly
2/n
10/11 ICU vs General Bed Census
ICU still basically flat with a small rise the past 3 days. Meanwhile General census is up over 300 in the past 8 days alone.
With more electives and delayed care being admitted, all being PCR tested = rise in census numbers.
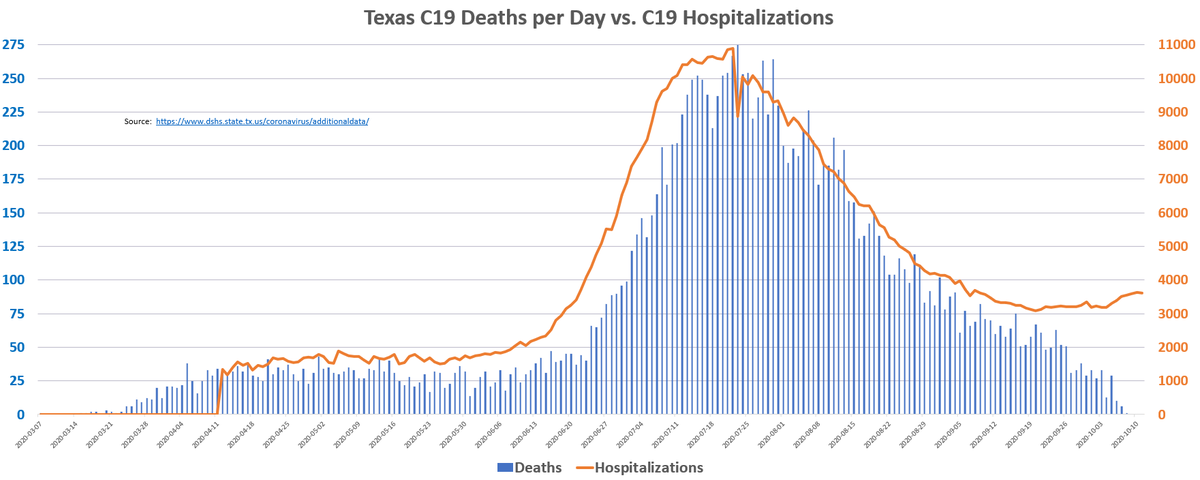
TX Fatalities by Date of Death vs Hospitalizations- 10/11
* Fatalities peak on 7/23
* Hospital census has bumped up right along with an increase in Hospital capacity
* 532 Fatalities reported the past 7 days, a rise of 5.7% over last week's 502
THREAD 1/n
I broke down the Hospital situation on Saturday morning and will be updating again today. Below. Hospitals appear to be returning to a more "normal" state. Bed inventory has risen quickly. Delayed care/ elective surgery patients on the increase.
Back to Texas this afternoon, if you missed @EthicalSkeptic great analysis of Texas last night, I've included it below. Nice to see my assertions confirmed by the great TES! In this thread I'll do my usual breakdown of Hospitalizations vs fatalities, both DoD and DoR.
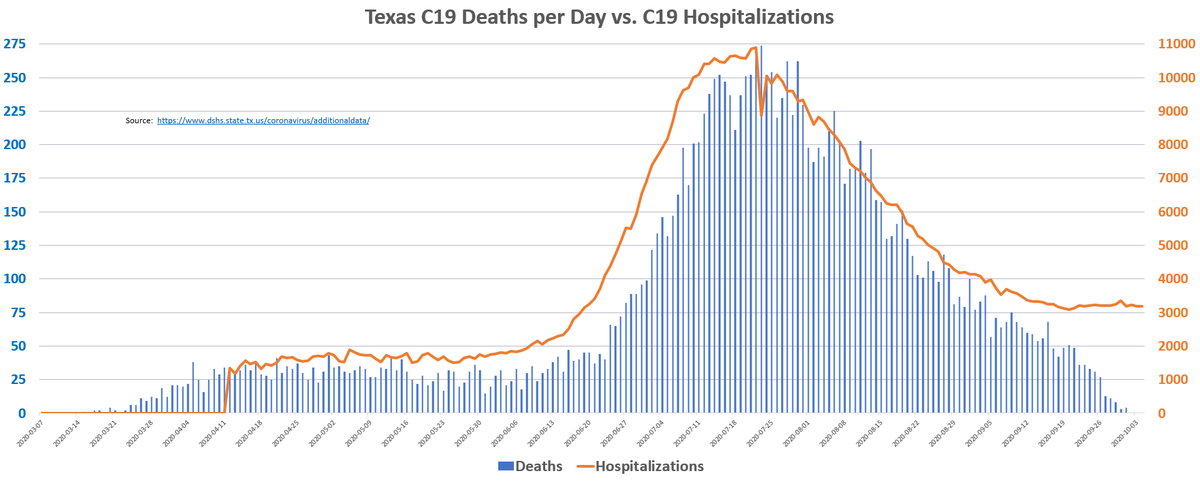
TX Fatalities by Date of Death vs Hospitalizations- 10/4
* Fatalities peak on 7/23
* Hospital census false floor of ~3200 beds ~5% of capacity
* TES highlighted LTC as partial reason for this
* Otherwise my assertions linked below were TES confirmed
* 202 Fatalities reported the past 3 days
* Down 20.8% from the same 3 day period LW (255)
* 56 Dates Revised past 3 days
* 38 > 4 weeks old
* 25 > 6 weeks old
* 13 > 8 weeks old
* Not as good as 10/1, but still less DC laundering than we saw in Sept
* Census - 3251 - up 44 beds Week over Week (WoW)
* Census Down 70.2% since 7/22 Peak
* % Beds used by C19 - 5.86%
* ICU C19 - 1044, down 22 WoW
* Hospital commentary, leading Indicators analysis next
* ICU continues to decline as % of total C19
* 9/29 - 32.11%
* 9/22 - 33.21%
* 9/15 - 34.76%
* False floor
** Delayed care patients - nosocomial
** PCR Ct functional false positives
** Cares Act $ putting pressure to code as C19
3/n - Case & Pos% Commentary
* Test Positivity Rate is at lowest point since MAY 26.
* 2nd chart - New reported cases have declined substantially the last 5 days.
* 7D average of new cases is 2872, lowest since June 19