
Analysis: #NASDAQ $PSTV
Case 502 #PlusTherapeutics Inc.
DISCLAIMER: The analysis is strictly for educational purposes and should not be construed as an invitation to trade.
#PSTV 1/3
Case 502 #PlusTherapeutics Inc.
DISCLAIMER: The analysis is strictly for educational purposes and should not be construed as an invitation to trade.
#PSTV 1/3

Chart 1
Weekly Chart: Price is currently resting on the Mar 2020 #trendline at 2.62 with the #SMA 50 at 2.17, farther down Mar 2020 #pivot at 1.43 with control at 0.87. Immediate #resistance at 3.46 (Aug 2020 trendline) with a weekly close above control at 5.62 quickly.
PSTV 2/3
Weekly Chart: Price is currently resting on the Mar 2020 #trendline at 2.62 with the #SMA 50 at 2.17, farther down Mar 2020 #pivot at 1.43 with control at 0.87. Immediate #resistance at 3.46 (Aug 2020 trendline) with a weekly close above control at 5.62 quickly.
PSTV 2/3
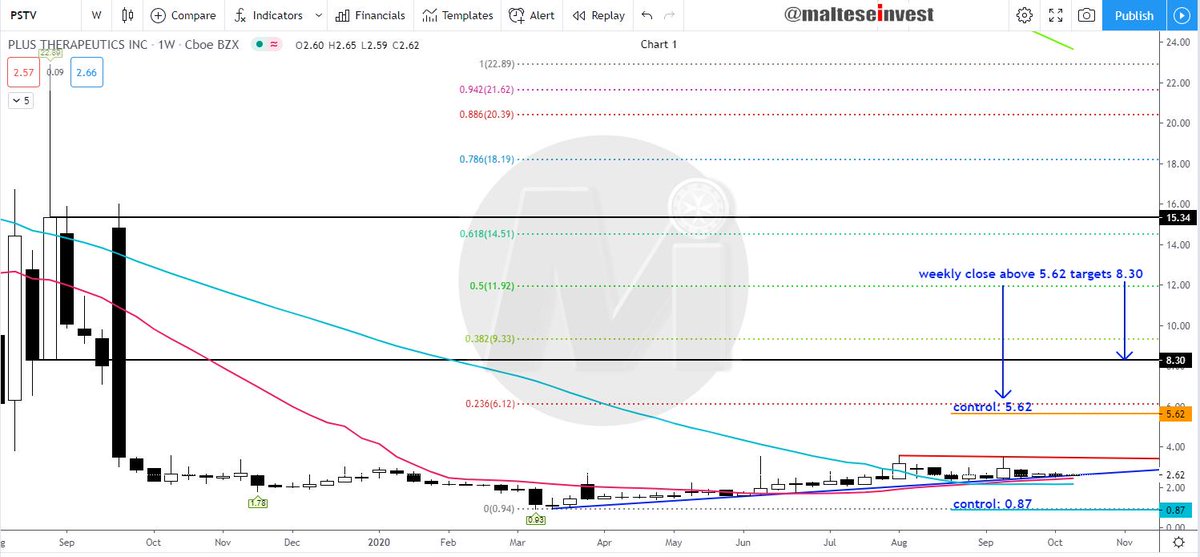
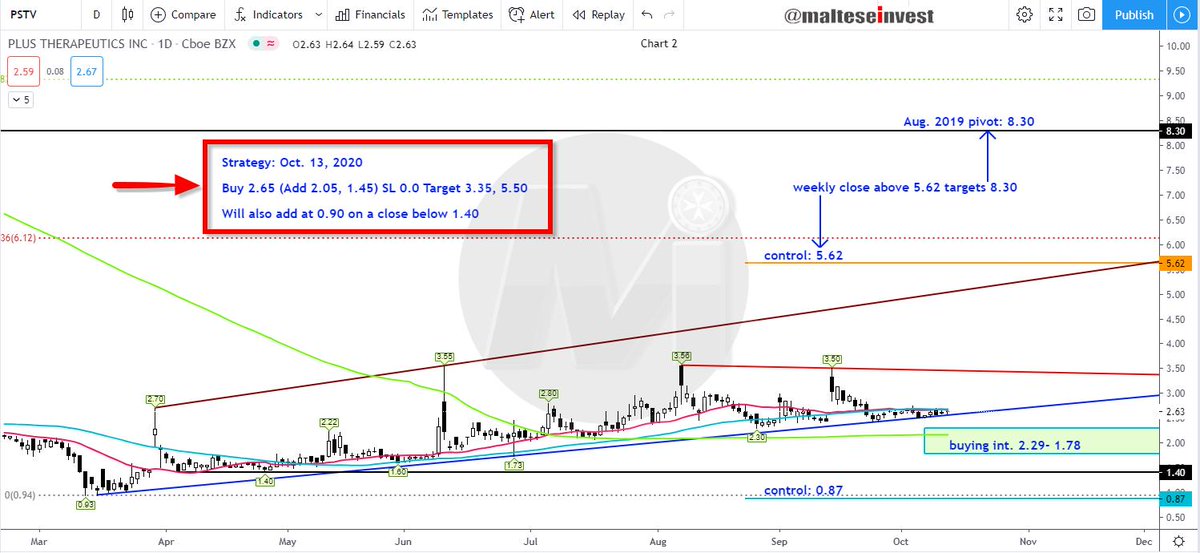
Chart 2
Daily Chart: Buying interest seen 2.29- 1.78 with the SMA 200 trading inside at 2.16.
The #Strategy is printed on the image.
$PSTV 3/3
Daily Chart: Buying interest seen 2.29- 1.78 with the SMA 200 trading inside at 2.16.
The #Strategy is printed on the image.
$PSTV 3/3
• • •
Missing some Tweet in this thread? You can try to
force a refresh


