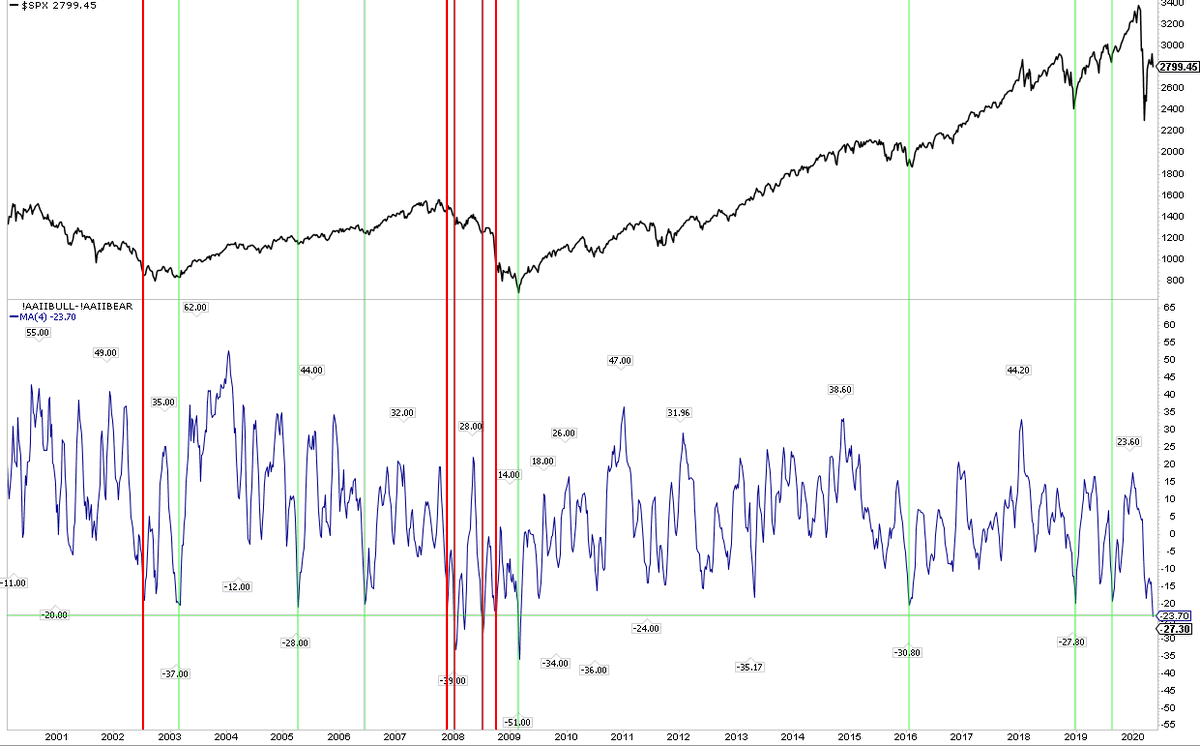
If something cannot go on forever, it will stop.
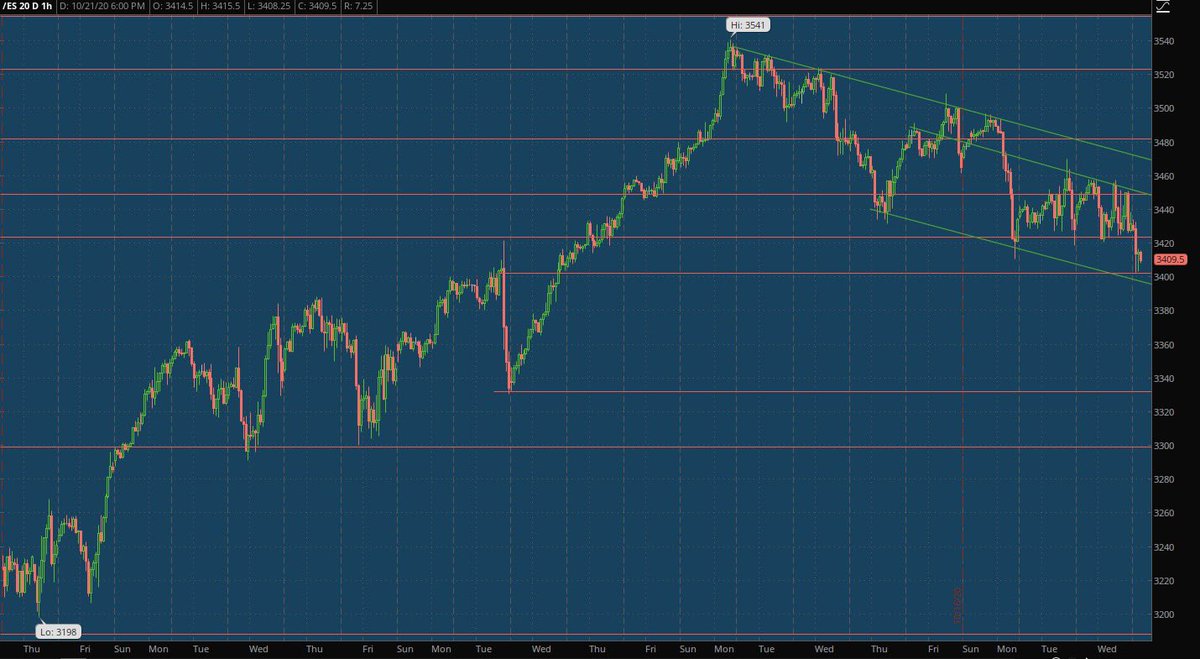
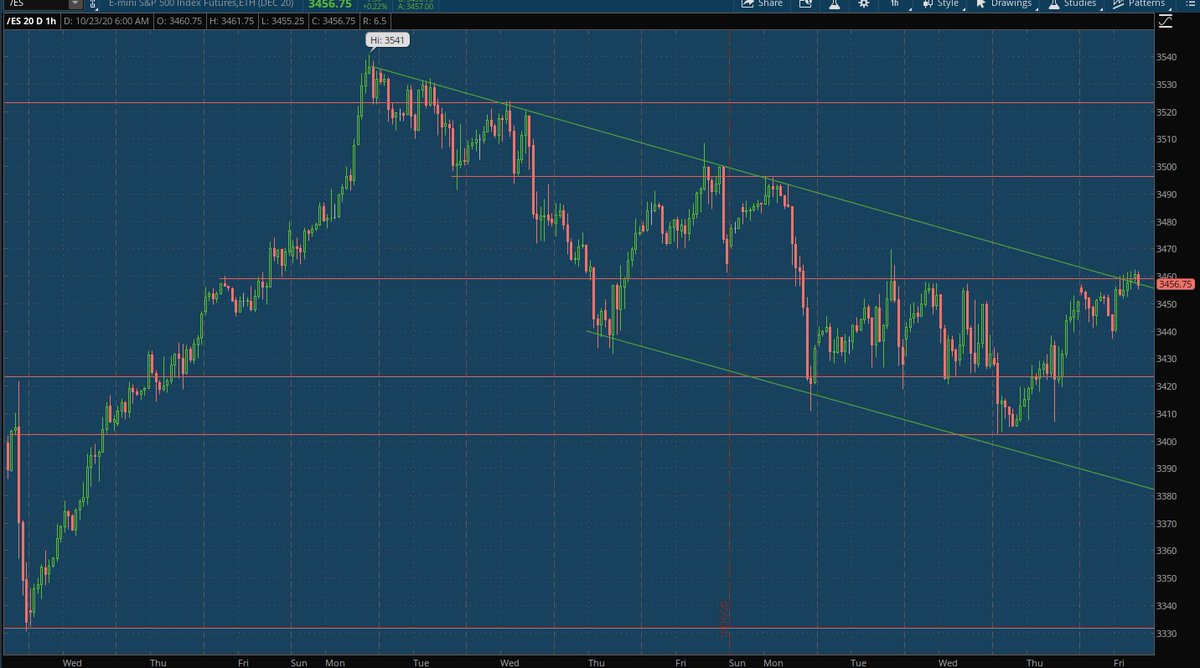
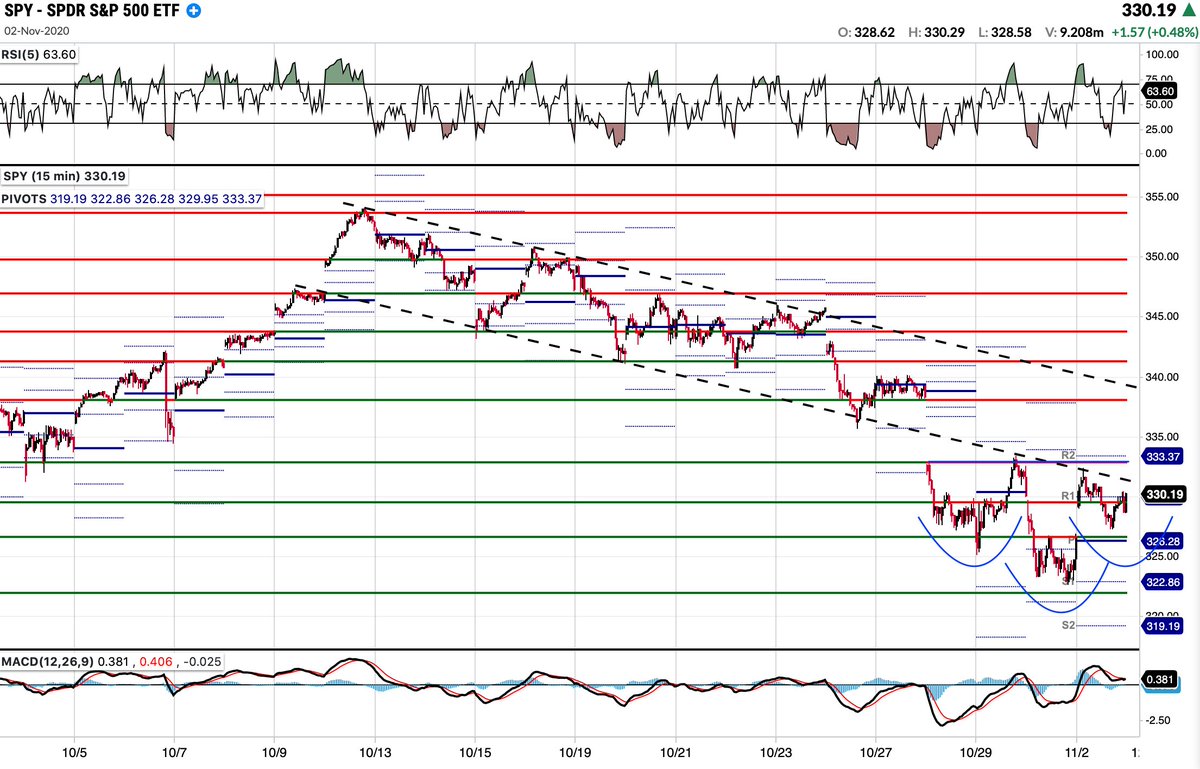
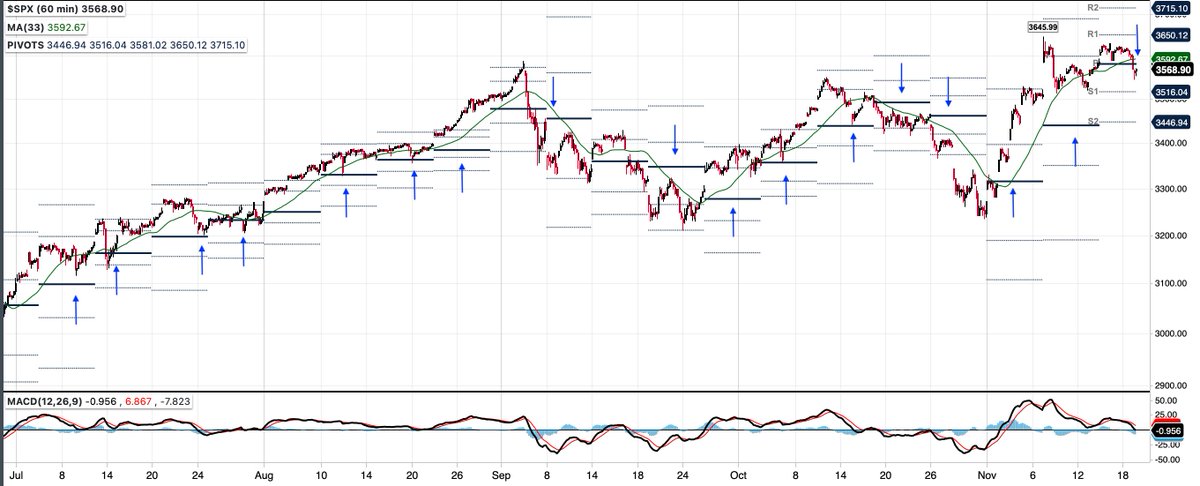
$ES_F is now back below that lonely red candle. 3420 is a bcktest of the 'breakout'
$ES_F is now back below that lonely red candle. 3420 is a bcktest of the 'breakout'
https://twitter.com/ukarlewitz/status/1315685521096495104
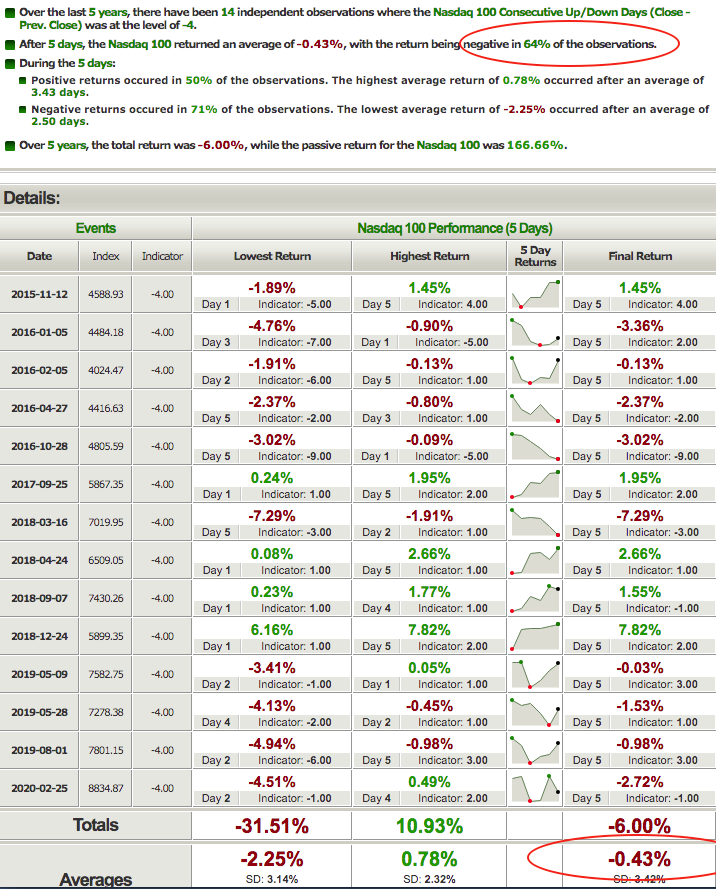
$NDX down 4 days in a row. Last 5 yrs, n=14. $NDX closed lower 5 days later 64% of the time and only half the cases closed higher within those next 5 days. Weak
indexindicators.com/backtest/nasda…
indexindicators.com/backtest/nasda…
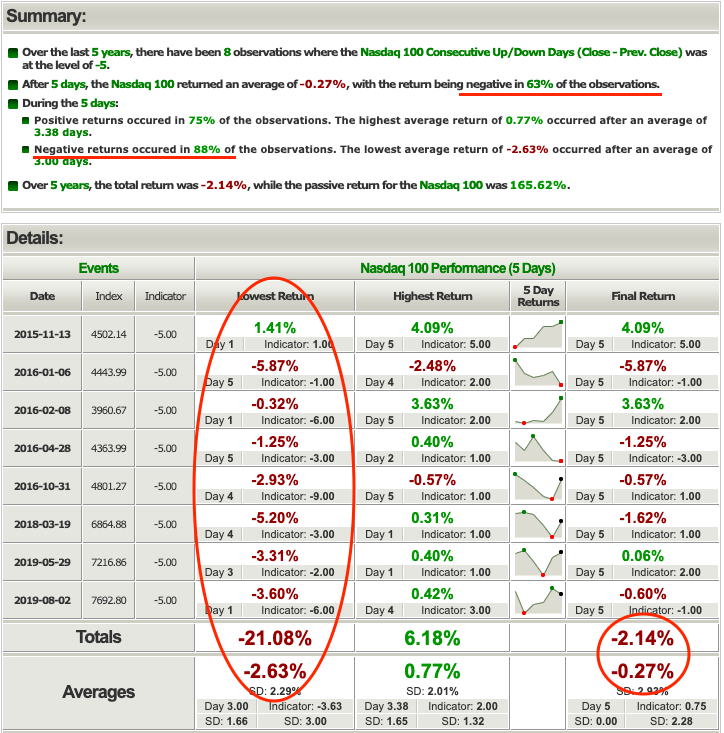
$NDX down 5 days in a row. Last 5 yrs, n=8 (small sample). $NDX closed lower 5 days later 63% of the time and had a lower close within those next 5 days in all but one instance (88%).
Scroll up - today not a big surprise
Scroll up - today not a big surprise
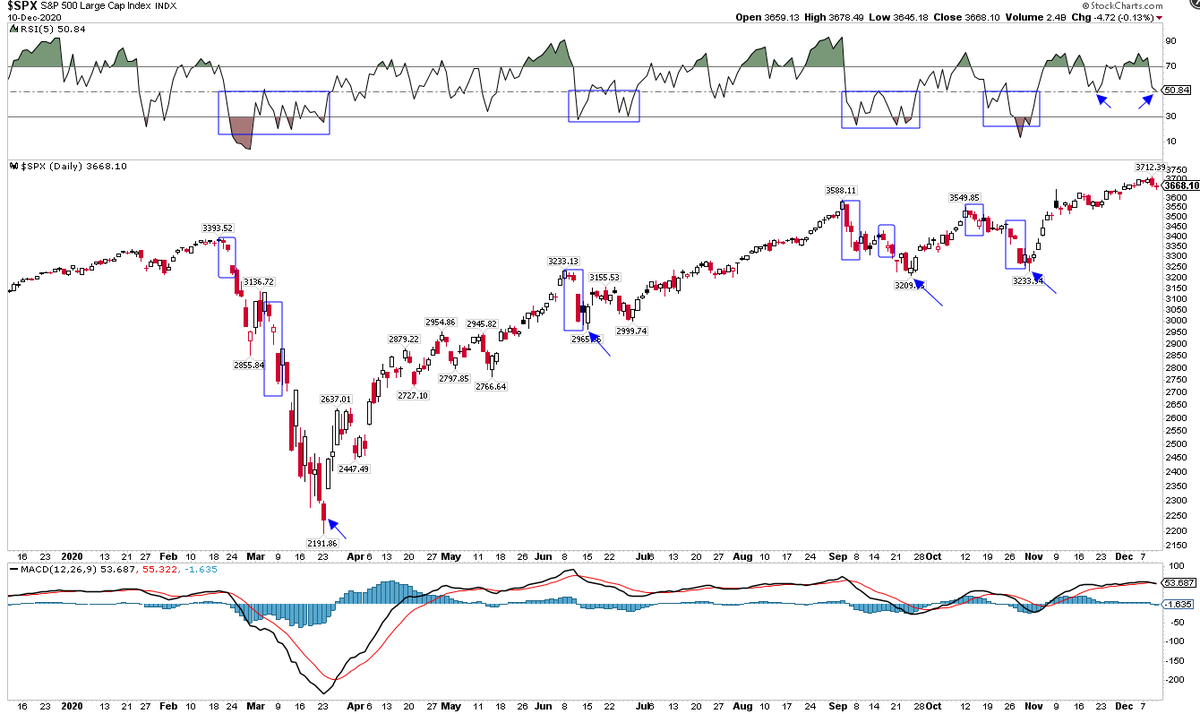
$SPX low of the day 3420 (backtest of the ‘breakout’)
https://twitter.com/ukarlewitz/status/1316729324477673478
Update (scroll up): $ES_F hit 3420 no less than 5 times in the last 3 days and finally broke to 3400 channel bottom. Any sustained weakness below there nulls the ‘breakout’. Key time
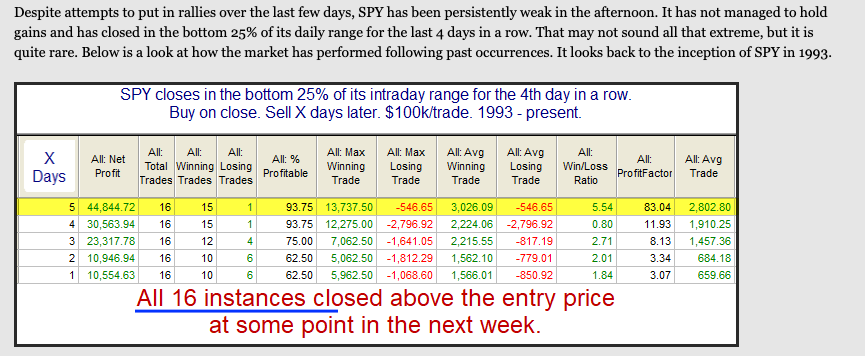
$SPX - persistent weak closes setting up a bounce: all higher w/in next 5 days and 94% higher on Day 5
https://twitter.com/QuantifiablEdgs/status/1319254448569569281
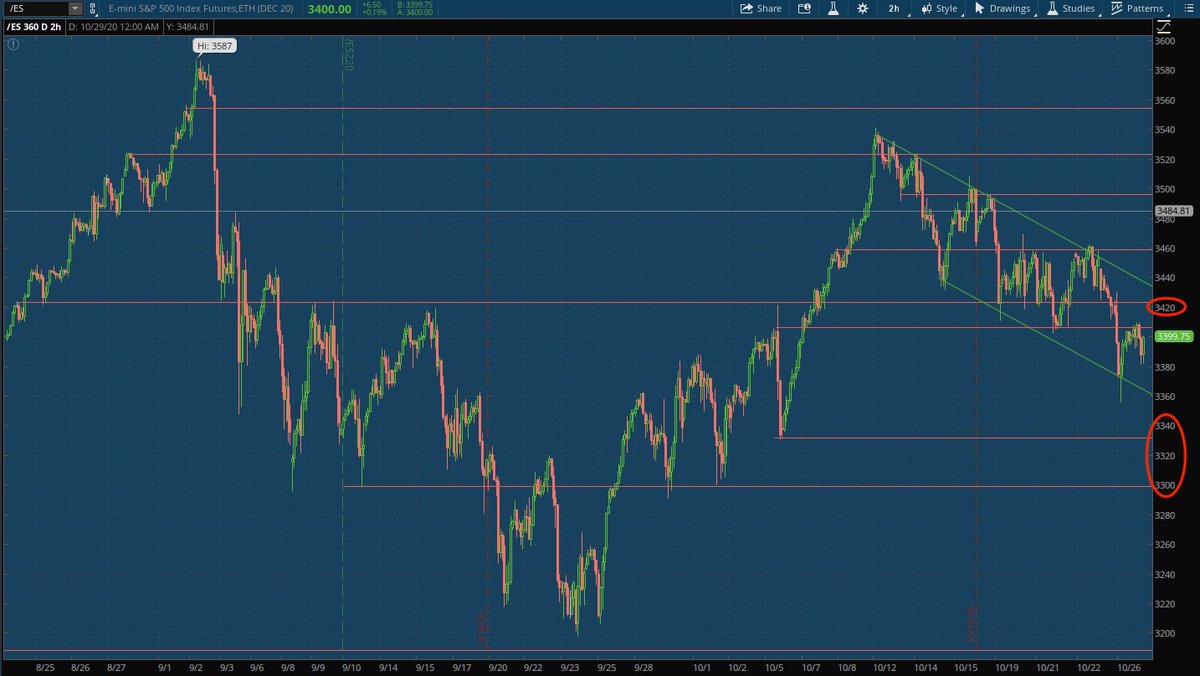
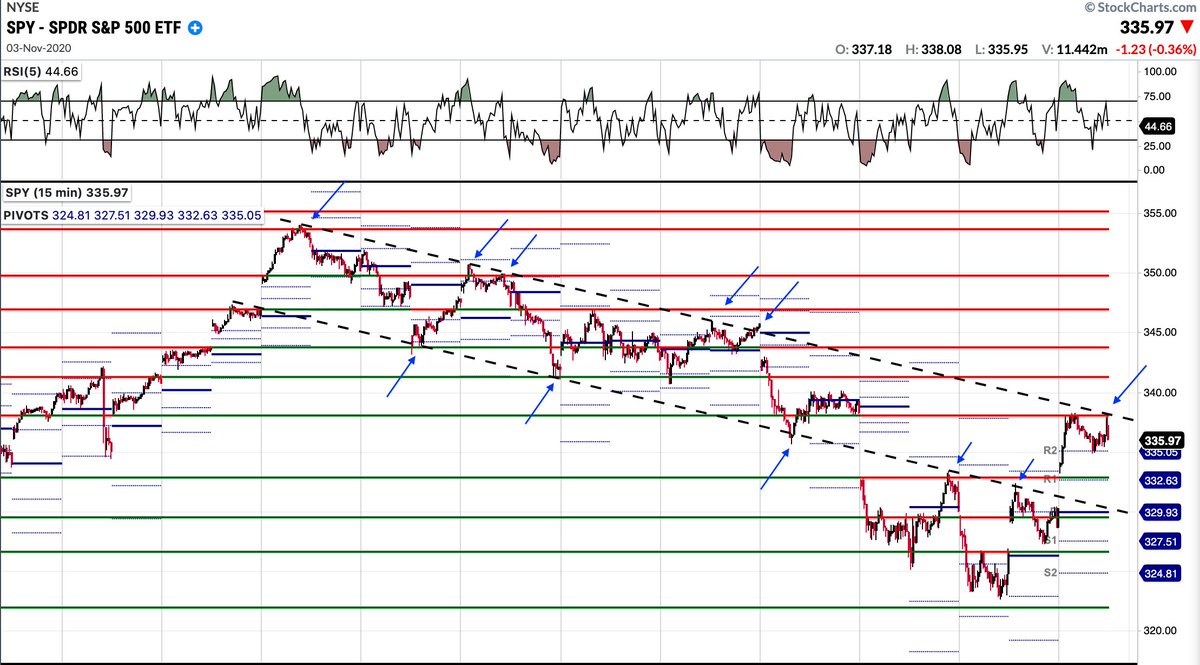
$ES_F 3400 channel bottom was the low (scroll up). Now +2% at 3460 channel top. Any higher goes to 3500, otherwise channel bound
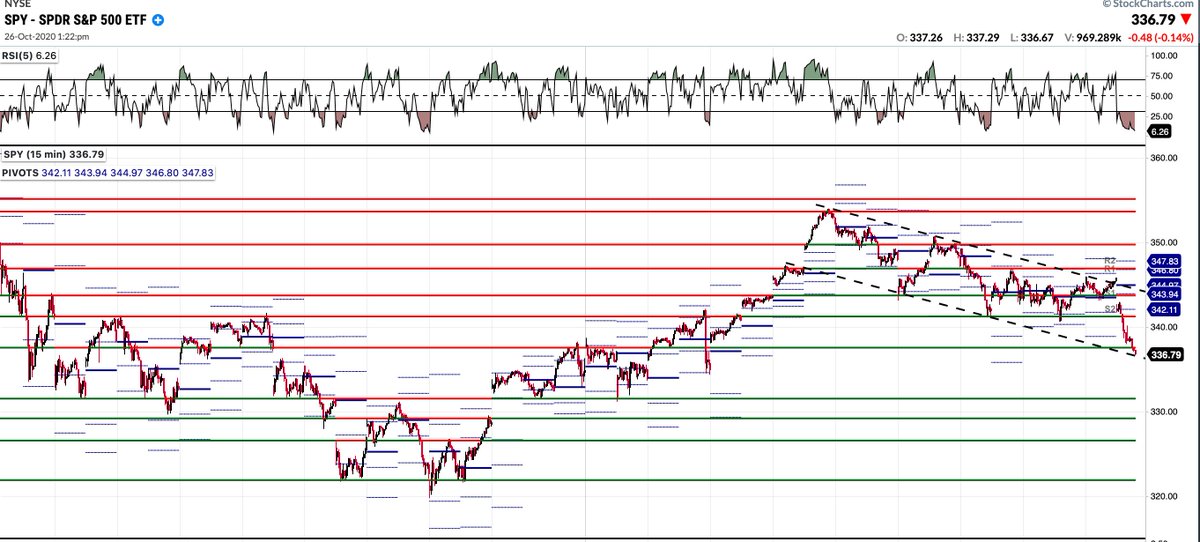
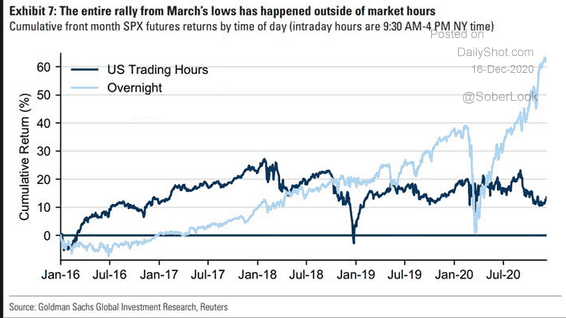
So far this week, $SPY up $4.5 overnight, down $5.9 during cash hrs
Channel top Friday (scroll up) and now channel bottom again $spx
Today is Day 5. $NDX down 1.6% from this post
https://twitter.com/ukarlewitz/status/1318286851627655169
$ES_F went boing on channel bottom (scroll up). It’s in a falling pattern until >3420 and top rail. Downside S at 3330 and 3300. Back in Sept hot mess is not a great place to be
-1730 tick at the open as everyone tries to squeeze out through one door
Just reached 3301. Key time. Much lower and it’s off to Sept lows at ~3200
https://twitter.com/ukarlewitz/status/1321122919175446528
$SPX - October on track to close down 3%. Looking at you, November-December
https://twitter.com/RyanDetrick/status/1311650216194510850
Likewise: ATH followed by a -5% DD has led to a minimum drawup (monthly close) of 3.3% in the next 3 months. Add that to the -3% this month. $spx
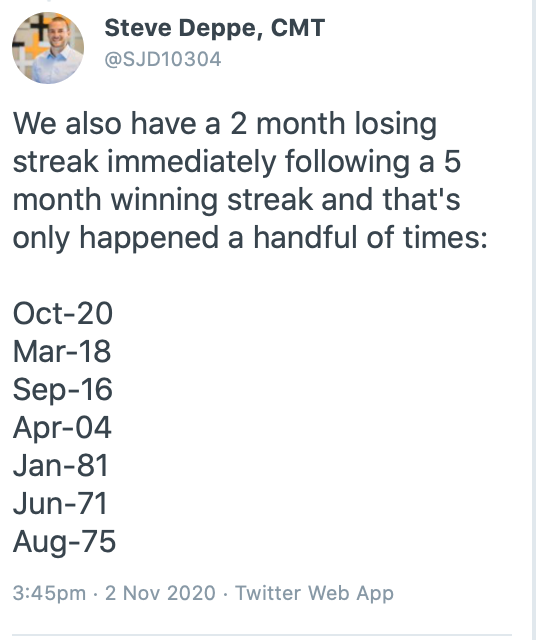
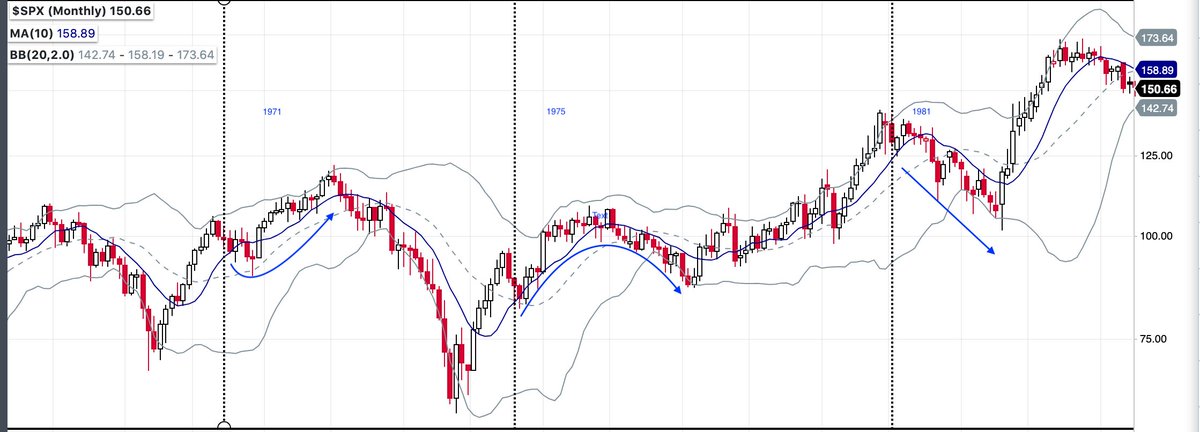
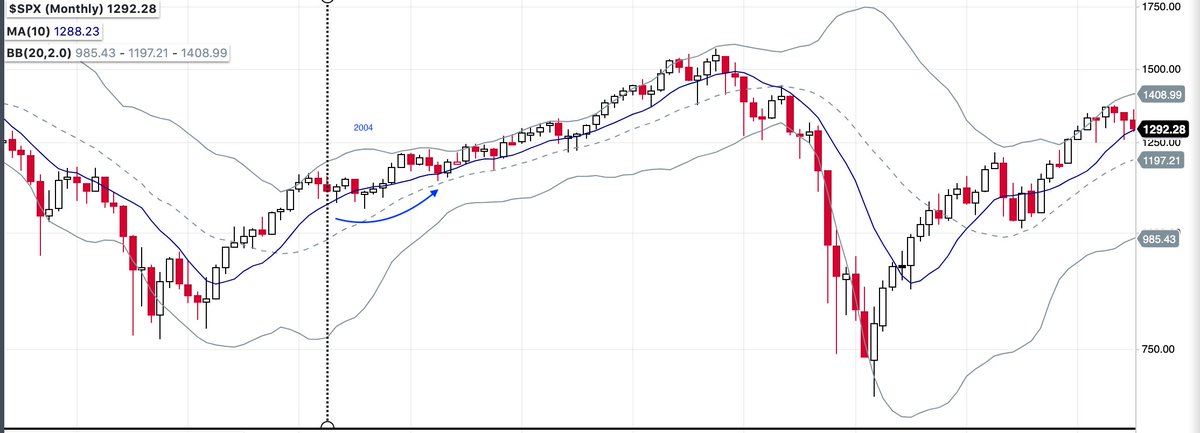
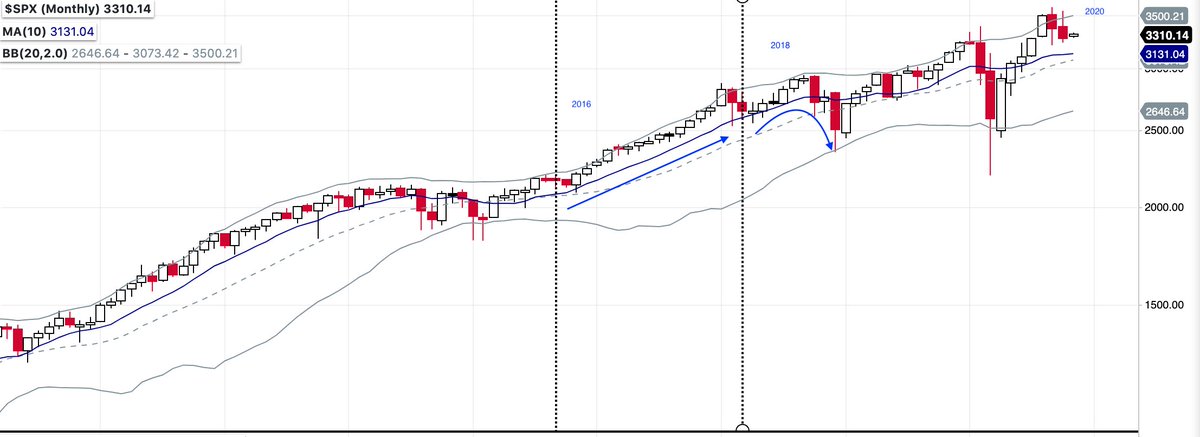
https://twitter.com/SJD10304/status/1311426478861545477
$SPX up 5 months in a row and then down 2 months in a row. Good luck
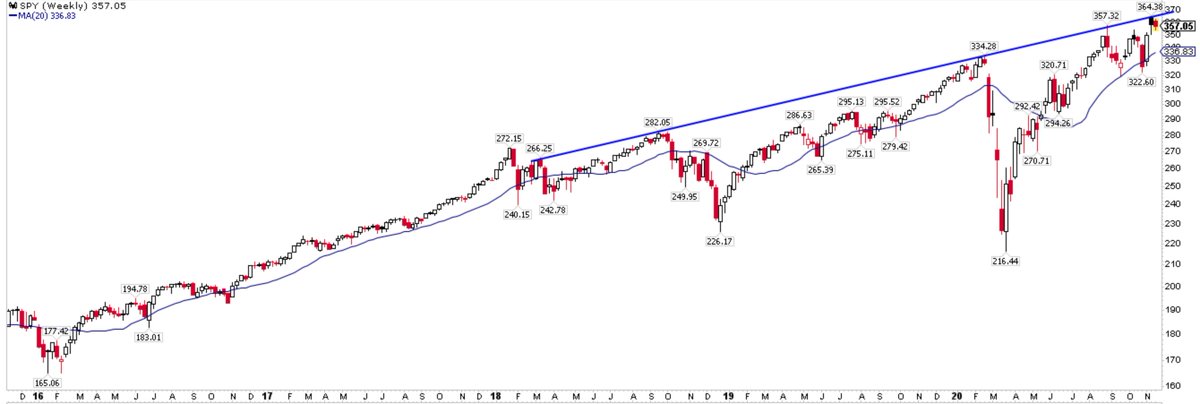
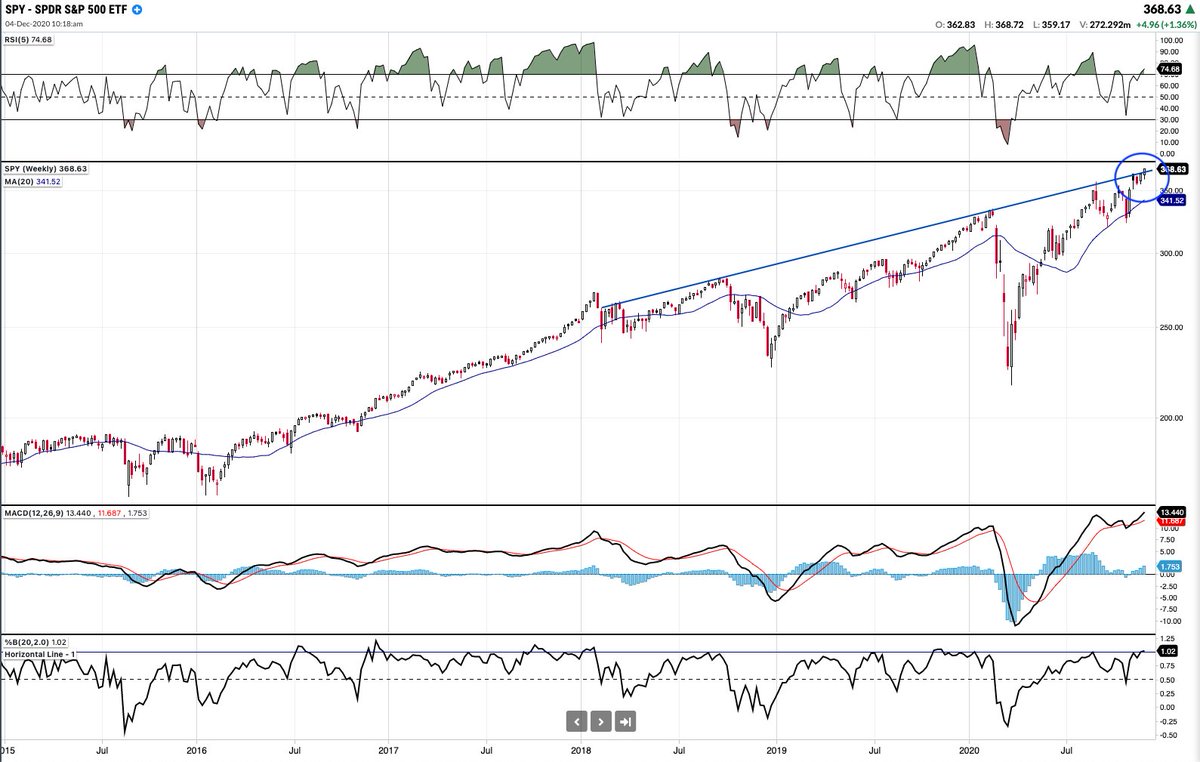
$SPY at 334 in pre-market, which would throw it back inside the former channel. Last Wednesday’s gap fill is 338 and WR1 is 339, along with the top of the channel (which is probably busted). And, there’s an inverted pattern that also targets 340-ish, w/ neckline at 333
Filled the gap at HOD and turned around at top of the channel. Channel rules until we gap out of it $spy
$SPY - Right now, would gap up $6 out of the top of the channel
https://twitter.com/ukarlewitz/status/1323734074607980545
$SPY has gapped up $17.8 this week. That’s 80% of the week’s 7% gain
Persistent buying tends to keep going
https://twitter.com/QuantifiablEdgs/status/1324720427353124871
$SPX on track to gain 7% this week. Aside from election week 2008, that has lead to more gains
Today, $SPY gapped up overnight 4% and then sold off nearly 3% on the highrst volume in 7 months. Other than that, not much going on
A higher close sometime in the next week $spx
https://twitter.com/MikeMcKerr_TDA/status/1326255489081110528
Consensus values $SPX today at 21.8x and sees 8% upside in the next yr
https://twitter.com/LizAnnSonders/status/1329017190725652482
To put that $165 in FY21 EPS in perspective, FY19 EPS was $163 yet $SPX now trading ~20% higher than in Oct 2018. Hence, PE expansion from ~18x to ~22x
Overall
A. Tailwinds
1. Trend - ATHs
2. Breadth - $NYSI +400
3. Seasonality - strongest 3 months
B. Headwinds
1. Sentiment - uniformly bullish
2. Valuation - 22x FY21
3. Volatility - still >20, where 'things happen’
C. Unclear
1. Macro: 1H21 downside risk; 2H21 likely expansion
A. Tailwinds
1. Trend - ATHs
2. Breadth - $NYSI +400
3. Seasonality - strongest 3 months
B. Headwinds
1. Sentiment - uniformly bullish
2. Valuation - 22x FY21
3. Volatility - still >20, where 'things happen’
C. Unclear
1. Macro: 1H21 downside risk; 2H21 likely expansion
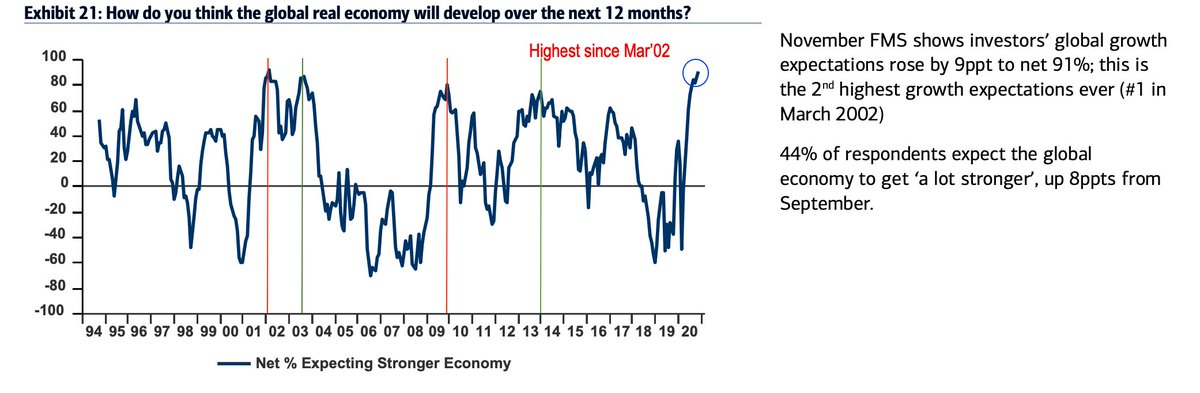
Macro: fund mgrs super optimistic on the economy. Well founded in 2003 and 2013-14; bad timing in 2002. In 2010, $SPX entered a 9-mo sideways range. This part of the equation is unclear but unfortunately the most important
You can get a base hit here but this is no fat pitch
To put the consensus view that $SPX will gain 8% in the next yr into perspective, the avg annual gain over the past 40 yrs is 10%. So, they are just playing the mean. The problem is the std dev is 16%, so it would be ‘normal’ for $SPX to lose 6% or gain 26% in any yr
$SPY Monday’s gap filled at 358 (i.e., at Friday’s close). That only leaves 6 more open gaps since the start of November
$SPX open gaps circled. Today also closed under WPP and the Sept 2 high w/o ever exceeding the Pfizer tippy top. WS1 (green line) at 3515
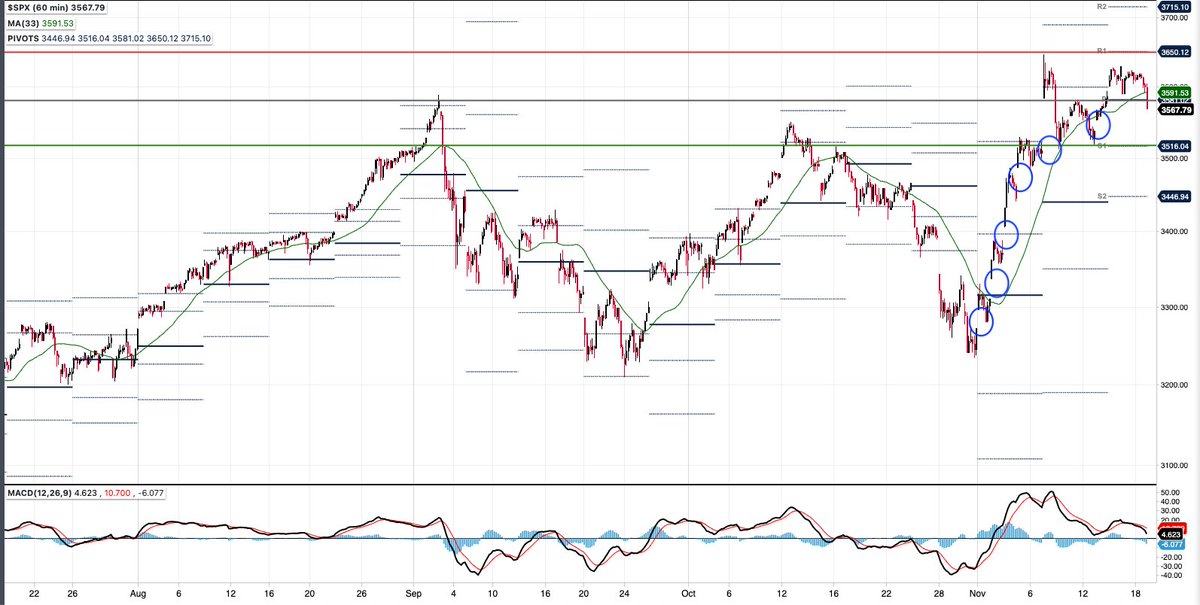
Not all gaps get filled but an unbroken string of open ones *tend* to get at least partially back filled. Ebb and flow.
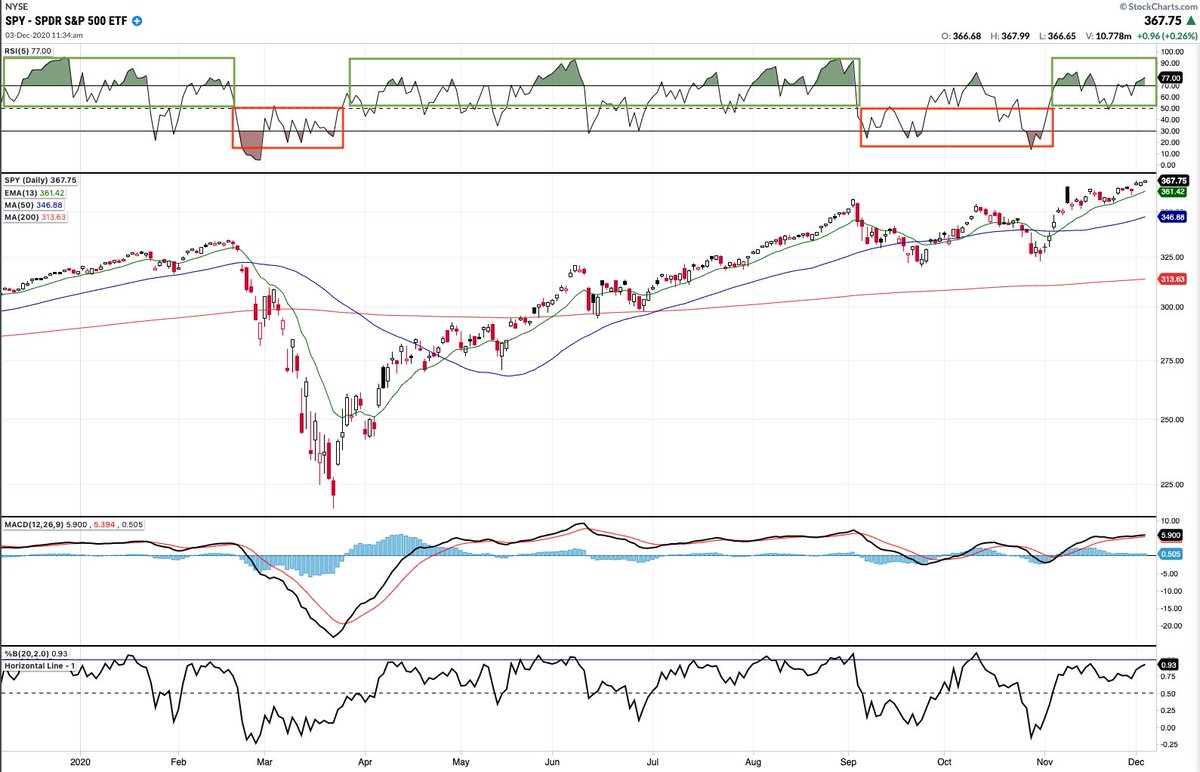
$SPY - two things to watch on the 60' chart for market direction. In uptrends, 1. momentum (top panel) often overbought and 2. the 5-d (green line; arrows) rises; the reverse true in downtrends.
If this is still an uptrend, it’s now time to regain the 5-d and get overbought
If this is still an uptrend, it’s now time to regain the 5-d and get overbought
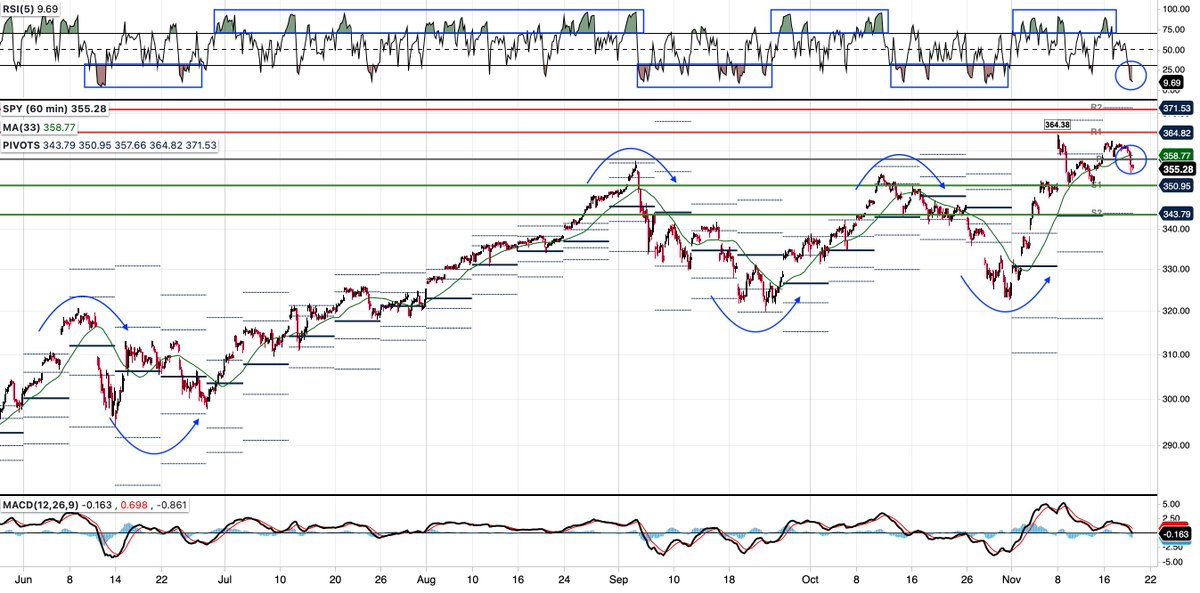
(Cont) The weekly pivot (WPP) is a third tell (horizontal grey lines). It’s good support in uptrends and if broken is usually quickly regained; the reverse is true in downtrends (arrows). Currently under.
If this is still an uptrend, time to regain WPP
If this is still an uptrend, time to regain WPP
JPM expects a 25% gain in $SPX in the next year. 4500 target
https://twitter.com/themarketear/status/1329513525031657472
$SPY hit a slanty line and why it’s not a reliable tell
https://twitter.com/ukarlewitz/status/1300907479291670528
$SPY - never regained 5-d, which has rolled over, or the WPP, and momentum died at neutral. Scroll up for charts.
Good summary of headwinds and tailwinds into YE
https://twitter.com/michaelsantoli/status/1330139162989780992
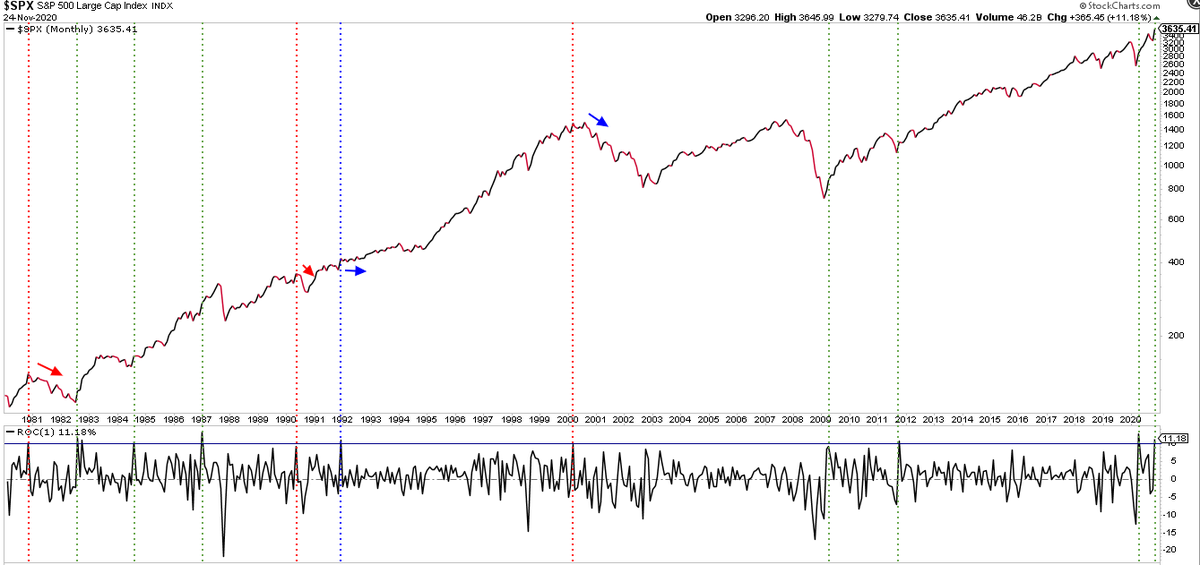
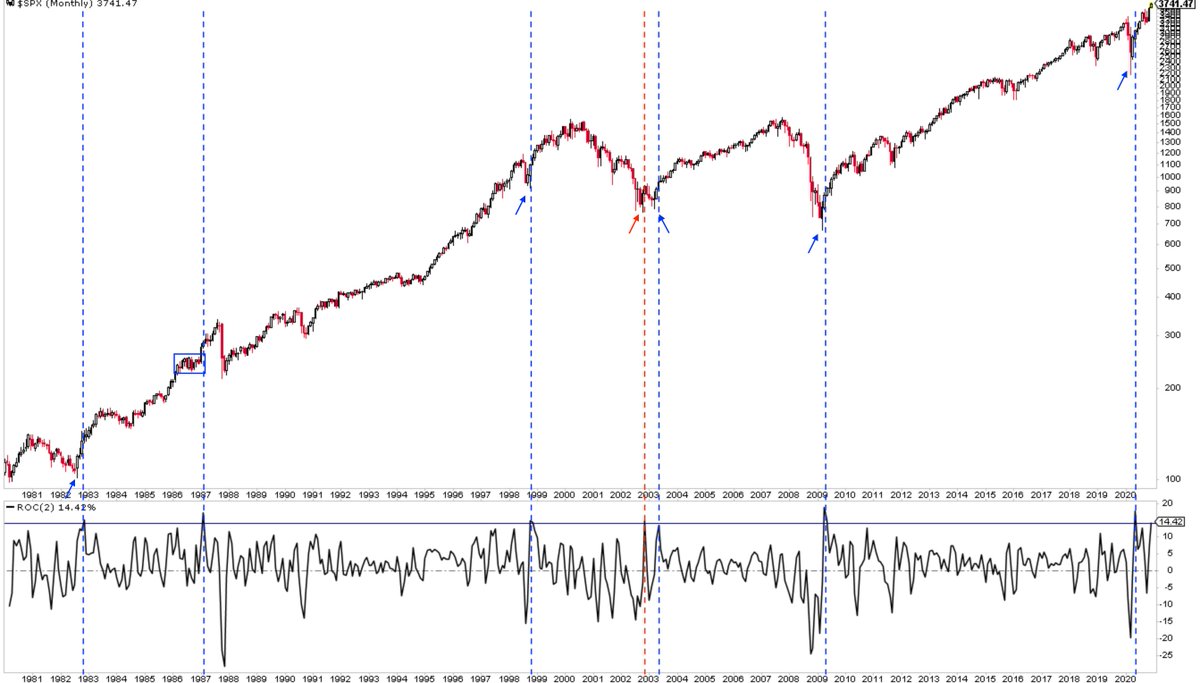
$SPX up 10% this month. Here are the others since 1980.
1. Marked tops in 1980, 1990 and 2000 and 10 months of nothing in 1992 (arrows)
2. The others were bullish but - notably - they came after sizeable falls, like this past April (green lines). Not really the case here
1. Marked tops in 1980, 1990 and 2000 and 10 months of nothing in 1992 (arrows)
2. The others were bullish but - notably - they came after sizeable falls, like this past April (green lines). Not really the case here
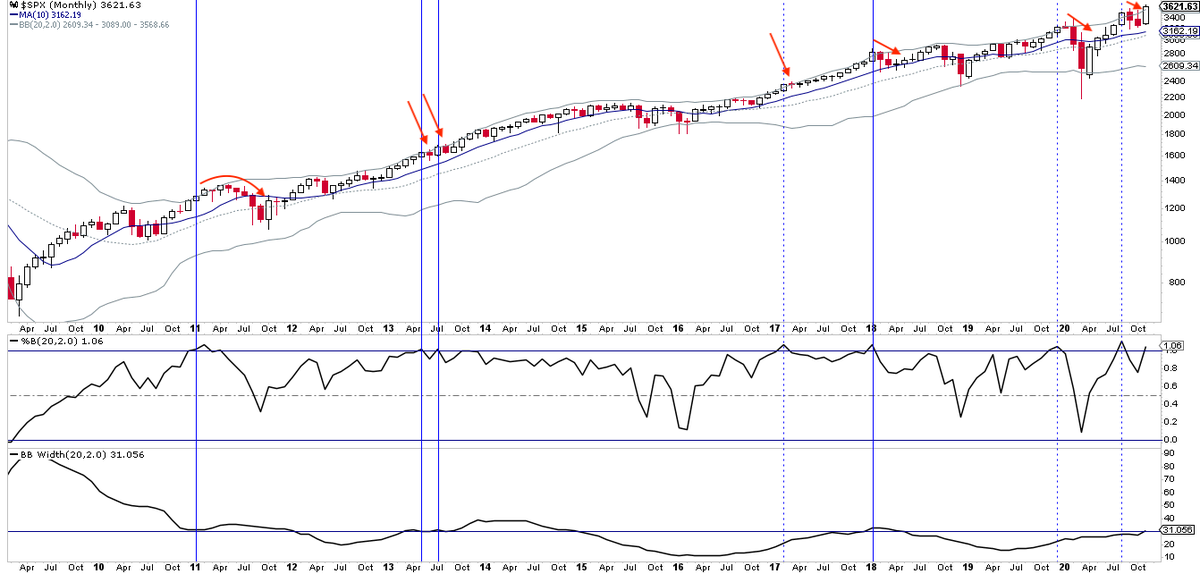
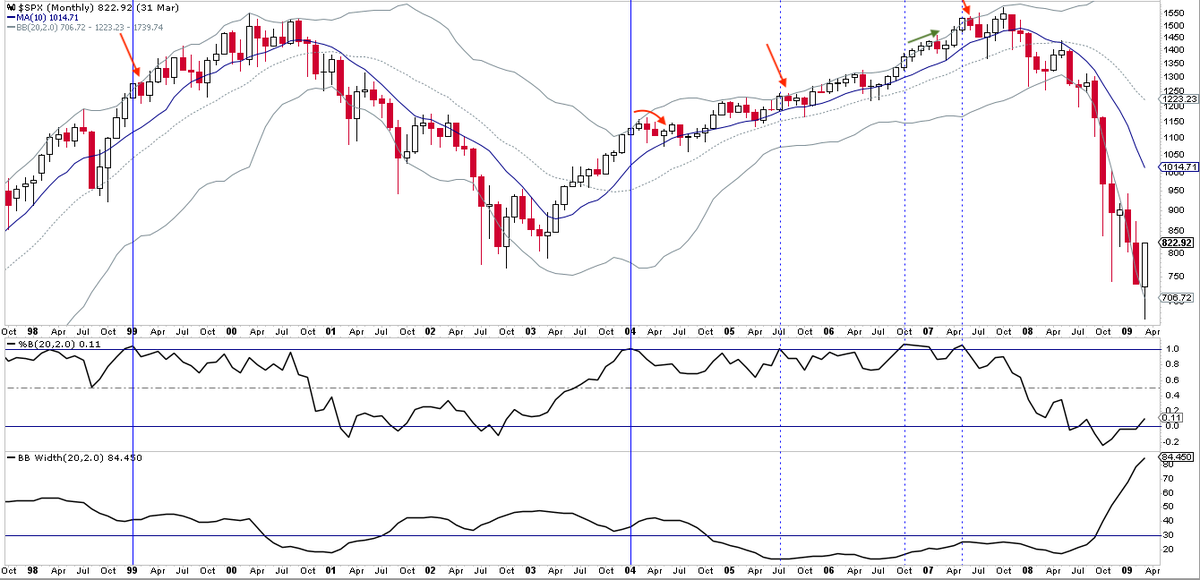
$SPX closed above its monthly Bollinger (middle panel) and those bands are not narrow (lower panel; solid vertical lines). Often followed by a down month or gains given back (red arrows). An uninterupted run higher, esp in last 20 yrs, has been rare (green arrows)
If past is prologue, R/R next 12-mo is highly skewed positive but a gap up-and-go (like today) has always been backfilled in the past $spx
https://twitter.com/SJD10304/status/1333836898368831488
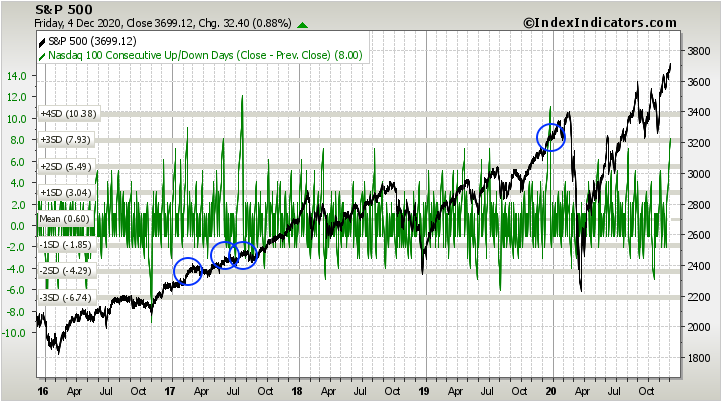
$SPX daily staying mostly ‘overbought’ is a defining characteristic of an uptrend (top panel). Consecutive closes under the 13-e (green line) will be a heads up.
SPX, COMPQ, NDX, RUT, DJIA, RUA, WLSH, NYSE all at ATHs
SPX, COMPQ, NDX, RUT, DJIA, RUA, WLSH, NYSE all at ATHs
Overall
A. Tailwinds
1. Trend - ATHs
2. Breadth - $NYSI +900
3. Seasonality - strongest month
B. Headwinds
1. Sentiment - bullish extreme
2. Valuation - 22x FY21
3. Volatility - pos correlation to equities
C. Unclear
1. Macro: 1H21 downside risk; 2H21 likely expansion
A. Tailwinds
1. Trend - ATHs
2. Breadth - $NYSI +900
3. Seasonality - strongest month
B. Headwinds
1. Sentiment - bullish extreme
2. Valuation - 22x FY21
3. Volatility - pos correlation to equities
C. Unclear
1. Macro: 1H21 downside risk; 2H21 likely expansion
@michaelsantoli perfectly sums up the current market. A lot could right in the next few months, and that outcome would surprise the fewest. Sometimes that works. More often, it doesn’t. This is why you get paid the big bucks
https://twitter.com/michaelsantoli/status/1335216800687157248
@michaelsantoli $NDX up 8 days in a row; only 4 other times in the past 5 years (very small sample). $SPX closed higher each time 5, 10 and 20 days later
@michaelsantoli $SPX now 16.8% above its 200-d (lower panel). All instances since 1960 shown below. Common after bear market lows (green circles: 1970,74, 80, 82, 2009). Sooner or later, any future gains (and often more) have always been given back 1/2
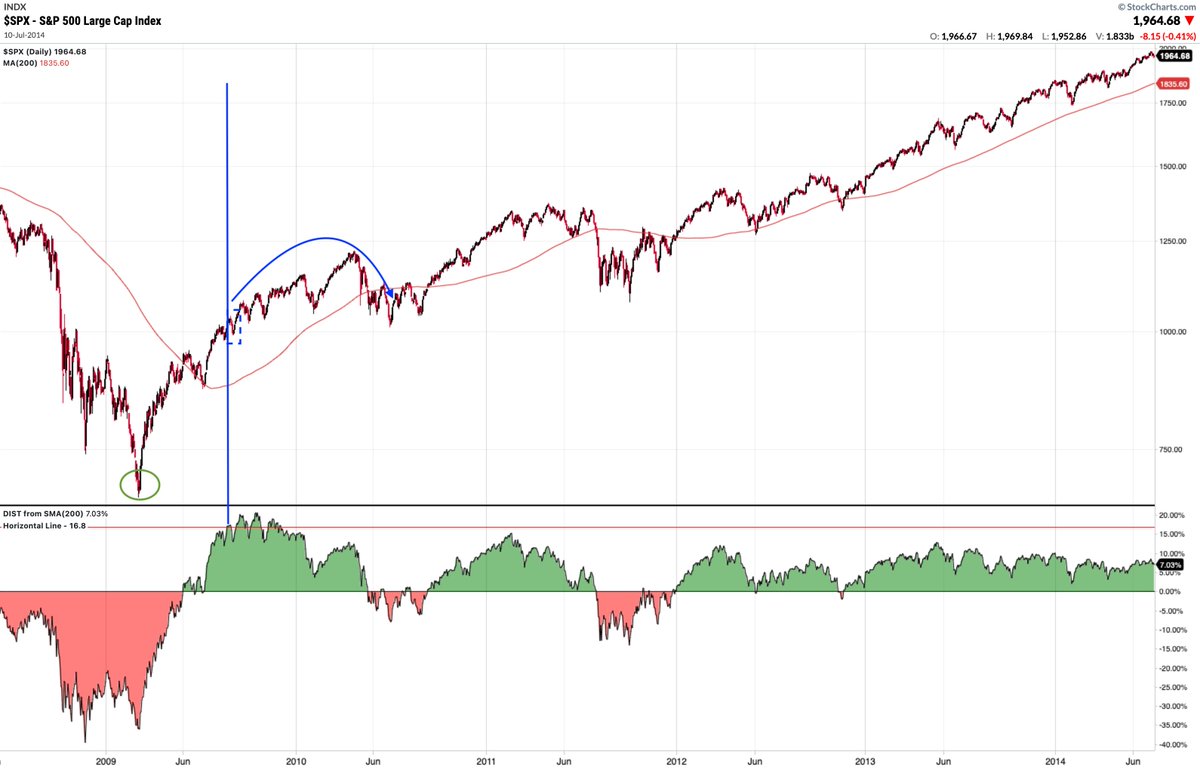

@michaelsantoli (cont) There are no charts from the 1960s because it never happened 2/2
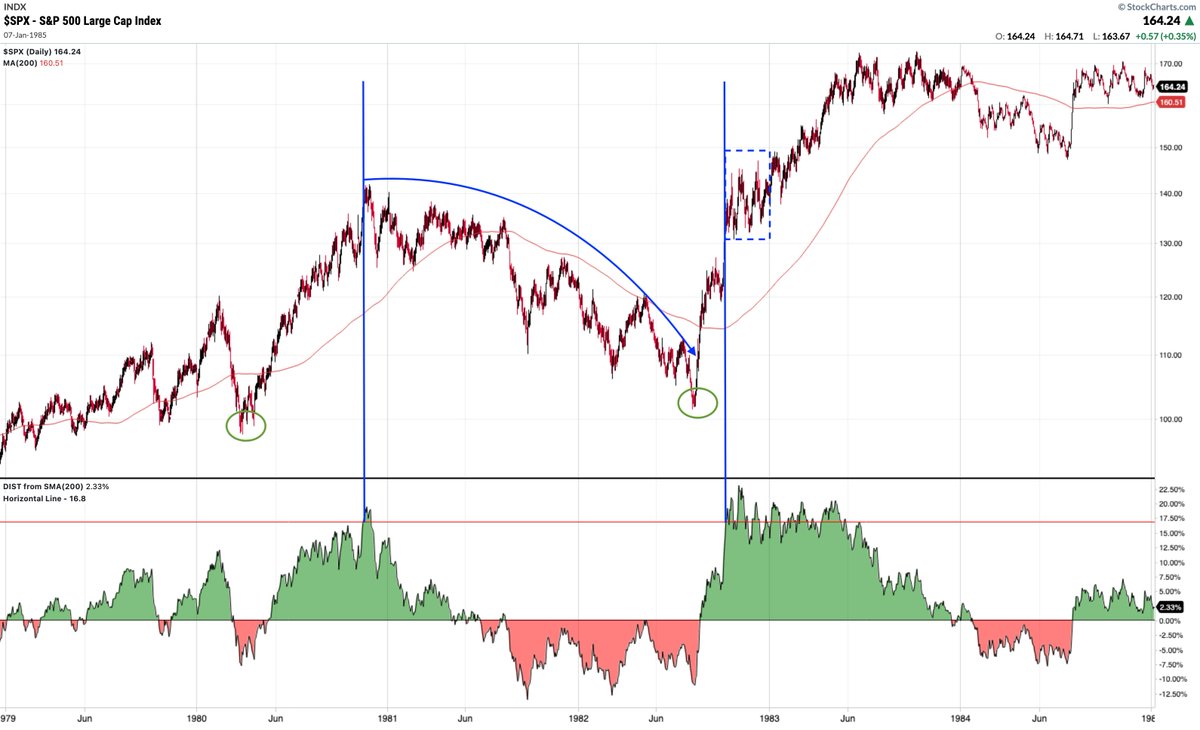
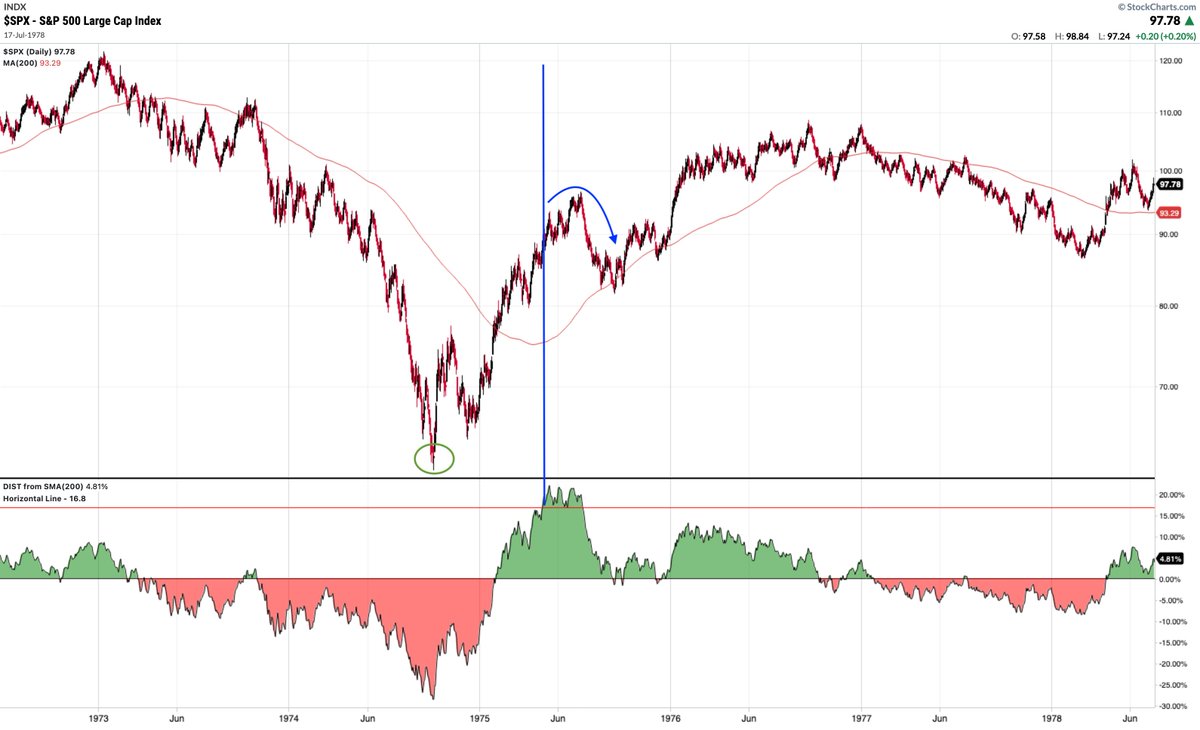
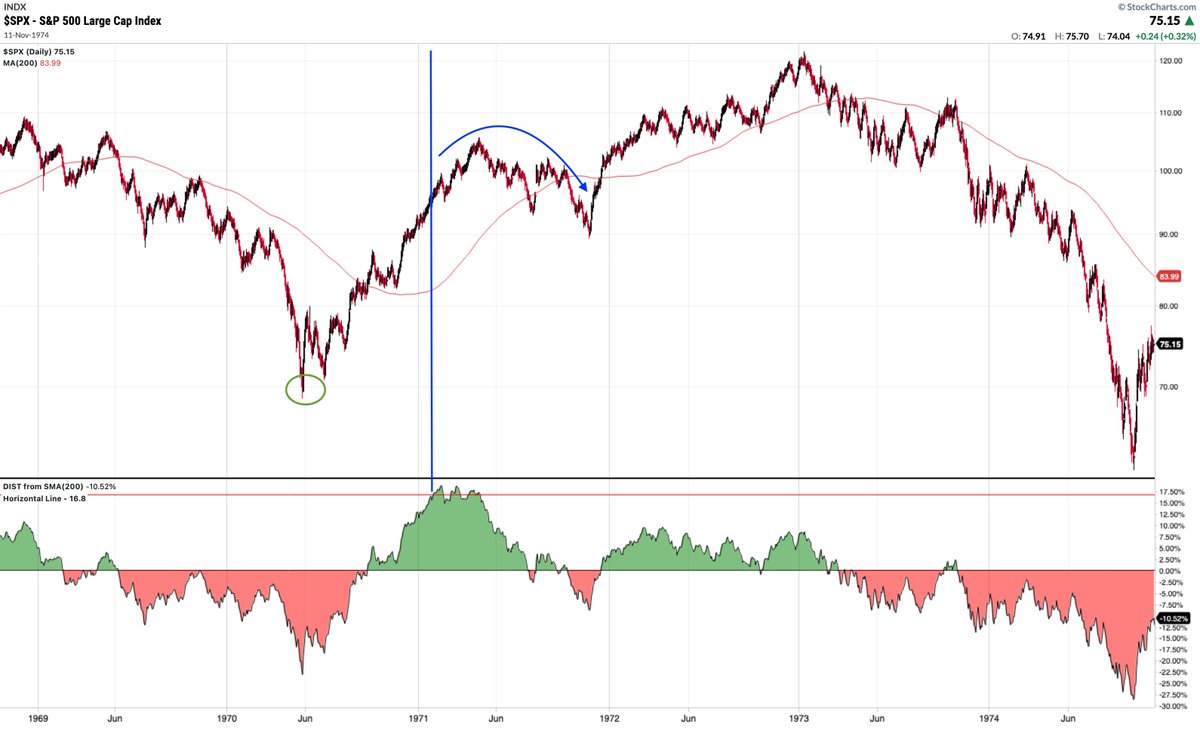
Both August 1987 and November 1980 are in the mix. So not just something that happens at bottoms
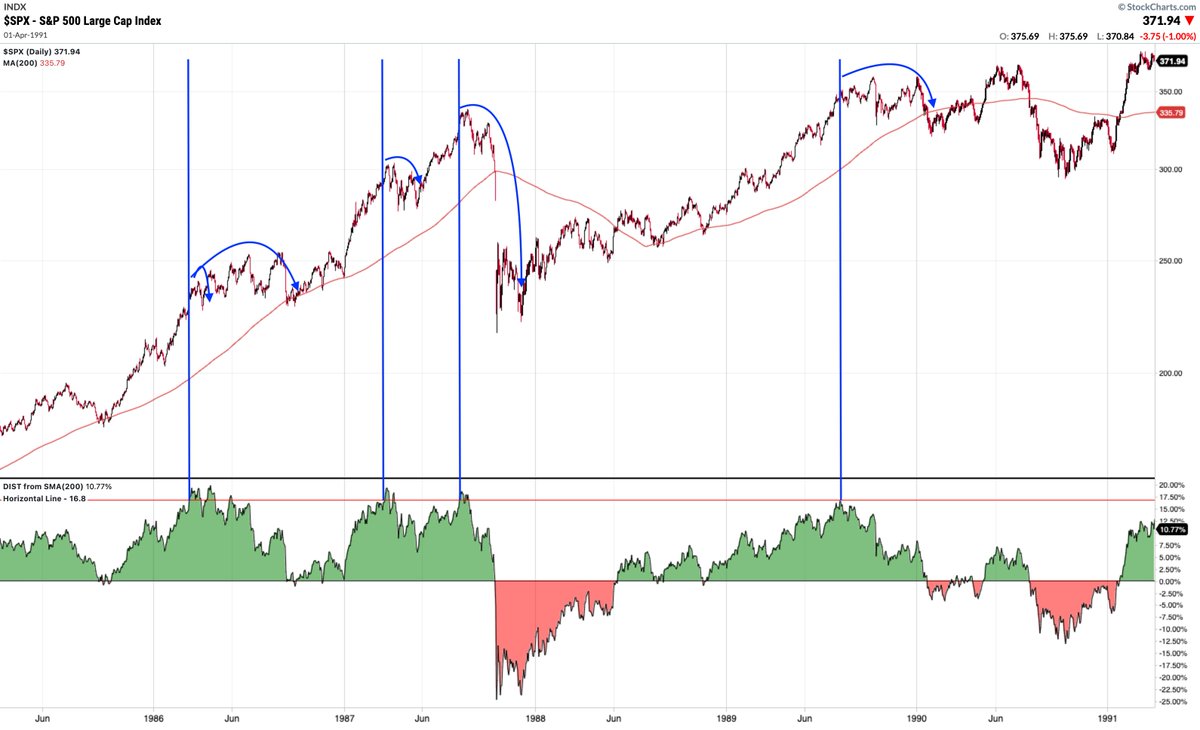
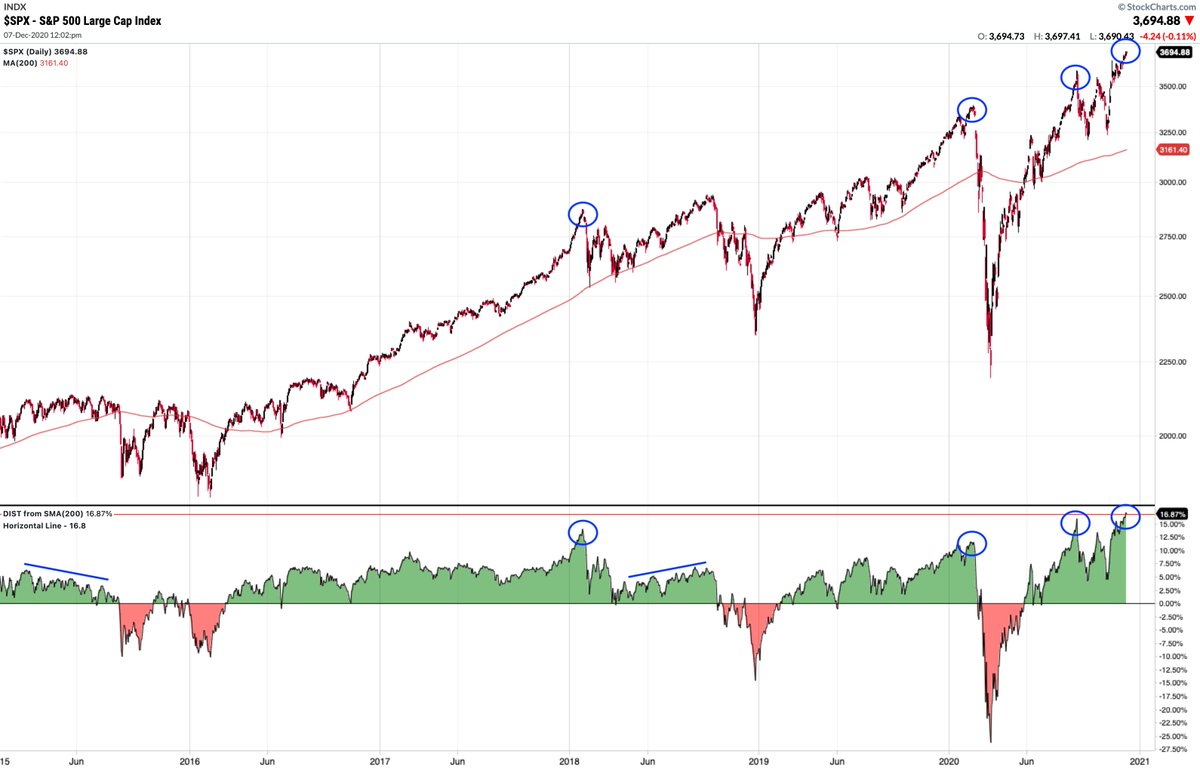
For completeness, here’s the last 6 yrs. Sometimes $SPX weakens before it tops (2015) but in recent years, tops have come at times of extreme strength
$SPX down 2 in a row. Hasn’t been down 3 since Oct. In the past year, down 3 has continued lower (boxes). Momentum (top panel) also on the dividing line
After an ATH and then 4 down days, all instances except 1 gained sometime over the next month by a medain of 2.5%, more than enough for a new ATH. But along the way, all instances except 2 dipped lower than today’s close by a median of 1.5%
https://twitter.com/SJD10304/status/1338610140258258944
ATHs today: $SPX $DJIA $NYSE $RUA $WLSH $RUT $COMPQ $NDX $IEV $VEU $EEM
That’s about as close to a clean sweep as you can get
That’s about as close to a clean sweep as you can get
DeMark says $spy to 390 in next two weeks and then ‘down significantly’ in 1H21 marketwatch.com/story/stock-ma…
This week, for example, $SPY gained +1.7% overnight and lost 0.5% during market hours
Strategists expect $spx to gain 9% to 4030 in 2021. No one expects a decline. A month ago, their target was 3900. That’s how this works (scroll up)

Always applies to annual forecasts
https://twitter.com/ukarlewitz/status/1329135676298694656
$SPX closed this week right where it closed the week of Nov 30. Last 4 wks have alternated up, down, up, down.
https://twitter.com/ukarlewitz/status/1333950273333600256
Most interesting thing I saw yesterday (lower panel). Quite happy to sell the overnight gap up open $spx
$SPX up 14% the past 2 months. Only 7 other occurrences in 40 years. 6 of prior 7 went much higher in months ahead because all happened at major lows (like March of this year); 1987 started after SPX dead flat for 9 months (box).
So, current instance nothing like the others
So, current instance nothing like the others
The set up coming into the last two months of the year (1/2)
https://twitter.com/ukarlewitz/status/1322211068685422602
$SPY to $390 in the next 3 hrs not looking so good
https://twitter.com/ukarlewitz/status/1340040982063005696
2020 ends with $SPX $DJIA $WLSH $NYSE $RUA and $NDX at ATH. Outside US, $EEM $IEV and $VEU at ATH yesterday.
Happy New Year everyone. Onward to 2021
Happy New Year everyone. Onward to 2021
https://twitter.com/InvestiQuant/status/1344749285028585472
$SPX closed above its monthly Bollinger for a 2nd month in a row (middle panel). Ahead was a lot of chop (eg 1989) or gains given back if higher (eg 2011). The one time it just ran higher (1995) came after a flat boring year when those bands had become super narrow (lower panel)
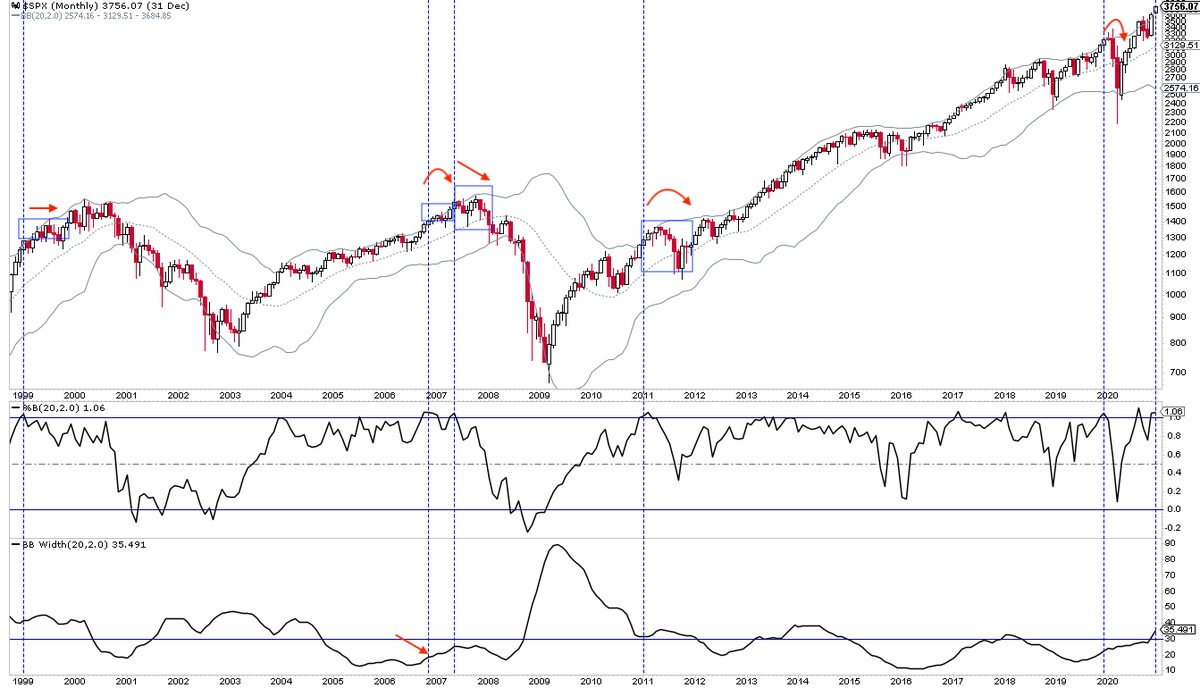
Aug 1987 and Dec 2019 also in the mix to keep it exciting
Today’s gap up ICYMI $spx
https://twitter.com/InvestiQuant/status/1344749285028585472
Reminder that the stock market doesn’t care whether the government is split or unified. There’s no consistent pattern therefore no cause and effect
https://twitter.com/ukarlewitz/status/1324490784704471040
$SPY - Slanty line update. It’s +$10 since it first hit it. Follow the micro thread here:
https://twitter.com/ukarlewitz/status/1339938581402415104
$SPX $RUA and others at ATH with 10 separate -1000 ticks in the last 90 minutes must be n=1
New ATHs today for $NYSE $RUA $WLSH $DJIA $RUT $IEV $VEU (but not $SPX)
https://twitter.com/sspencer_smb/status/1346934460470595586
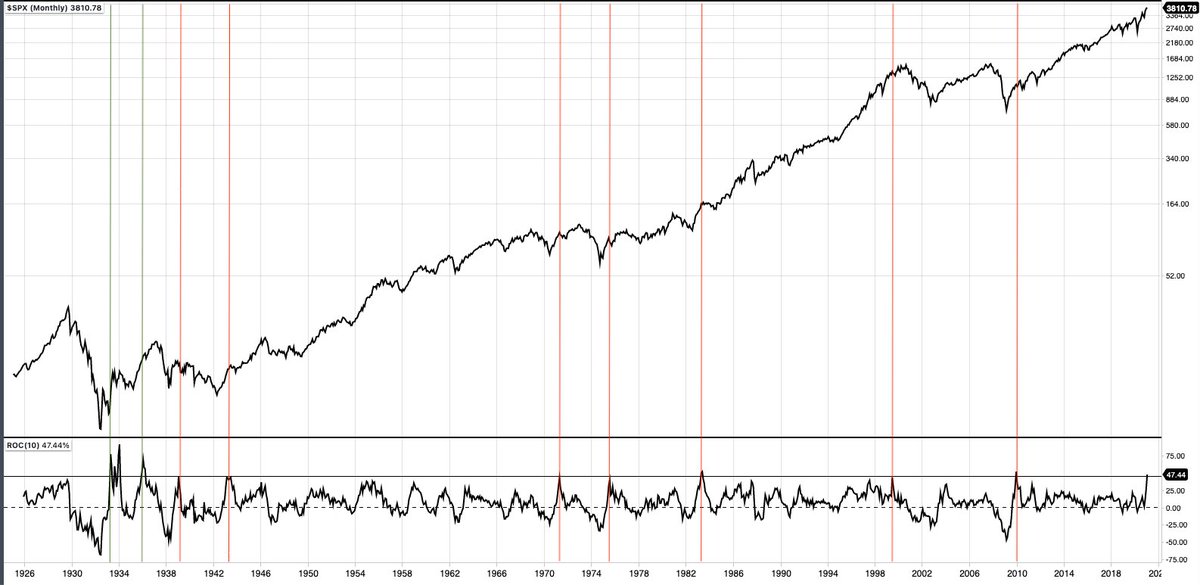
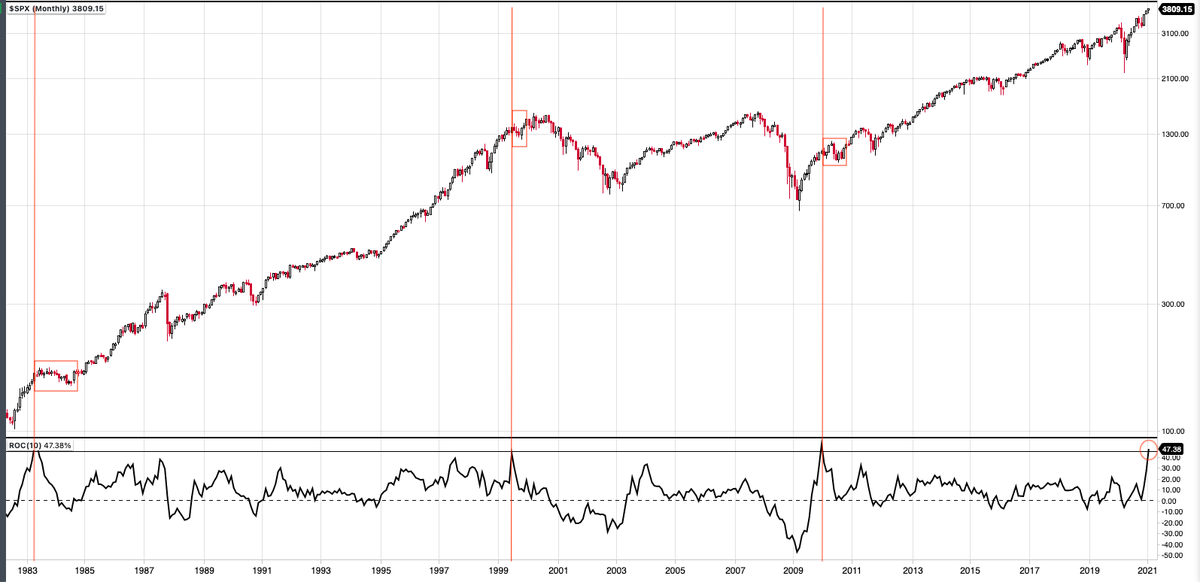
$SPX up 47% in the past 10 months. Only in the 1930s did it gallup higher (LHS, green lines). All other instances followed by a ‘breather’ (RHS, close up of last 40 yrs).
But, in all instances, fair to say this isn’t how bull markets end; momentum wanes before reversing
But, in all instances, fair to say this isn’t how bull markets end; momentum wanes before reversing
• • •
Missing some Tweet in this thread? You can try to
force a refresh