98%.
What if I told you that confirmed flu surveillance across the world has dropped year over year by 98% since April?
This is the deep dive story with data, graphs and charts showing how the world's most consistent nemesis has (almost) completely vanished.
-1-
What if I told you that confirmed flu surveillance across the world has dropped year over year by 98% since April?
This is the deep dive story with data, graphs and charts showing how the world's most consistent nemesis has (almost) completely vanished.
-1-

We began hearing reports back in May the flu was nowhere to be seen in the Southern hemisphere, which was the start of when cases usually peak. I had theorized as early as June and July that perhaps Covid was keeping the flu away.
-2-
-2-
https://twitter.com/kylamb8/status/1286446749914206208?s=20
Though just a theory I floated at the time, probably earlier and more consistently than most, it's one that now shares some scientific backing.
Check out this study published Sep. 4 in The Lancet that corroborates the theory with some precedent.
thelancet.com/journals/lanmi…
-3-
Check out this study published Sep. 4 in The Lancet that corroborates the theory with some precedent.
thelancet.com/journals/lanmi…
-3-

Of course, there are other theories as to the disappearing act. One is sinister. Some say the flu never left, but the cases are showing up as Covid. I'm not here to advance that but it's out there. Others say masks & mitigation stopped it. I will show that to be silly.
-4-
-4-
Before we go further, here is the bottom line: using the WHO FluNet database from the Global Influenza Surveillance and Response System (GISRS), I have aggregated all flu cases by week from 2019 by WHO transmission zone (there are 18 of them) and also for 2020.
-5-
-5-
For WHO surveillance, weeks begin with a Monday and end on a Sunday. When splitting 14 zones into the Northern Hemisphere, 4 into the Southern Hemisphere, here is what we get for a comparison for the first 8 weeks, since week 10 and since week 15. 97.9% decrease since Wk. 15
-6-
-6-

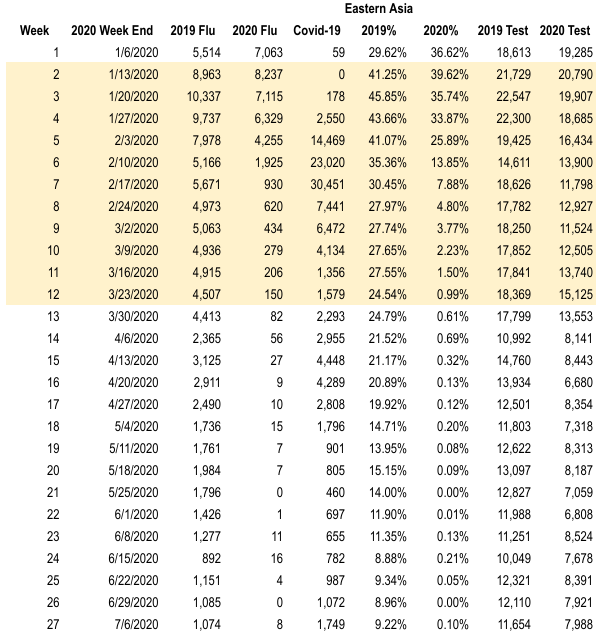
Let's start where this all began: China. Of course, the numbers there should be taken with a grain of salt, but the pattern will be unmistakable. Here is the WHO Eastern Asia flu transmission zone by week for 2019 compared to 2020. See how flu dives once Covid arrives.
-7-
-7-
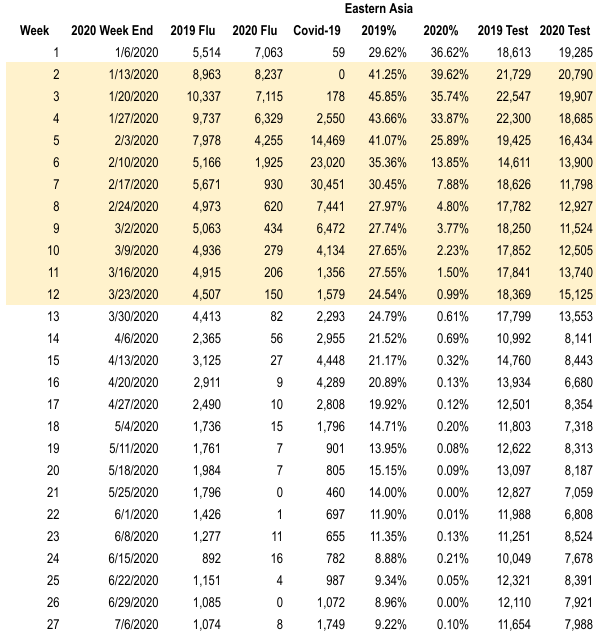
This is no isolated case. Let's bring in three other Northern temperate flu zones (N. America - U.S. & Canada, Northern Europe and South/West Europe). As soon as Covid-19 cases show up, see how flu cases and % positive take a nosedive in all four zones.
-8-


-8-
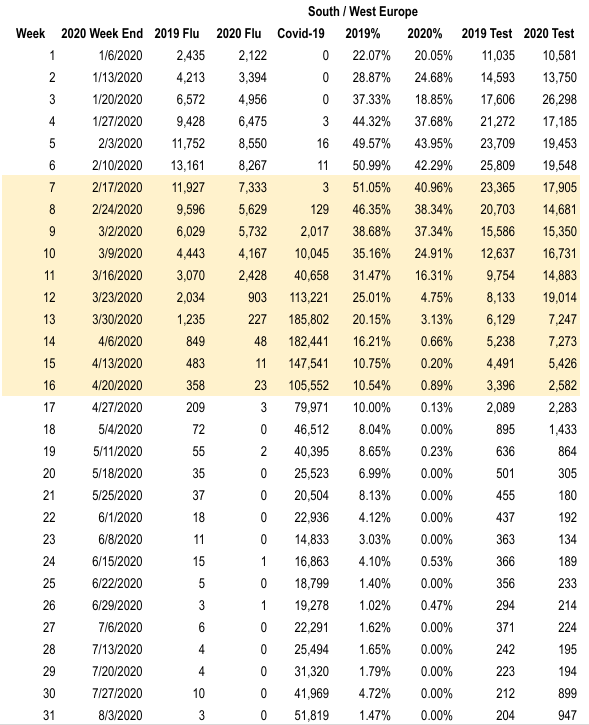
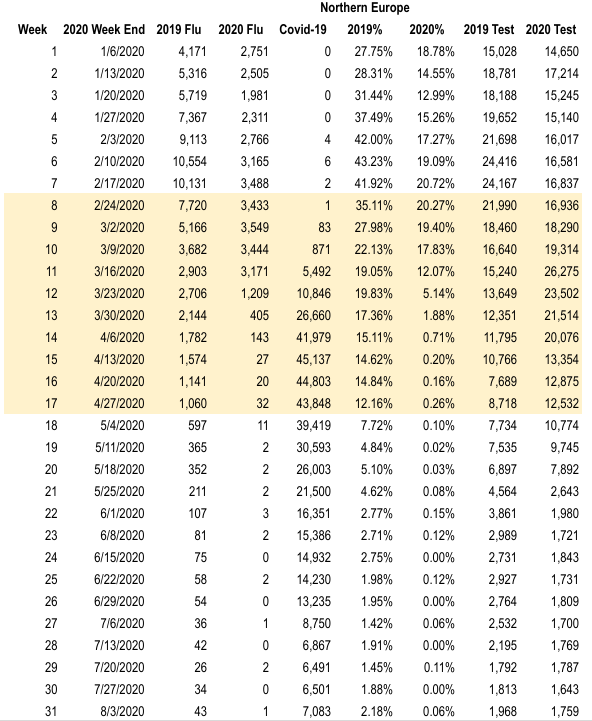
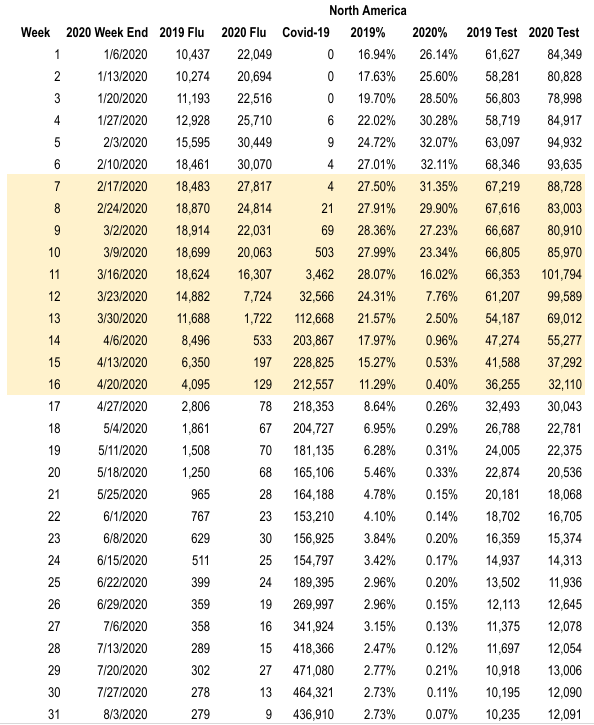
Let's go one better and show a visual. Using a log scale, here is what 2019 cases (green), 2020 cases (red) and Covid-19 cases (yellow) look by week. See 2020 flu cases deviate from 2019 as soon as Covid intersects. The bottom is cropped because of literal zero cases.
-9-
-9-
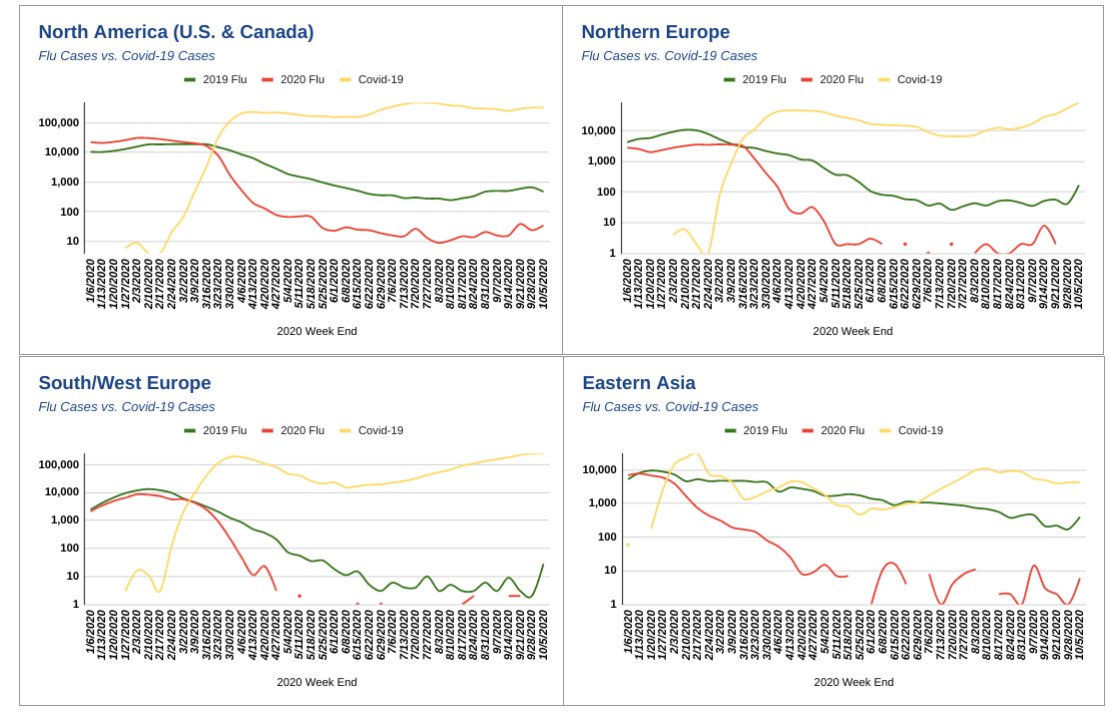
It's important to remember a mere fraction of all flu cases are ever confirmed. And within those, a lower total is monitored within GISRS reporting. Still, we are about to see a shocking pattern of consistency. Nevermind that 98% of these surveillance cases went away.
-10-
-10-
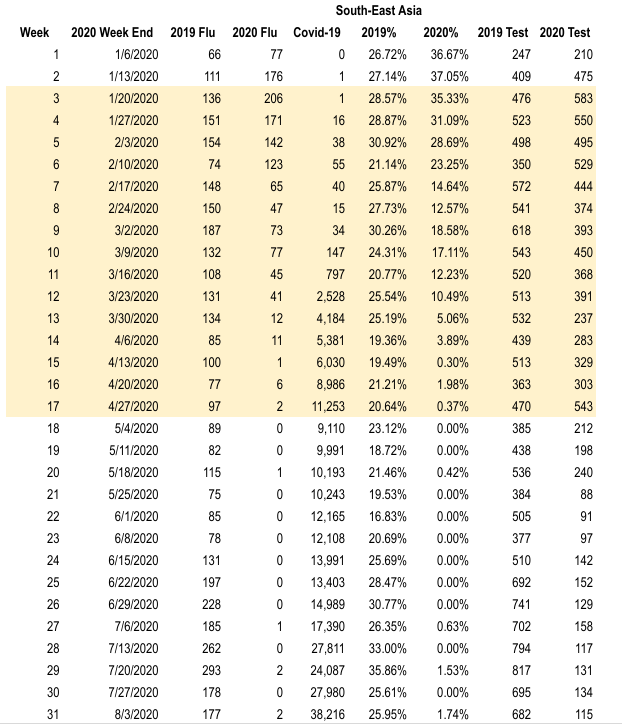
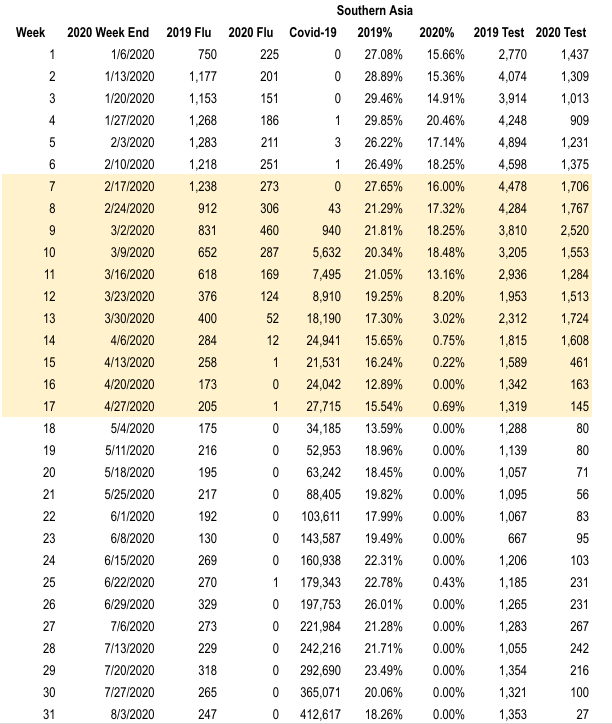
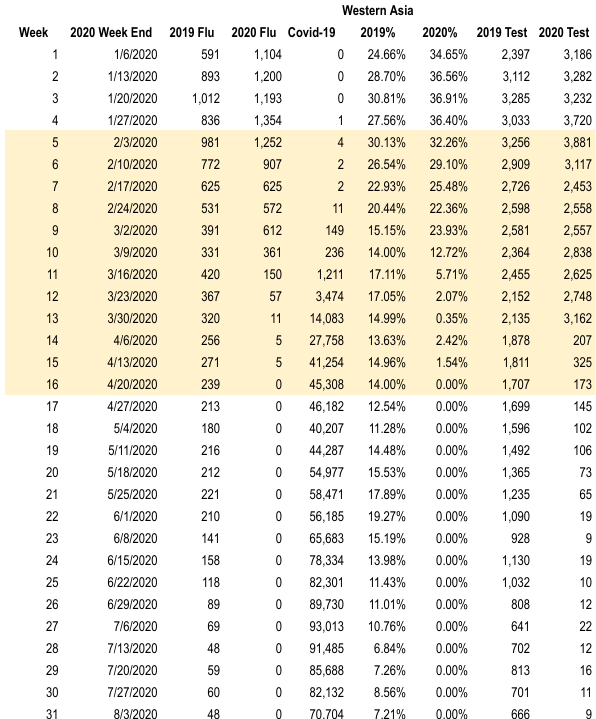
Here are four more flu zones in the Northern tropic/sub-tropic regions. We have Central America/Caribbean, the Middle East, Southern and Southeastern Asia zones. Slightly different timing, same patterns. Flu goes away when Covid says 'hey'
-11-
-11-
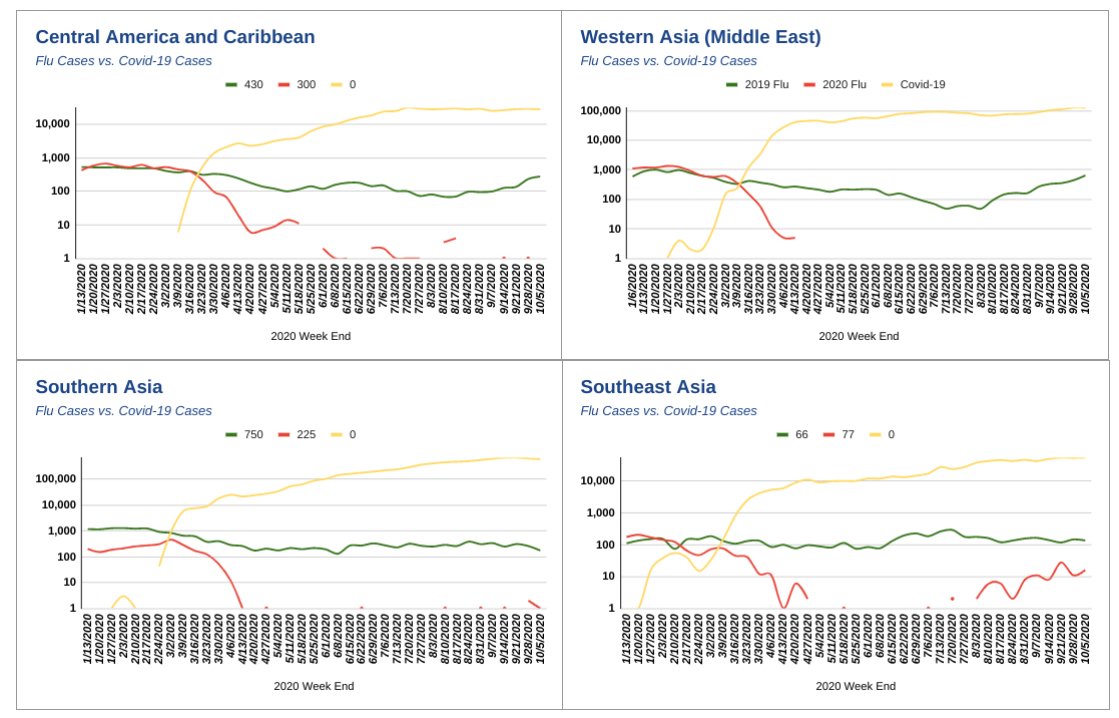
Here, we can see the data showing how once Covid ascends, flu cases are immediately suppressed. It's important to see that testing does not really decline. In fact, since week 15 globally, flu tests are actually up over 2019.
-12-


-12-
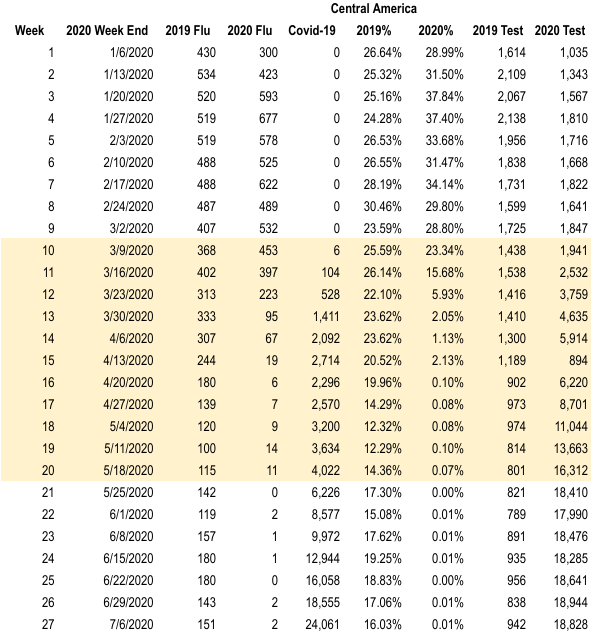
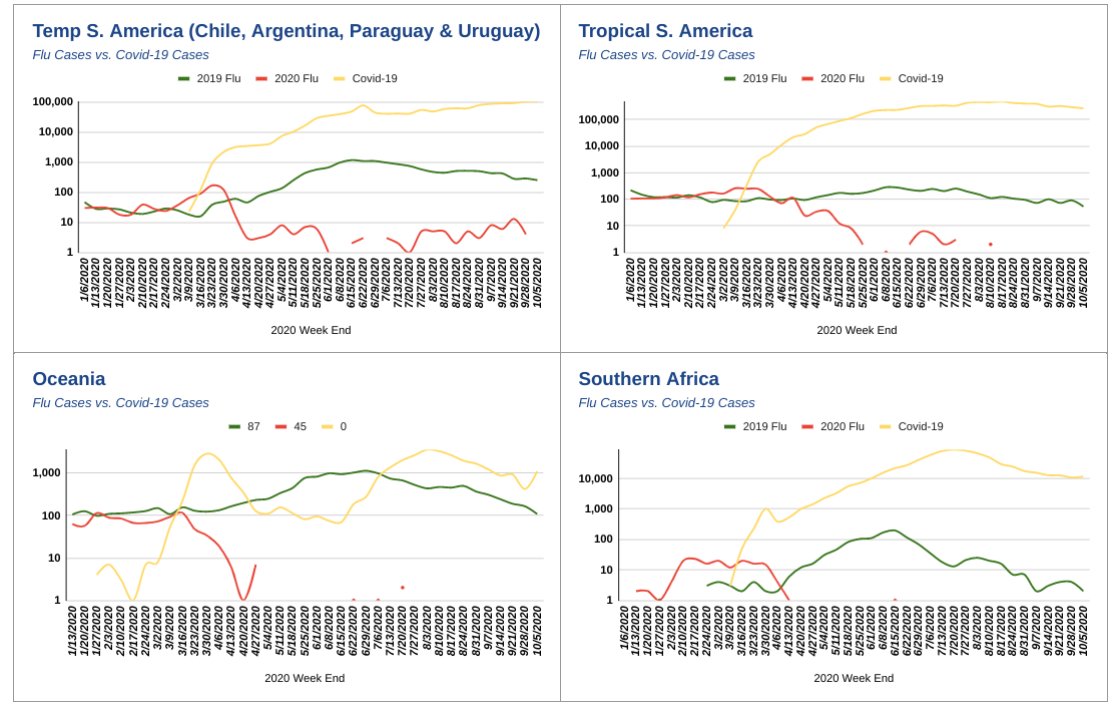
In the Southern hemisphere, where the trend was first noticeable by experts, we confirm the flu never really got going. See the modest number of cases by week and zone in both South America regions, Southern Africa and Oceania (primarily Australia).
-13-


-13-
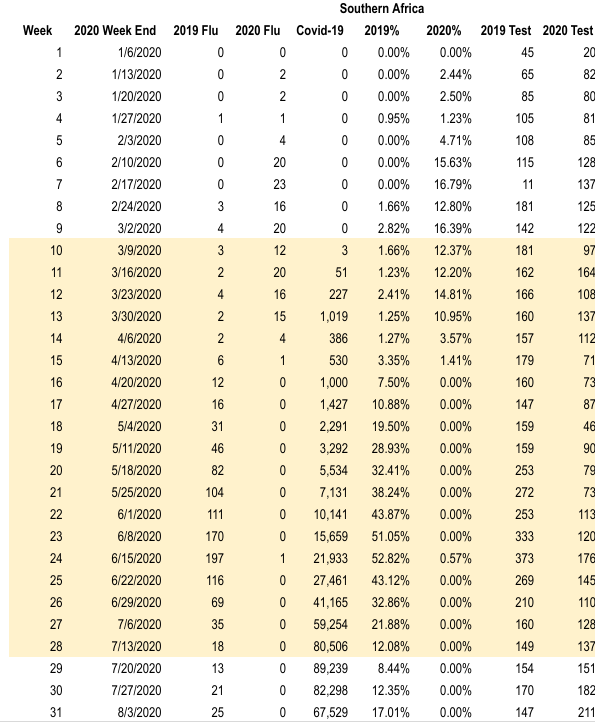
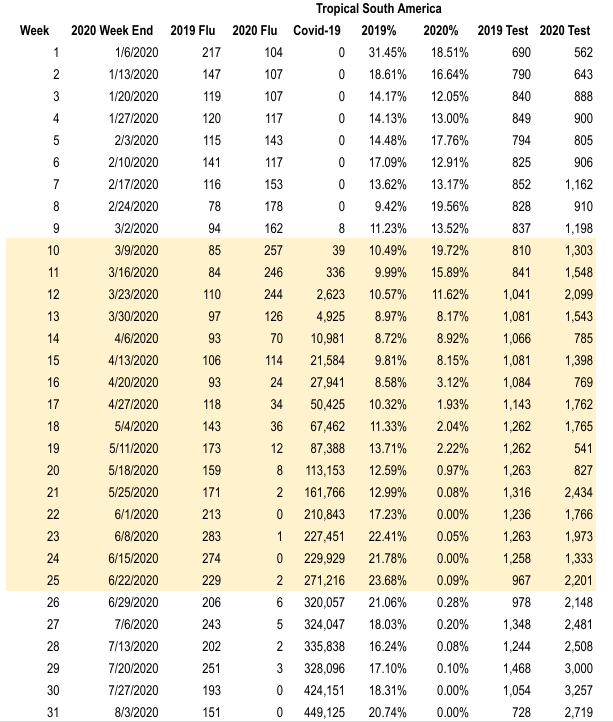
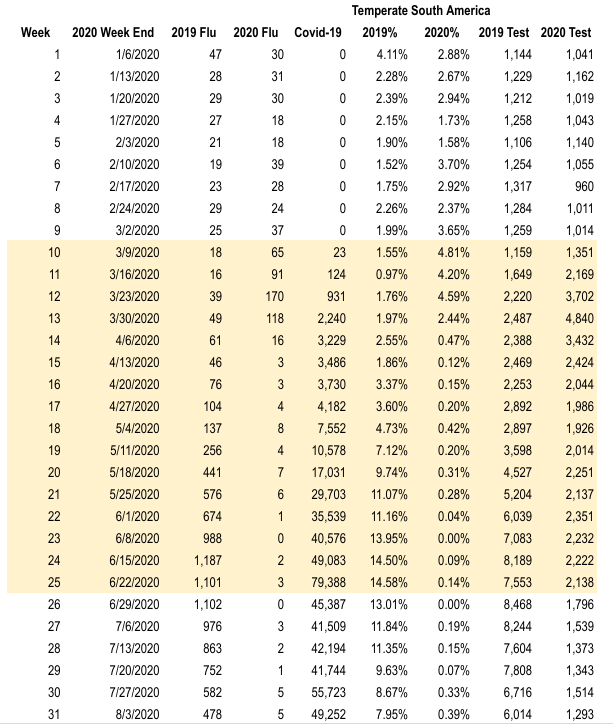
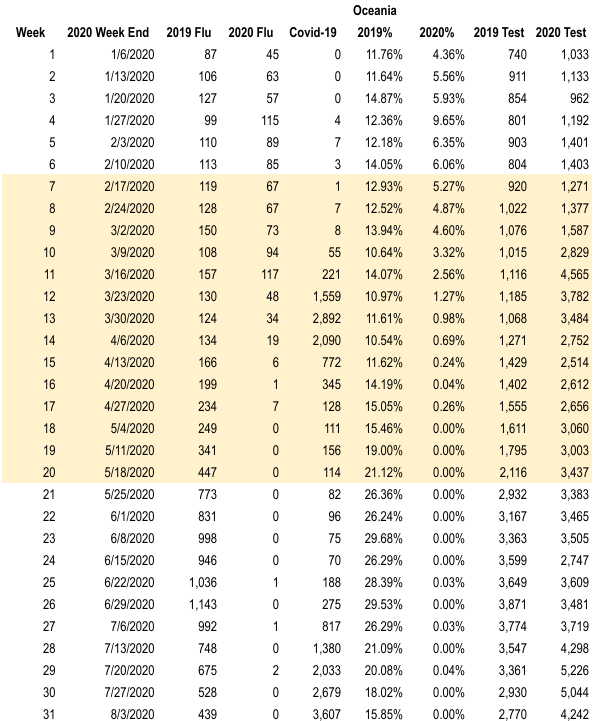
Now let's see those four Southern hemisphere zones in graph form. They follow a different timeline than Northern hemisphere but same result: once Covid-19 cases ascend, the 2020 flu cases depart from the 2019 trend.
-14-
-14-
Some argue masks, distancing & lockdowns were responsible. However, most zones began going down before these mitigation measures were in place. And to argue mitigation stopped the flu defies decades of scientific research and simultaneously destroys the idea it stops Covid
-15-
-15-
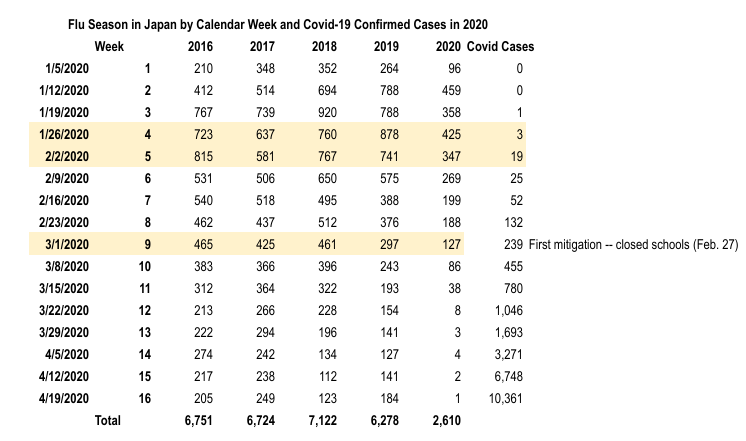
Some will still argue the point just because. Let's look at Japan, a place that is credited with disciplined mask wearing even during the flu... which didn't stop WHO from categorizing them as having "widespread outbreak" the past five flu seasons.
-16-
-16-
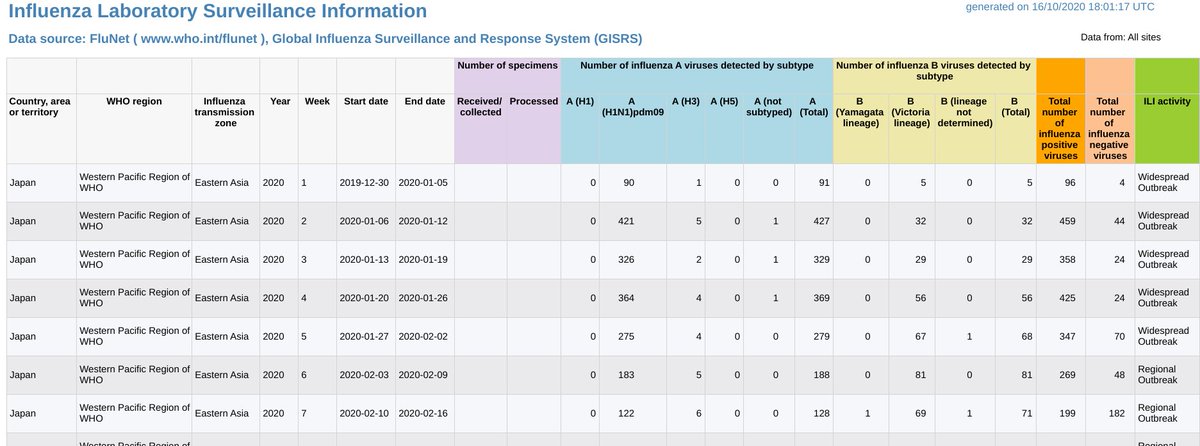
Let's look at the past four flu seasons for Japan, weeks 1-16. Compare them to 2020 and see how the cases fell off a cliff when Covid arrived and it happened before the first mitigation measure -- school closures -- even began.
-17-
-17-
Bottom line: confirmed flu cases were down only about 0.8% globally the first 8 weeks of the year. But as soon as Covid-19 began spreading, flu cases stopped. They're down YoY 69.4% since week 10 and 97.9% since week 15.
-18-
-18-
So what does this mean? Some will say they've replaced flu cases with the flu. I can't rule anything out but for now I'll stick with my theory from the summer that Covid-19 has pushed out the flu. This suggests fear mongering over a winter "twindemic" is misplaced.
-end-
-end-
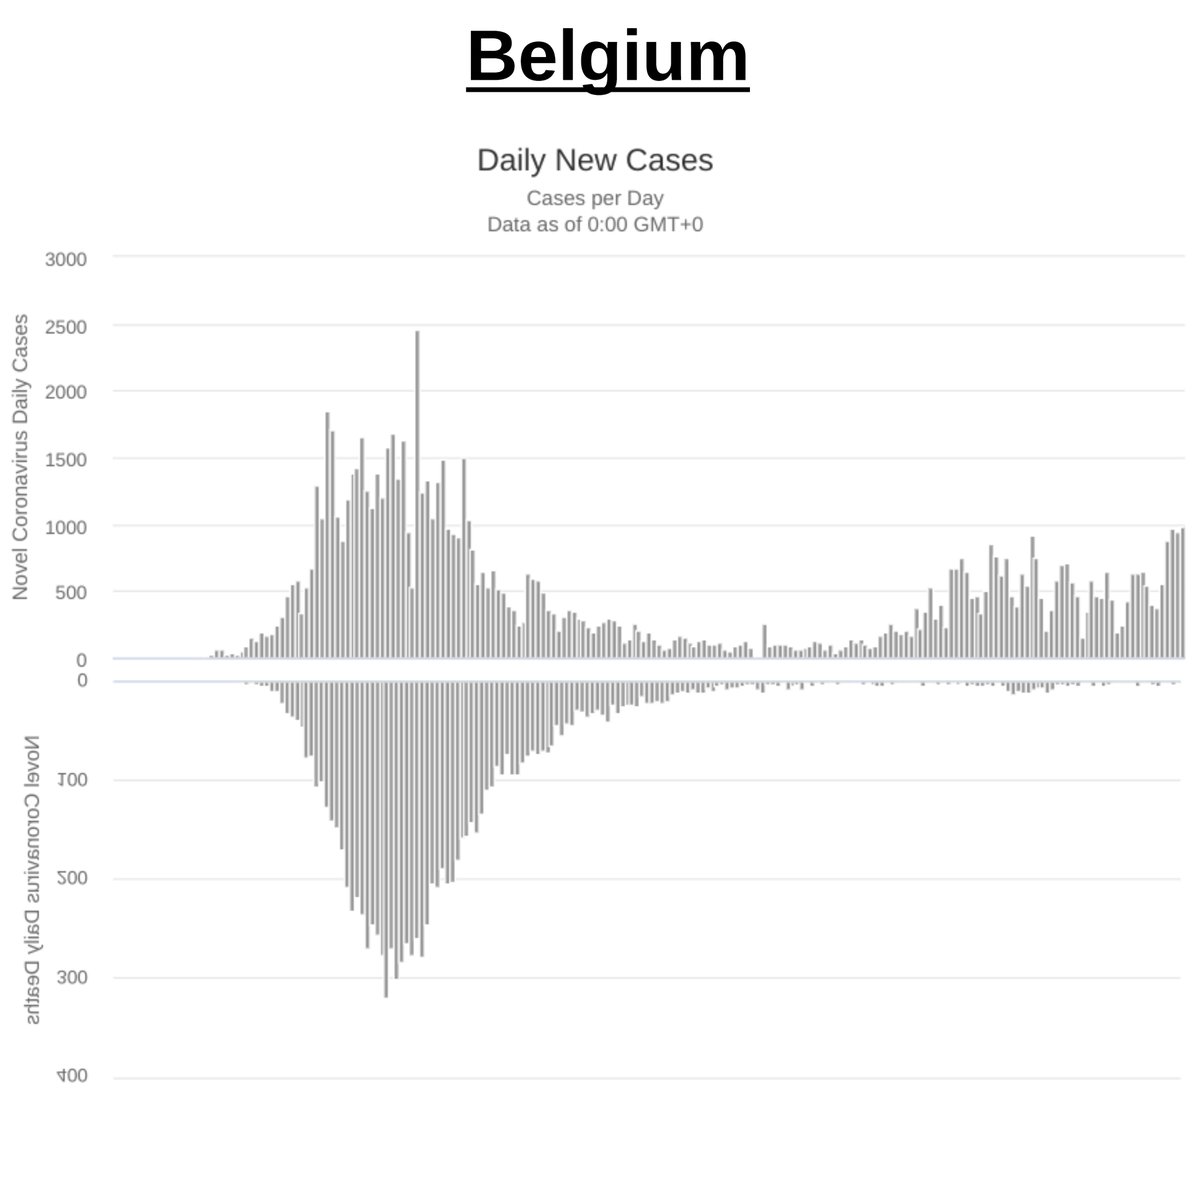
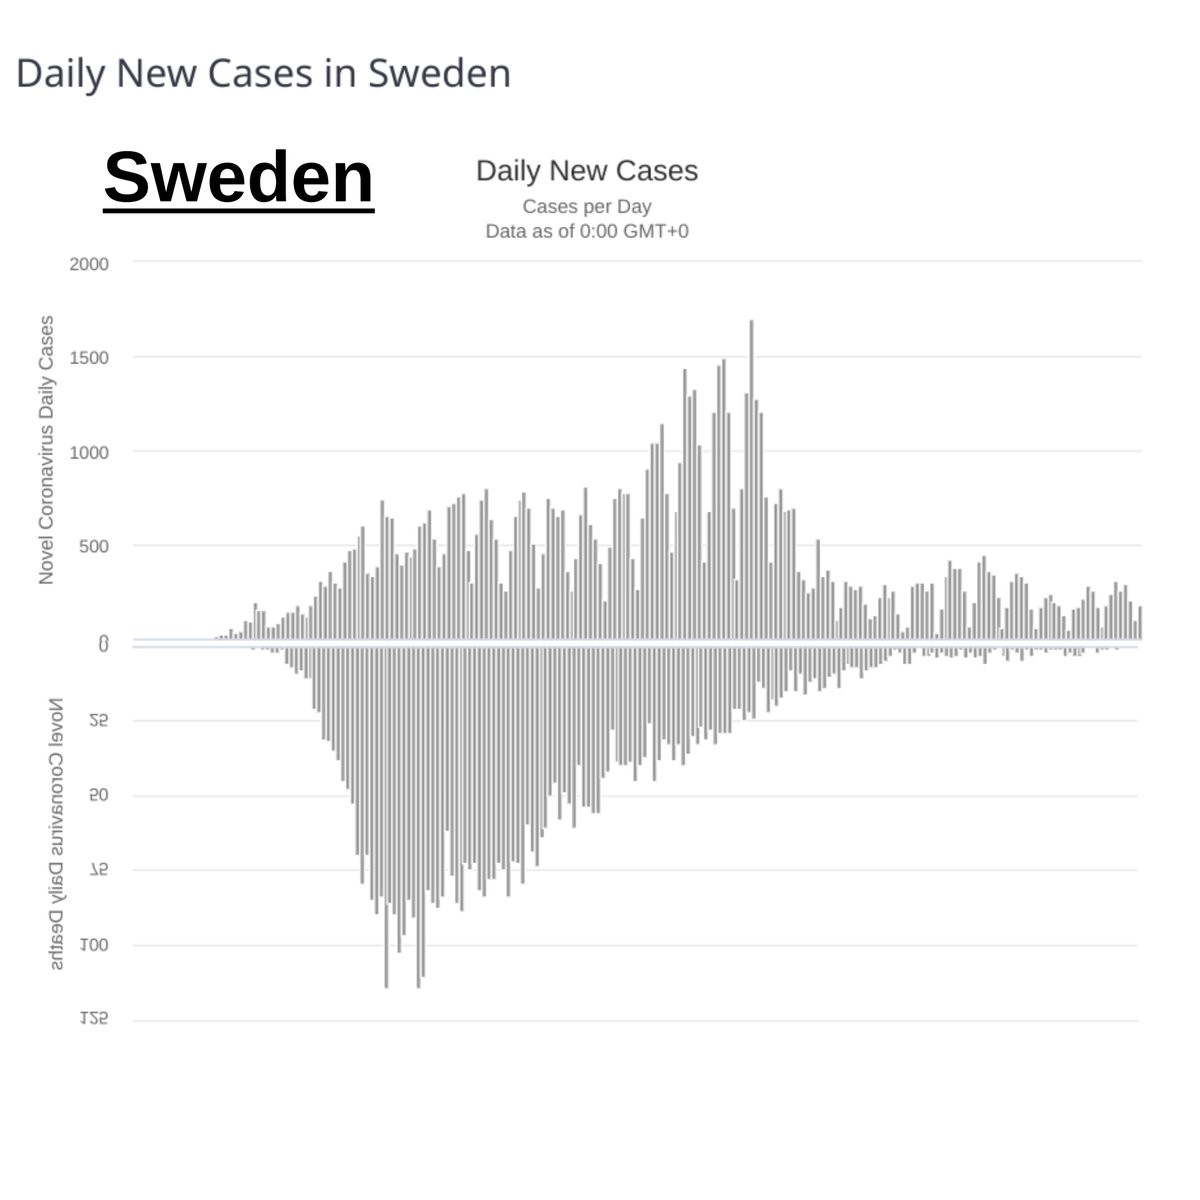
Addendum: Just to show it's not mitigation, since Japan was already wearing masks and the flu dropped off before any mitigation began, see the same thing happened in Sweden without masks and without mitigation! 


Final addendum for the 'mitigation cured the flu' crowd... if that is true, you realize it means mitigation stopped flu dead in the middle of established outbreaks and allowed Covid to explode on to the scene without getting in its way. Is that really the hill you want to die on?
• • •
Missing some Tweet in this thread? You can try to
force a refresh


