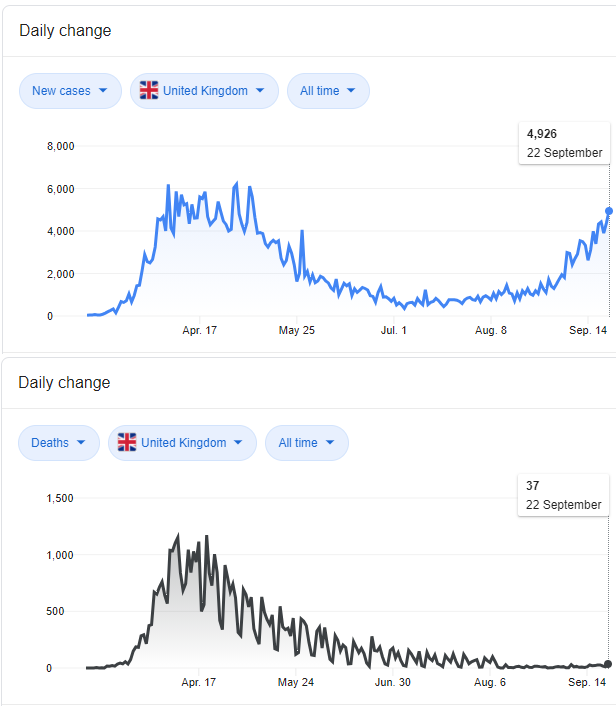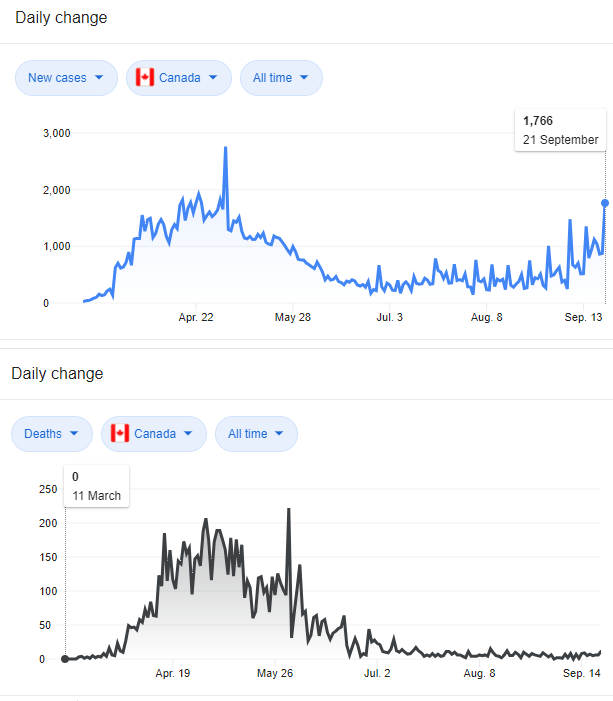
1/ #COVID19 is having a significant impact on prevalence of other common respiratory pathogens, like influenza.
Globally, since COVID began, influenza cases are down * 98% * (see tweet-link below).
The Canadian data and implications are explored here🧵

Globally, since COVID began, influenza cases are down * 98% * (see tweet-link below).
The Canadian data and implications are explored here🧵
https://twitter.com/kylamb8/status/1317186379483406337

2/ Guess what
Here in Canada, flu cases also *collapsed* when #COVID19 arrived
Since mid-April to today, lab-confirmed flu cases in Canada are: 154
Average of same the time-period in previous flu seasons?
*3,836*
(…despite increased flu testing)

Here in Canada, flu cases also *collapsed* when #COVID19 arrived
Since mid-April to today, lab-confirmed flu cases in Canada are: 154
Average of same the time-period in previous flu seasons?
*3,836*
(…despite increased flu testing)


3/ Here is an interesting visual
The 19/20 flu season (interrupted by #COVID19) vs. avg of ’16-‘19 flu seasons. # of cases and positivity % by week.
In 19/20, flu cases/positivity dive to near ZERO, whilst previous years the decline is (i) gradual, and (ii) never reaches zero.
The 19/20 flu season (interrupted by #COVID19) vs. avg of ’16-‘19 flu seasons. # of cases and positivity % by week.
In 19/20, flu cases/positivity dive to near ZERO, whilst previous years the decline is (i) gradual, and (ii) never reaches zero.

4/ It gets better
We are 7 wks into the 20/21 flu season
So far, there are *11* flu confirmed cases in Canada (vs. historical avg of 246)
They are all in Ontario
I repeat: there are no lab-confirmed cases of flu outside of Ontario this season
We are 7 wks into the 20/21 flu season
So far, there are *11* flu confirmed cases in Canada (vs. historical avg of 246)
They are all in Ontario
I repeat: there are no lab-confirmed cases of flu outside of Ontario this season
5/ Also…
According to FluWatch Canada data (bit.ly/3dKURr1)...
...there were 17 flu hospitalizations so far in last year’s flu season. This year ?
ZERO

According to FluWatch Canada data (bit.ly/3dKURr1)...
...there were 17 flu hospitalizations so far in last year’s flu season. This year ?
ZERO


6/ And we don’t even know which strains are circulating this year…
(this time last year we Canadian labs had already characterized 8 strains).

(this time last year we Canadian labs had already characterized 8 strains).


7/ What is happening with other respiratory viruses, such as RSV, parainfluenza, other coronaviruses, adenoviruses, etc.?
What are the positivity rates of those pathogens and the flu since #COVID19 arrived, compared to prior years?
Well…
Here you go:
What are the positivity rates of those pathogens and the flu since #COVID19 arrived, compared to prior years?
Well…
Here you go:

8/ Same chart again:
We that observe in the 26 weeks since #COVID19 arrived, we are approaching MINISCULE positivity rates for these other common pathogens, with positivity rates down 90%+ across the board.
(testing/surveillance is higher for all pathogens)
Simply staggering.

We that observe in the 26 weeks since #COVID19 arrived, we are approaching MINISCULE positivity rates for these other common pathogens, with positivity rates down 90%+ across the board.
(testing/surveillance is higher for all pathogens)
Simply staggering.


9/ Why is this not being talked about more, especially by public health officials, and why aren't journalists digging into this data and asking questions?
10/ So what does this all mean?
First: there are interesting *potential* healthcare system implications…
Influenza hospitalizations are ~12,000/year in Canada (see citations below).

First: there are interesting *potential* healthcare system implications…
Influenza hospitalizations are ~12,000/year in Canada (see citations below).


12/ *IF* (and that is a big *IF*) influenza circulates at a lower level this year, we may have more hospital capacity than we expect to deal with a potential next wave of #COVID19.
13/ Other questions come to mind (for others who are actually qualified to answer):
(1) Why are health officials/scientists/media not talking more about this? (this data is all from Health Canada)
(2) Can these pathogens recirculate again at historical levels despite decimation?
(1) Why are health officials/scientists/media not talking more about this? (this data is all from Health Canada)
(2) Can these pathogens recirculate again at historical levels despite decimation?
14/ …
(3) Obvious questions arise regarding flu vaccine policy?
(4) Are there implications for the human immune system if these viruses no longer circulate widely?
(5) What caused such dramatic declines in other pathogen circulation? Lockdowns/improved hygiene?
(3) Obvious questions arise regarding flu vaccine policy?
(4) Are there implications for the human immune system if these viruses no longer circulate widely?
(5) What caused such dramatic declines in other pathogen circulation? Lockdowns/improved hygiene?
15/ Continuing to follow influenza and other respiratory pathogen data will be important as we head into the late fall and winter, when infections typically pick up steam.
If they don’t, the questions become more relevant.
Thanks for reading. End.
If they don’t, the questions become more relevant.
Thanks for reading. End.
• • •
Missing some Tweet in this thread? You can try to
force a refresh


