Long some $PPSI @ 2.85
Tight stop @ $2.79 Image
$PPSI Sweeeeet! 17%🔥

Looking to scale out just under the 200sma Image
Time to get paid! #PayYourself

Sold 80% of my position here, leaving just a small batch to ride with a trail stop ✅🙂

Offer out at $3.97 ImageImage
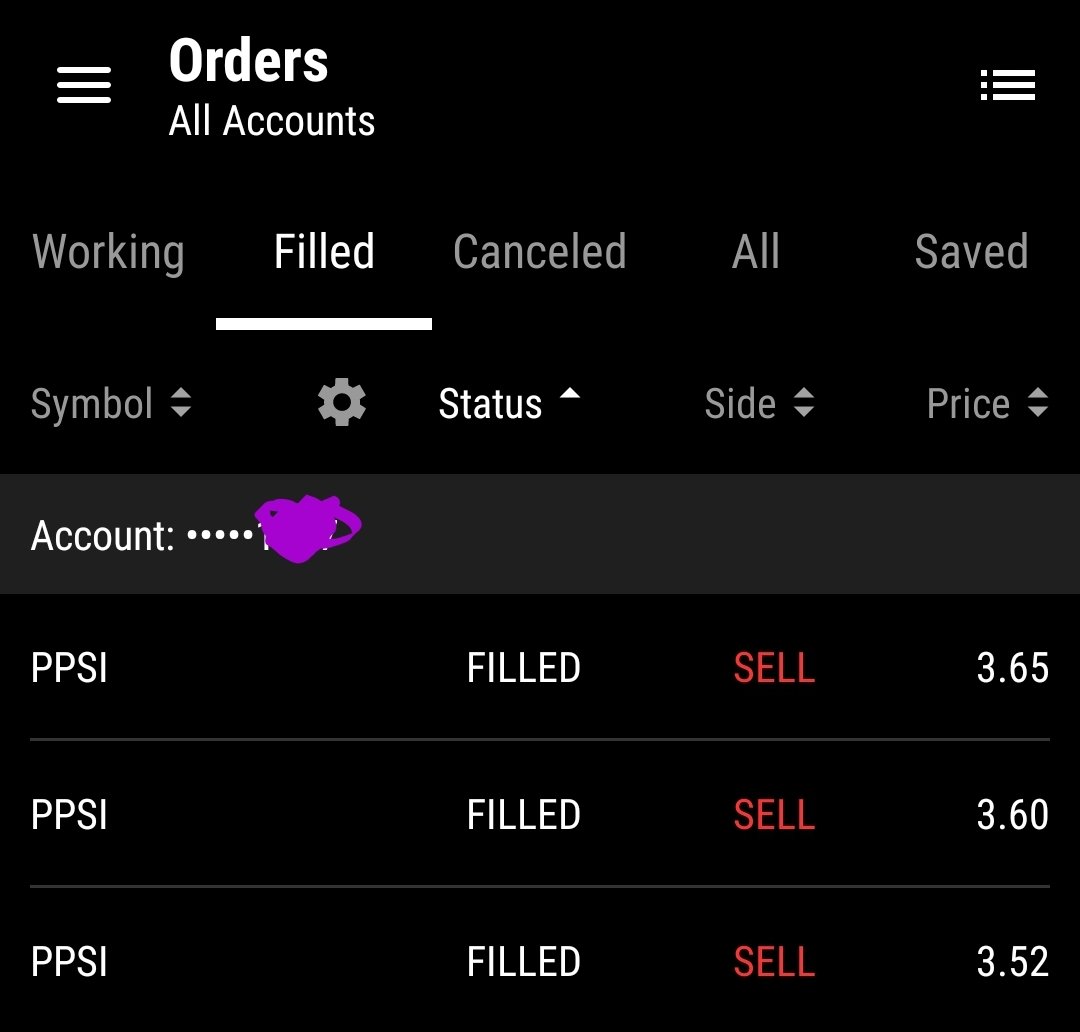
All out for a nice fat profit 💰
$PPSI

This one may continue to squeeze, but my job here is done unless another setup presents itself

#PayYourself Image
$PPSI is a perfect example of selling in to parabolic moves

#PayYourself no questions asked Image
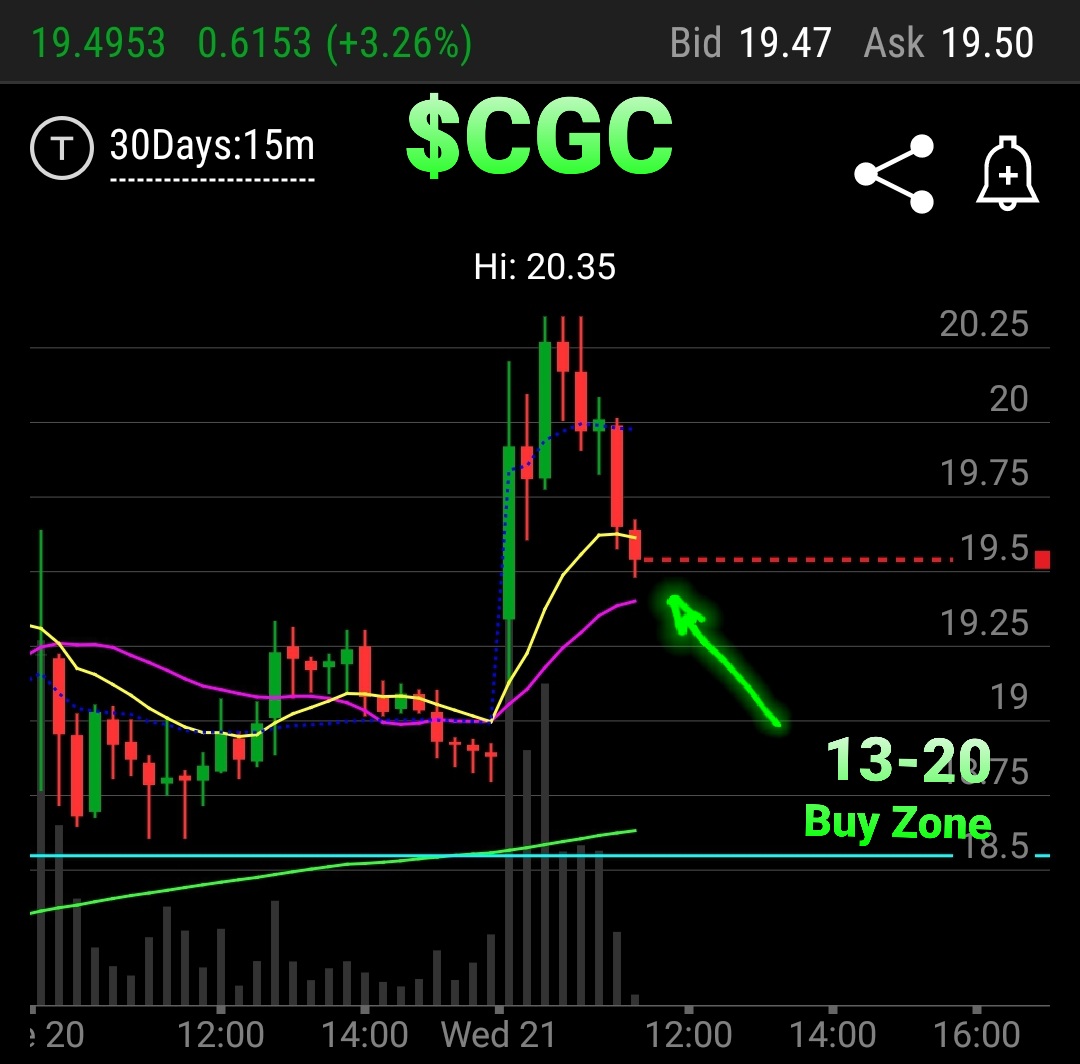
Bidding $3.03 for a possible quick flip in to the buy zone ✅

Smaller size this time, this stock has no catalyst it seems, the move was basically a short squeeze Image
Pulling my bid on this, taking too long, no fill Image

• • •

Missing some Tweet in this thread? You can try to force a refresh
 

Keep Current with Gustavo

Gustavo Profile picture

Stay in touch and get notified when new unrolls are available from this author!

Read all threads

This Thread may be Removed Anytime!

PDF

Twitter may remove this content at anytime! Save it as PDF for later use!

Try unrolling a thread yourself!

how to unroll video
  1. Follow @ThreadReaderApp to mention us!

  2. From a Twitter thread mention us with a keyword "unroll"
@threadreaderapp unroll

Practice here first or read more on our help page!

More from @TradeThePattern

22 Oct
Bought $HYLN here, speculative trade

No setup here, straight bottom fishing, I'm prepared to stop out no questions asked $22.67 break even stop ImageImage
$HYLN Sweeeet! Looking to sell any pop over $25 may or may not happen, considering the range i'll give it eoom

#ShortSqueeze 🔥 Image
Baam! $HYLN took profits on 80% of the position here 🔥

Leaving a small batch to ride just in case

Sell the rip, #PayYourself 💰 ImageImage
Read 4 tweets
21 Oct
1. New Traders:

It's natural to focus on "how much money you're going to make"

Which trade is going to make you that gain $$$

The money money money 💰💰

But your gains are burried in your losses

Let's approach this from the losing side

(THREAD) 👇
2. Our brain is naturally not wired for Stock Trading, so it takes time to rewire

Ever held to a losing trade and just couldn't let go till got worse?

Ever sell a stock too soon for fear that it may come back?

Ever turn a winning trade in to a losing trade?

These are FEARS
3.

-Fear of the unknown
-Fear coming from previous experiences
-Fear of missing out

That profit you took only to watch it go even higher after u sold

That stop loss you took only to watch it reverse

That big loss you were holding that reversed and u got bailed out
Read 6 tweets
21 Oct
Filled some $CGC In to the 13-20 Buy Zone

Keeping a tight leash on it ✅ ImageImage
$CGC hard stop set $19.50 @ break even

Not a lot of follow through on setups today it seems, very choppy

It either goes or it doesn't

I ♥️ Break Even Stops 🙂 Image
Borderline about to get stopped out on $CGC

And that's completely ok, not a lot of follow through on setups today

Know when to scale back activity

Protect capital should be #1 Image
Read 4 tweets
20 Oct
RSI is not a buy and sell indicator ❌

-Relative Strength Index
keyword = Strength

A stock can remain Overbought or Oversold indefinitely

You don't need RSI to tell you OB/OS

When the distance between Price, 20sma & 200sma become equal, you're getting close to OB/OS Image
Buying or selling on the mere fact that RSI is overbought or oversold will eventually get you a Net Loss, the probabilities will eventually catch up.

Price, Volume and key Moving averages will do the job

Keep it simple 👌

#Trading #Stocks $JKS
$PTON is one of many examples

If you sold on the mere fact that RSI went over 70 and waited for it to become oversold to get back in..

You missed the entire run Image
Read 4 tweets
29 Apr
How to gauge risk for a complete newbie: #Stocks

If you've hesitating, second guessing or wondering where it is a good price to enter a stock while keeping risk low ect.. .

Here is a simple method you can use to gauge risk.

I will keep it very simple, so lets go!

Thread 👇
First thing is first, make the 20sma and the 200sma (simple moving average) your friend.

What a moving average does, it simply smooths out the direction of price over the last 200 candles or 20 candles on a chart:

It is as simple as that
To keep this simple, we'll be using the 20sma (pink)

keep this in mind: Price will always return to its moving average, whether through price or time.

Using $SDC as an example, anytime price has moved away from it's 20, it eventually magnets back to the 20 sma
Read 9 tweets

Did Thread Reader help you today?

Support us! We are indie developers!


This site is made by just two indie developers on a laptop doing marketing, support and development! Read more about the story.

Become a Premium Member ($3/month or $30/year) and get exclusive features!

Become Premium

Too expensive? Make a small donation by buying us coffee ($5) or help with server cost ($10)

Donate via Paypal Become our Patreon

Thank you for your support!

Follow Us on Twitter!