
It is getting tiresome watching media, government, and other Twitter folks present erroneous numbers for certain states’ #Covid19 positive testing percentage.
Many of the Johns Hopkins percentages are flat wrong, and it's the denominator problem (again).
🧵THREAD🧵
1/
Many of the Johns Hopkins percentages are flat wrong, and it's the denominator problem (again).
🧵THREAD🧵
1/
First, it’s important to know that these aren’t "Johns Hopkins' numbers." Their testing data is from @COVID19Tracking, who gets it from state websites.
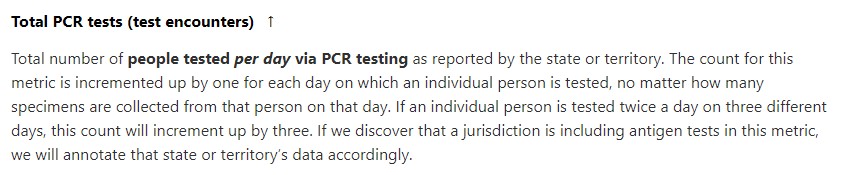
But there are 3 options from which to choose the test number. Here are the definitions of each, in CTP’s priority order:
2/
But there are 3 options from which to choose the test number. Here are the definitions of each, in CTP’s priority order:
2/
1. "Encounters"
CTP's definition:
3/
CTP's definition:
3/
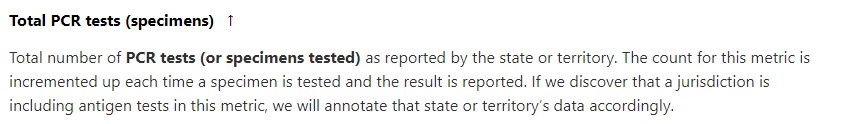
2. "Specimens"
CTP's definition:
4/
CTP's definition:
4/
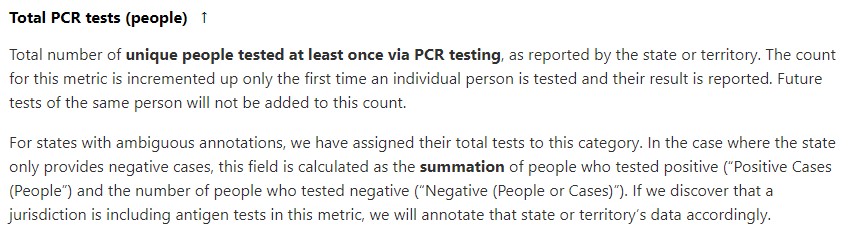
3. "People"
CTP's definition:
5/
CTP's definition:
5/
“Encounters” is the preferred metric because it omits intra-day serial testing, but does not disqualify those who have tested previously.
Joe gets tested 3 times today? That counts as 1.
Joe got tested in April, June, and October? Those each count as 1.
Simple.
6/
Joe gets tested 3 times today? That counts as 1.
Joe got tested in April, June, and October? Those each count as 1.
Simple.
6/
“Specimens” is the next best metric. It counts intra-day serial testing as separate tests, and does not bar those tested once from ever counting again.
Joe gets tested 3 times today? That counts as 3.
Joe got tested in April, June, and October? Those each count as 1.
7/
Joe gets tested 3 times today? That counts as 3.
Joe got tested in April, June, and October? Those each count as 1.
7/
“People” is least preferred. Once tested a single time—ever—someone no longer counts in this metric (except if positive, I believe).
Joe got tested in April, June, and October? Counts as 1 test *in April*.
Joe gets tested 3 times today? Nope, he already tested 6 months ago!
8/
Joe got tested in April, June, and October? Counts as 1 test *in April*.
Joe gets tested 3 times today? Nope, he already tested 6 months ago!
8/
For a good example of the disparity in the different metrics, let’s look at North Dakota, which reports all 3 and so makes for a good test case:
North Dakota has had 5,604 cases for the week ending yesterday. There’s our numerator.
Here are our potential denominators...
9/
North Dakota has had 5,604 cases for the week ending yesterday. There’s our numerator.
Here are our potential denominators...
9/
Encounters: 49,376
Specimens: 52,095
People: 11,741 (!)
Anyone spot the outlier? But why so low? Because 36.3% of ND’s population has been tested before and will never count again. In the last week, 37,635 people who took tests *would not count*.
Let’s run the numbers...
10/
Specimens: 52,095
People: 11,741 (!)
Anyone spot the outlier? But why so low? Because 36.3% of ND’s population has been tested before and will never count again. In the last week, 37,635 people who took tests *would not count*.
Let’s run the numbers...
10/
% Positive using Encounters: 11.3% (This is what Johns Hopkins reports for ND)
% Positive using Specimens: 10.8%
% Positive using People: 47.8%
One of those looks a bit worse to me—and this is the way Johns Hopkins reports 16 states!
11/
% Positive using Specimens: 10.8%
% Positive using People: 47.8%
One of those looks a bit worse to me—and this is the way Johns Hopkins reports 16 states!
11/
Here are the states that JHU reports using the “People” metric:
AL, AZ, FL, IA, ID, KS, LA, NE, NV, OR, PA, SD, UT, VT, WI, WY
Some of this is on the states, since some states *only* post the People number (which is absolutely wild).
Those states? AL, AZ, IA, LA, OR, & VT
12/
AL, AZ, FL, IA, ID, KS, LA, NE, NV, OR, PA, SD, UT, VT, WI, WY
Some of this is on the states, since some states *only* post the People number (which is absolutely wild).
Those states? AL, AZ, IA, LA, OR, & VT
12/
10 states do report one of the other metrics, yet are still being reported with the People denominator by JHU. Why? Likely because @COVID19Tracking still hasn’t changed the number in their spreadsheet column titled “totalTestResults” to reflect Encounters or Specimens.
13/
13/
Compare the yellow highlighted states (DE, FL & ID) with the green ones (IN & MA). The “totalTestResults” field uses “totalTestsViral” (which is Specimens) for the green, but uses “totalTestsPeopleViral” (which is People) for the yellow.
14/
14/
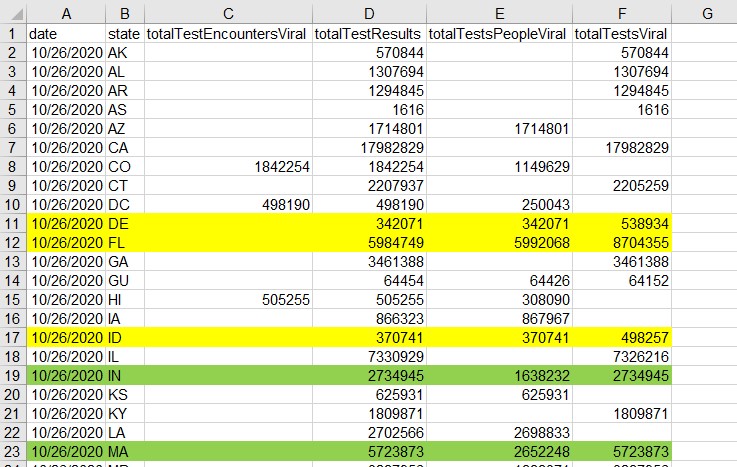
Most data gatherers (like myself) use the “totalTestsViral” field to update their testing numbers. I’m betting that’s exactly what Johns Hopkins does. But CTP has not yet moved the Specimens or Encounters data to that column for several states.
15/
15/
A few rogue states also do things their own way: FL, KS, and MS among them. MS lately just decided to stop updating its test count, which is why you might’ve seen a 100% positive from them recently. KS hides its specimen data a bit. FL provides a lot of data, but spread out.
16/
16/
If we fixed the column issue, we would see the following percentages:
[STATE: JHU % ➡️True %]
DE: 7.4% ➡️ 3.7%
ID: 35.6% ➡️ 18.0%
NE: 21.5% ➡️ 7.7%
NV: 19.0% ➡️ 8.4%
PA: 11.3% ➡️ 5.1%
SD: 40.3% ➡️ 15.6%
UT: 18.6% ➡️ 11.5%
WI: 28.0% ➡️ 12.5%
WY: 30.5% ➡️ 10.1%
17/
[STATE: JHU % ➡️True %]
DE: 7.4% ➡️ 3.7%
ID: 35.6% ➡️ 18.0%
NE: 21.5% ➡️ 7.7%
NV: 19.0% ➡️ 8.4%
PA: 11.3% ➡️ 5.1%
SD: 40.3% ➡️ 15.6%
UT: 18.6% ➡️ 11.5%
WI: 28.0% ➡️ 12.5%
WY: 30.5% ➡️ 10.1%
17/
There are still some very high percentages above, of course, but not the eye-popping 30%+ absurd numbers that intelligent people just blast out there as if they couldn’t be bothered to check if this is an apples-to-apples comparison.
Frustrating, to say the least.
18/
Frustrating, to say the least.
18/
So next time someone uncritically tells you that Idaho is over 1/3 positive, or SD is over 40%, or even "What's up with Pennsylvania and Florida in double-digits?", kindly redirect them to this thread.
19/
19/
*Follow Up*
@COVID19Tracking has updated their FL reporting, so Johns Hopkins ought to follow suit soon (maybe tomorrow):
@COVID19Tracking has updated their FL reporting, so Johns Hopkins ought to follow suit soon (maybe tomorrow):
https://twitter.com/COVID19Tracking/status/1321227308342988801?s=20
Indeed, JHU has updated Florida's positive percentage. From double-digits to 5% in one day flat (see pic)!
25-30% of states to go (and again, much of this is on the states!).
25-30% of states to go (and again, much of this is on the states!).

• • •
Missing some Tweet in this thread? You can try to
force a refresh


