On Thursday, @BEA_News will release its preliminary estimate for third-quarter economic growth. Given the timing, it's going to get a ton of attention. It also has the potential to be VERY misleading.
So! Time for a thread on the numbers and how the Times will be covering them:
So! Time for a thread on the numbers and how the Times will be covering them:
I also covered much of this in the Times this morning: nytimes.com/2020/10/27/bus…
And here's our story ahead of the Q2 report: nytimes.com/2020/07/29/bus…
And here's our story ahead of the Q2 report: nytimes.com/2020/07/29/bus…
First off: Growth in Q3 was almost certainly the fastest on record. Forecasts expect a gain of around 7-8% from Q2 (30-35% annualized -- more about that in a bit). That's roughly 2x the 3.9% growth in the current "best quarter ever," Q1 of 1950.
BUT...
BUT...
... you CANNOT look at Q3 in isolation. GDP plummeted 9% in Q2 (by far the biggest contraction on record). Q3 is an echo of that. We shut down a big part of the economy, then opened it back up -- both a big drop and a big rebound were inevitable.
(Quick aside: We can debate exactly how big a drop was inevitable and how big a rebound was possible with the right policies. But note that even countries that have been praised for their success with the virus like S. Korea saw big initial contractions in their economies.)
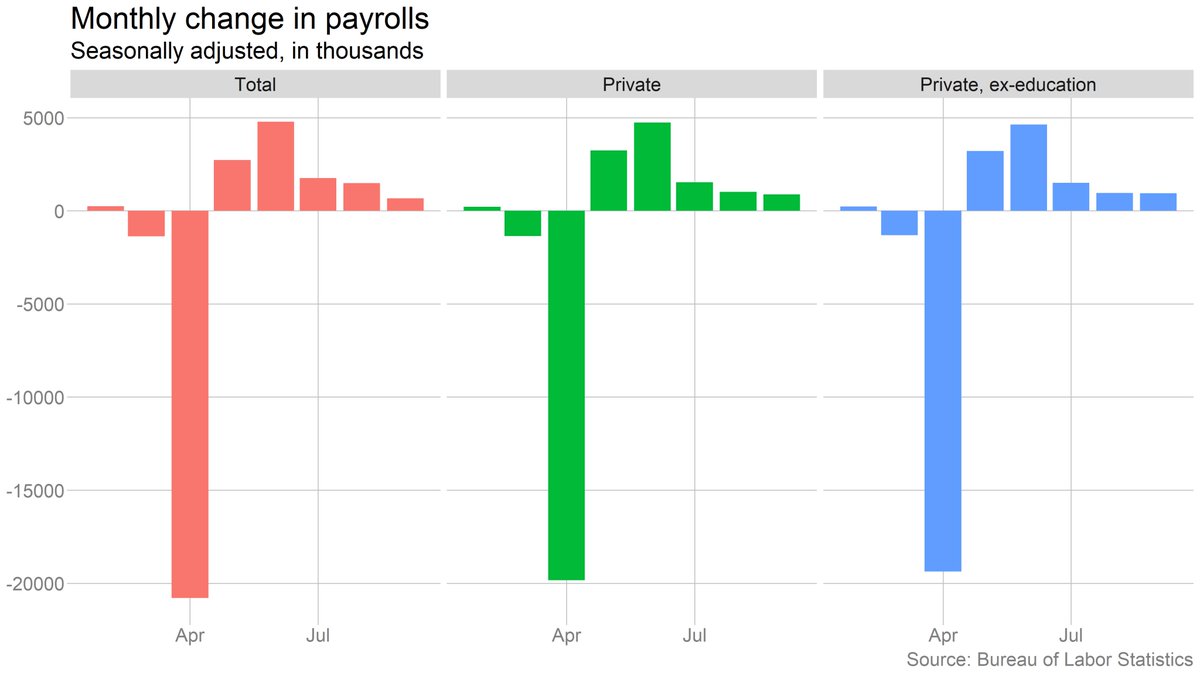
But this is key: The rebound has *not* been as steep as the drop. If Q3 comes in as expected, the economy will still be 2-3% smaller than in Q1 and 3-4% smaller than before the pandemic (Q4 2019). 
For context, GDP contracted 4% over the entire Great Recession. So even after the record-setting rebound in Q3, we are *still* in a Great Recession-sized hole.
Math interlude #1: If the economy shrinks 9% and then grows 7%, it might sound like we're almost all the way back. But that's wrong! The decline in Q2 means the rebound is being measured against a smaller base.
Same concept: If you start with $100 and lose 50%, you have $50. If you then increase your holdings by 50%, you have $75, not $100. To fully offset a 50% drop, you need a 100% rebound.
Still, there is no question that the economy has come a long way since the spring. The trouble is, the rebound is slowing.
In fact, despite the big headline number, growth *during* the third quarter looks to have been quite weak.
How is that possible? Time for...
In fact, despite the big headline number, growth *during* the third quarter looks to have been quite weak.
How is that possible? Time for...
Math interlude #2: Fun with quarterly averaging!
When the BEA says GDP was $19 trillion in the fourth quarter, it means production averaged $19 trillion* over the three months of the quarter.
* Technically, a seasonally adjusted annual rate of $19 trillion.
When the BEA says GDP was $19 trillion in the fourth quarter, it means production averaged $19 trillion* over the three months of the quarter.
* Technically, a seasonally adjusted annual rate of $19 trillion.
In normal times, the economy moves slowly, so GDP in March doesn't look that different from GDP in January. Averaging them together is fine.
But of course the pandemic blew all of that up.
But of course the pandemic blew all of that up.
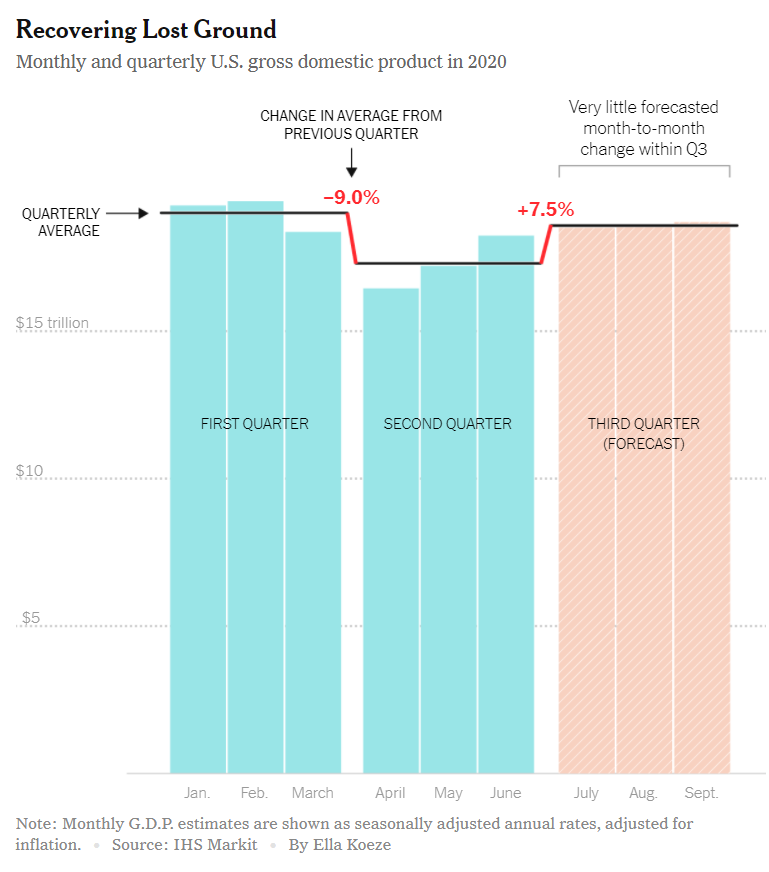
After a pretty normal Jan/Feb, GDP plunged 5% in March and 10% in April, before rebounding 5% in May and 6% in June. (All these numbers from @EconomicsRisk.) But quarterly averages obscure all of that movement.
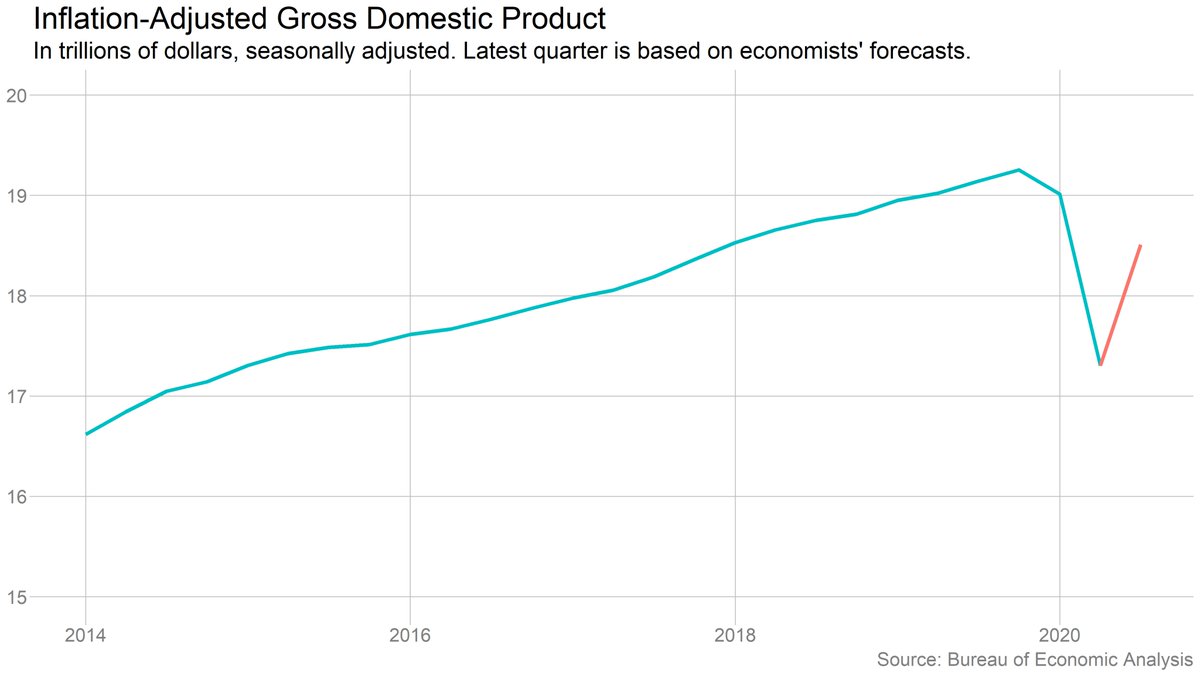
Monthly GDP growth during the third quarter was pretty weak. IHS puts it at 1.5% in July and under 1% in both August and September. But that big May/June rebound means the third quarter had a huge head start.
In fact, even if there had been NO growth in July/Aug./Sept., third-quarter GDP would have risen more than 5% from Q2. That would be the best quarter on record!
This gorgeous @ellawinthrop graphic does a great job illustrating how the big gains in May/June paved the way for a strong third quarter even with weak monthly growth.
One last bit of numbers nerdery: I said above the GDP probably increased 7-8% in Q3. But the press release from @BEA_News will probably say it rose at a rate of 30-35%. That's because the government reports these numbers as *annual rates.*
I did a long thread on this back in July, so I won't repeat it all here. But the key point is that annual rates can be very misleading. A casual reader might think the economy grew by a third, when it grew by less than a tenth.
https://twitter.com/bencasselman/status/1288460034582745088
Therefore, in our coverage, @nytimes will be emphasizing the simple, non-annualized percent changes. We'll highlight both the quarter-to-quarter change (how much the economy bounced back in Q3) and the change from Q4 (how big a hole we're in relative to before the pandemic).
Note that we did the same thing in Q2. Other news organizations can make their own choices, but I agree with @Brett_Matsumot0 that consistency matters here. Changing approaches now risks looking politically motivated (even if it isn't).
https://twitter.com/Brett_Matsumot0/status/1320895303311085573
One final note: Remember that these GDP figures are aggregates. That's always important, but especially now, when some people have been mostly spared (at least economically) by the crisis and others have lost everything. Even a big gain in GDP doesn't mean everyone is benefiting.
Fin! Check out my story, with comments from @JustinWolfers & Bern Herzon of @EconomicsRisk at the link. And see you all bright and early on Thursday!
nytimes.com/2020/10/27/bus…
nytimes.com/2020/10/27/bus…
• • •
Missing some Tweet in this thread? You can try to
force a refresh