Covid (@UCSF) Chronicles, Day 224
1/ When I walk or drive around SF, I see evidence of why Covid cases & deaths are the lowest of any big city in the U.S. Masking is near universal, Ubers & Lyfts have their windows wide open, & there are pop-up outdoor eating spaces everywhere.
1/ When I walk or drive around SF, I see evidence of why Covid cases & deaths are the lowest of any big city in the U.S. Masking is near universal, Ubers & Lyfts have their windows wide open, & there are pop-up outdoor eating spaces everywhere.
2/ So, as we enter a 3rd wave that's blanketing the nation, I’ll focus today on San Francisco – specifically the question of whether SF can continue its remarkable Covid success in the face of a national surge, one far more geographically distributed than the prior two waves. 

3/ I’ll go out on a limb and say yes… and hope that I’m not proven wrong.
History is with us: when all of California began to surge in June, SF was able to turn it around – whereas much of the rest of CA didn’t and was hit far harder. Ditto for the southern states.
History is with us: when all of California began to surge in June, SF was able to turn it around – whereas much of the rest of CA didn’t and was hit far harder. Ditto for the southern states.
4/ Before doing a deep dive into the current situation in SF, first a brief overview of the U.S. picture. Bottom line: we’re seeing big surges nearly everywhere. This is different from March-April, which was mostly Northeast; & June-July, which was mostly the South, plus SoCal.
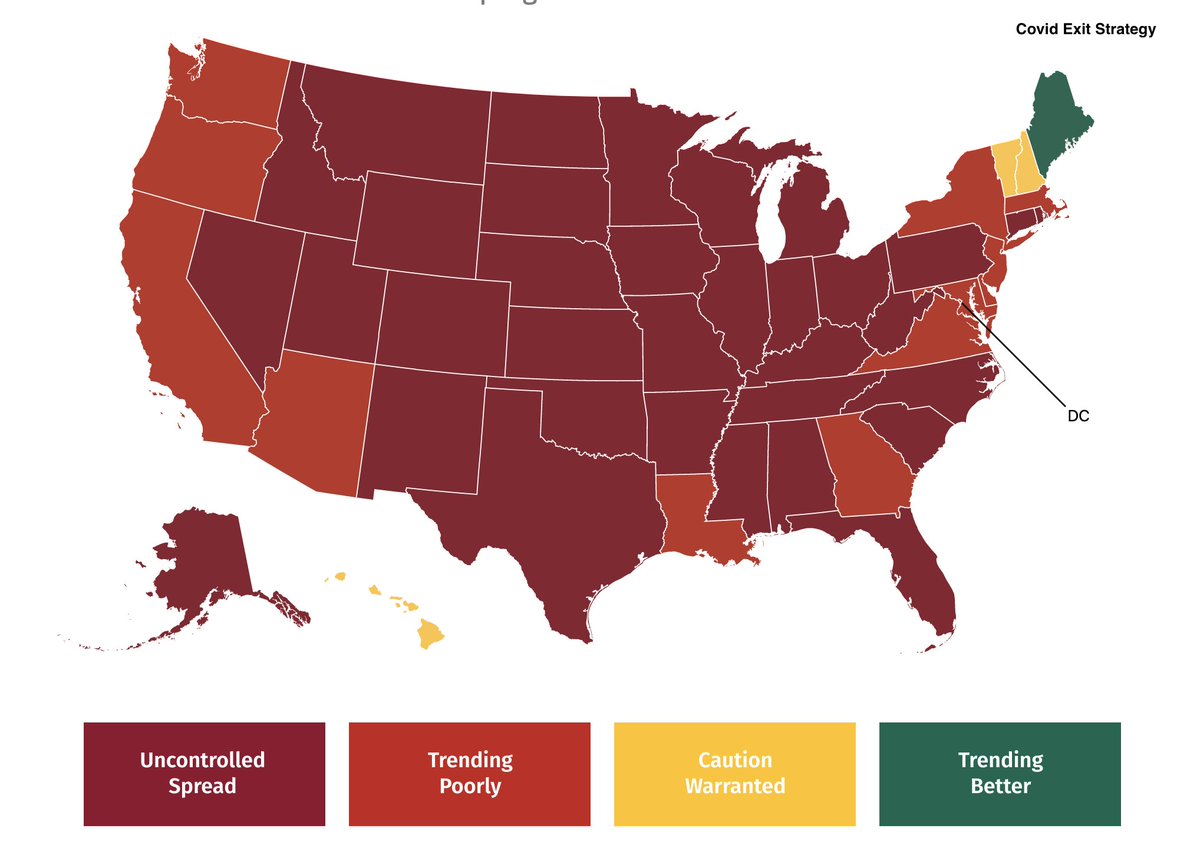
5/ Yes, the upper Midwest is getting hit the hardest (which may be electorally meaningful, in that many of these states also happen to be swing states). But all regions of the country are heading in the wrong direction.

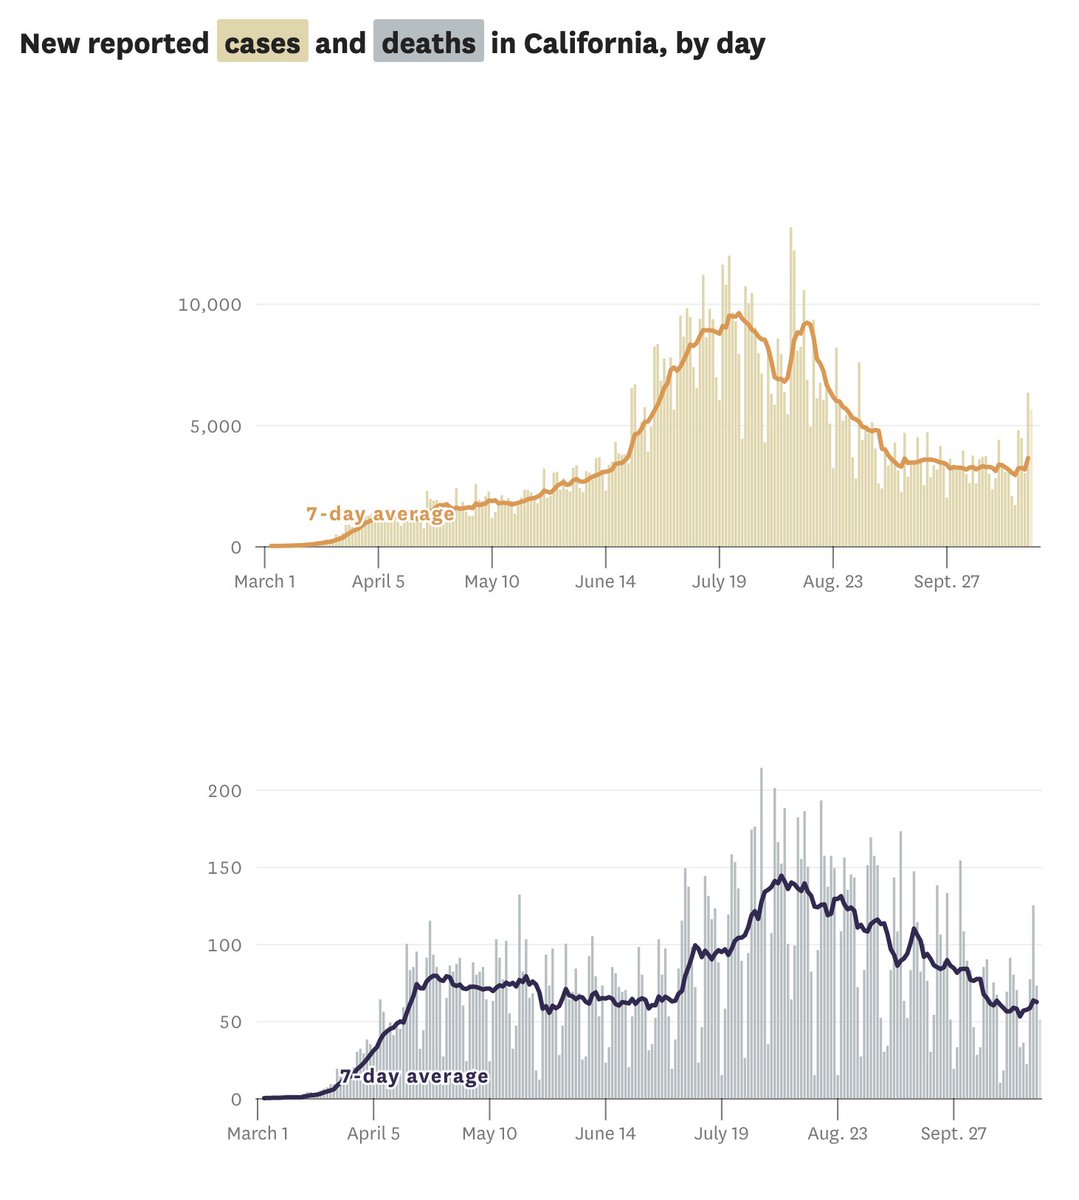
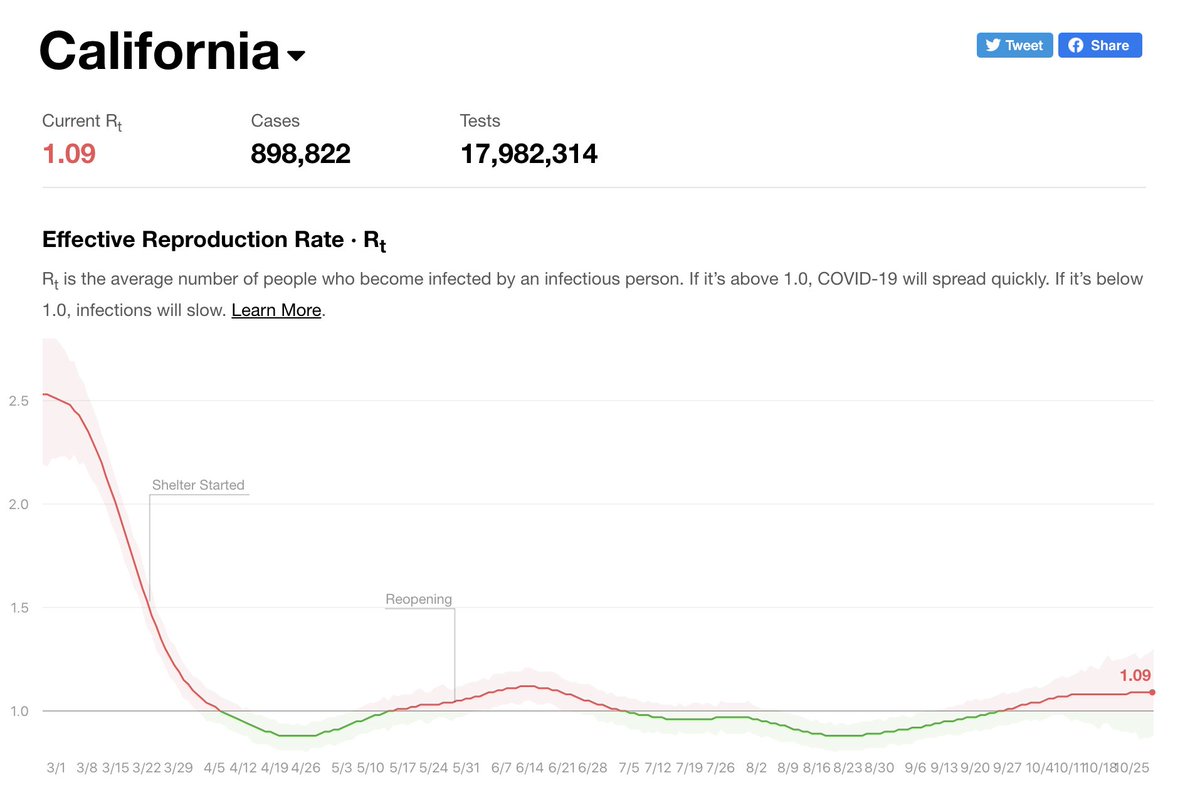
6/ And CA is starting to get hot as well – graphs on L (@sfchronicle) show small but meaningful uptick in cases in past wk. On R (from Rt.live): CA’s reproduction # , previously <1, now up to 1.09. While not as bad as the Midwest, it’s concerning & may get worse.
7/ Now, let’s zoom in on Northern CA. The nine counties that make up the Bay Area are seeing a smaller but potentially meaningful bump up in cases. The death curve is a bit bouncy, but one gets the sense of a small uptick here too.

8/ Finally, let’s home in on San Francisco. As this piece from yesterday's @latimes describes, SF remains a bright light among the largest U.S. cities tinyurl.com/y5vc75pj. I’ll start the SF update with the view from @UCSFHospitals, and then broaden the lens to all of SF.
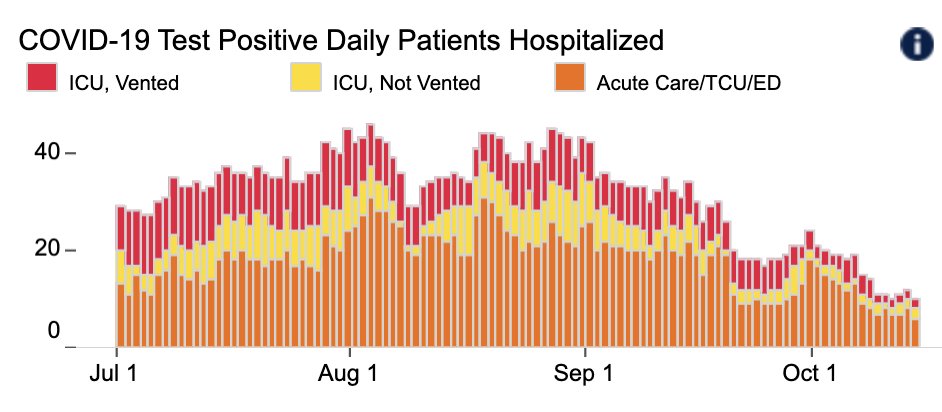
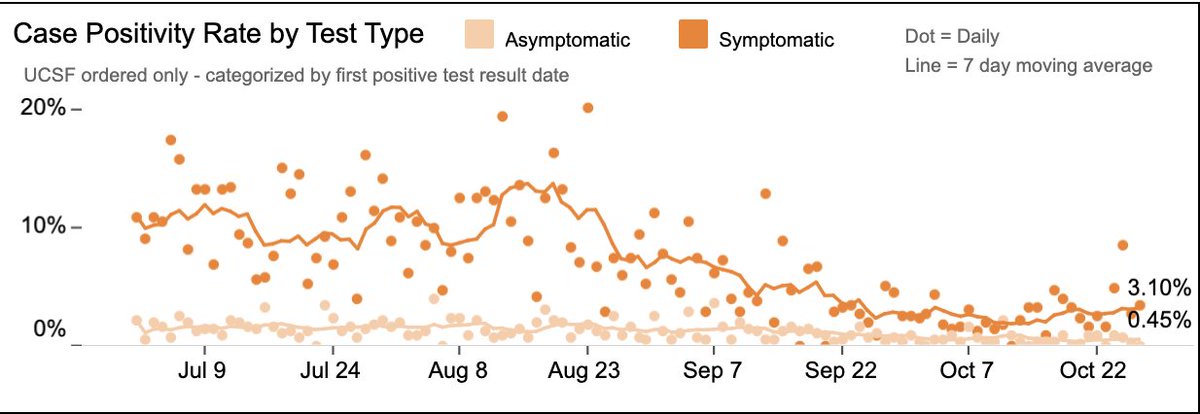
9/ @UCSFHospitals, we’re up to 15 pts, only 4 in the ICU & one on a ventilator (Fig). This is a meaningful bump since last week, when we went as low as 9 hospitalized pts. Worrisome. On the other hand, our test positivity rate has remained quite low: 2.4% overall, comprised of…

10/ … 3.1% for patients w/ symptoms consistent w/ Covid, and 0.45% in patients w/o symptoms (such as pts admitted for procedures). You may recall that I use the latter % to estimate the chances that someone near me in the supermarket has Covid. At 1-in-220, it feels pretty safe.
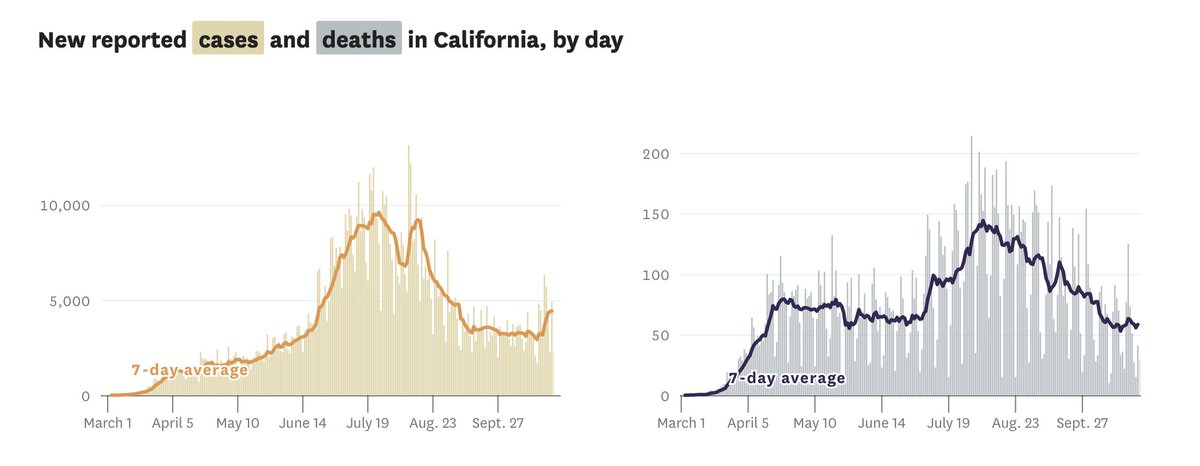
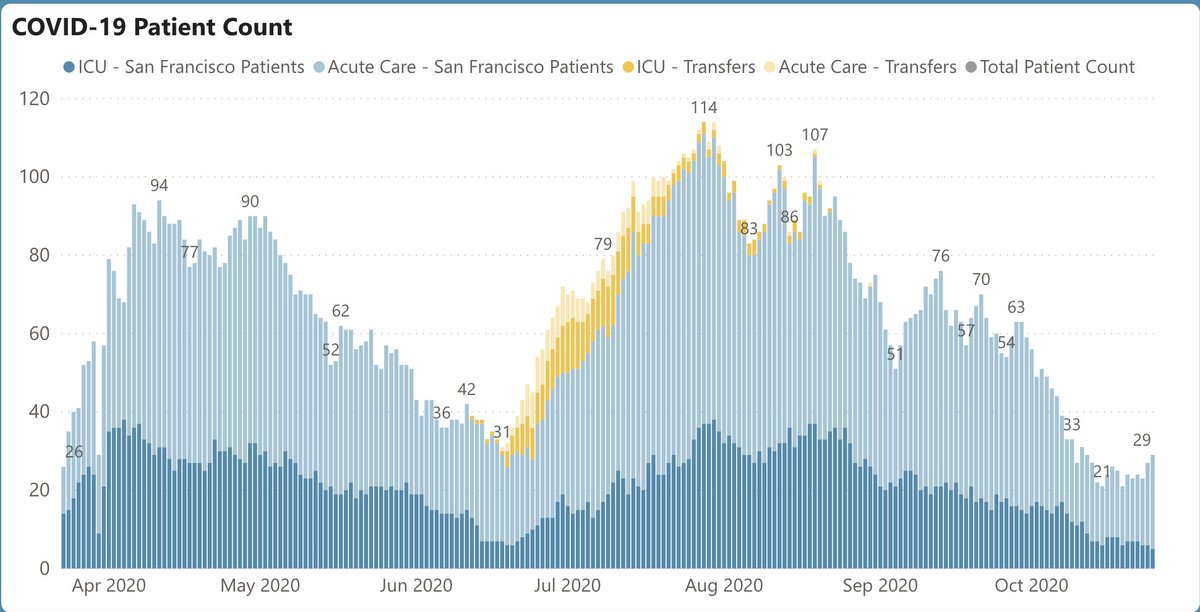
11/ So the uptick in hospital pts @UCSF is a bit concerning, but the low test + rate is reassuring. How about SF overall? That too is comforting, especially considering what we’re seeing elsewhere. Cases averaging 32/day, stable for past wk & well below our July-Aug peak of 130.

12/ In all of SF, we’ve had 140 Covid deaths so far. As I’ve said, this is simply astounding, representing 16 deaths/100,000 people. If the entire U.S. had that per capita death rate, we’d have had 52K deaths, rather than 226K. In other words, 174,000 people would be alive today.
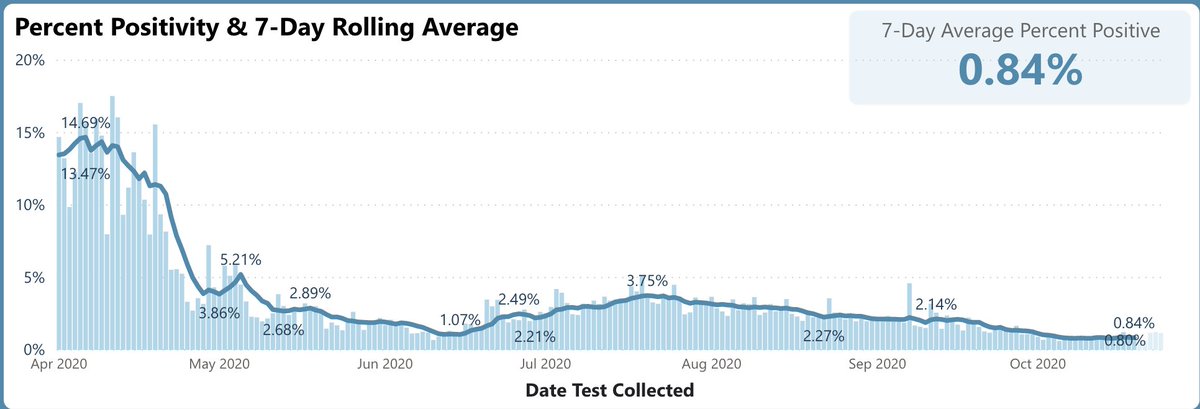
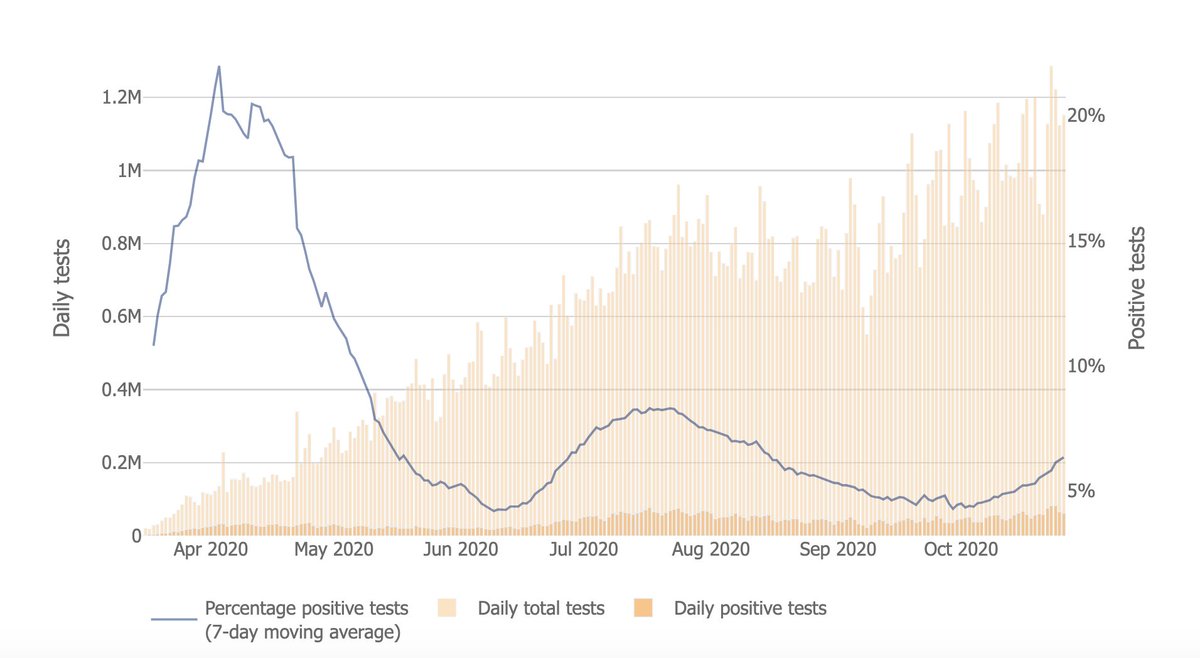
13/ Like @UCSF, SF’s test positivity rate remains blessedly low: 0.84% (Fig L). This compares to CA's rate of 3.2% (still pretty stable), & national average (Fig R), which has ticked up to 6.3% from the mid-4’s a few weeks ago. Some Midwestern states are in the 20-30% range.
14/ Hospital # 's in SF also reassuring: 29 total, up just a bit from low 20s 2 wks ago. So rather than the rise in UCSF hospitalizations indicating a SF trend, it looks like UCSF is getting a larger share; now ~50% of SF’s hospital Covid pts (vs ~25% in summer). Reason: unclear.
15/ Taken as a whole, it looks like CA is doing fairly well compared to the hardest-hit states, though we’re seeing the early signals of a surge. And San Francisco is doing better than that – avoiding this surge, at least so far. It’s far too early to declare victory. In fact…
16/ … it seems unlikely that – with the amount of intra- & interstate travel – that SF can totally dodge the impact of a national wave, even if the Mayor and public health leaders continue to do the right things, and the people remain vigilant and follow the public health rules.
17/ The latter point is key: more and more real-world data is demonstrating the tight connection between mask-wearing and preventing Covid. This graph, from @washingtonpost, shows the inverse relationship between mask wearing and cases. It’s just not that complicated: masks work.

18/ I remain confident that SF will continue to “dance” effectively, per the “Hammer and the Dance” metaphor tinyurl.com/yx27etx9. While I’ve heard many explanations (warm-ish weather, relatively little poverty, more tech) and all of them may contain a grain of truth…
19/ … the most compelling explanation is that San Francisco's numbers reflect what happens when you have strong political, public health and corporate leadership, and residents who believe in science and in keeping themselves, and their fellow human beings, safe.
20/ The current surge is proving, again, that there's nothing about the virus that’s changed in 8 months, and – for the 90% of us who haven't been infected – nothing about us or our mucosal membranes that’s changed either. SF continues to prove that the virus can be contained,...
21/ … making the new (or newly articulated, at least) White House policy of surrender and herd immunity all the more immoral.
• • •
Missing some Tweet in this thread? You can try to
force a refresh