New paper showing very high household transmission of COVID-19 in US. I haven't seen detailed summary, so here's one. There's a ton here to think about. Kids, culture, COVID.
Thread.
cdc.gov/mmwr/volumes/6…
Thread.
cdc.gov/mmwr/volumes/6…
Background
Transmission of SARS-CoV-2 occurs primarily through sustained close contact. Certainly there are rarer more distant spreading events, but study after study shows that close contacts have an order of magnitude higher chances of becoming infected.
Transmission of SARS-CoV-2 occurs primarily through sustained close contact. Certainly there are rarer more distant spreading events, but study after study shows that close contacts have an order of magnitude higher chances of becoming infected.
In case you want refs for this very well supported claim, here's a couple (& some data):
wwwnc.cdc.gov/eid/article/26…
thelancet.com/action/showPdf…
wwwnc.cdc.gov/eid/article/26…
thelancet.com/action/showPdf…
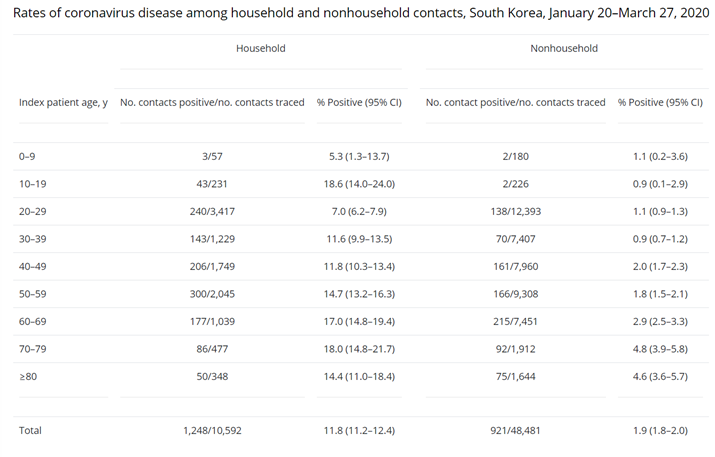
So we know household transmission is much higher than non-household transmission, but what is the attack rate (chance of household member becoming infected if one member does)?
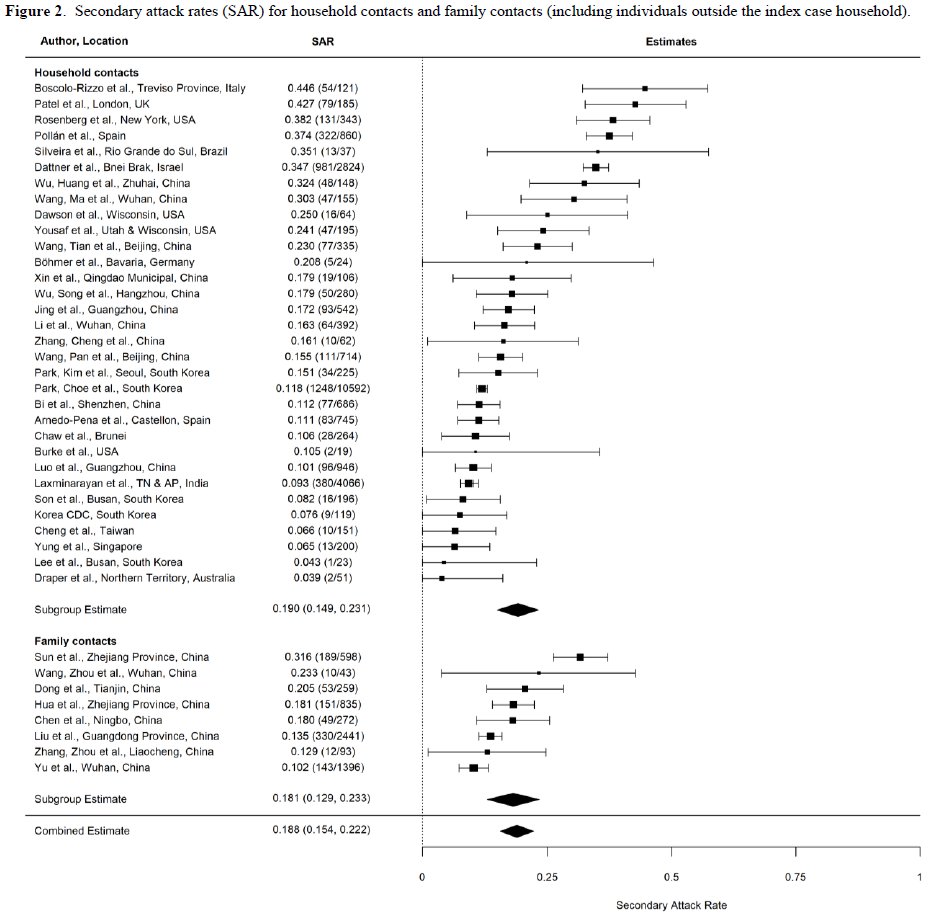
A recent meta-analysis by Zack Madewell @nataliexdean estimated it to be 18.8%.
medrxiv.org/content/10.110…
A recent meta-analysis by Zack Madewell @nataliexdean estimated it to be 18.8%.
medrxiv.org/content/10.110…

So why should we be interested in a single new study w/ moderate sample size (191 contacts of 101 index cases)?
B/c there is a huge amount of variability around 18.8% estimate (4%-45%) & few studies from US. Cultural diffs could lead to very different household attack rates.
B/c there is a huge amount of variability around 18.8% estimate (4%-45%) & few studies from US. Cultural diffs could lead to very different household attack rates.
Study Design:
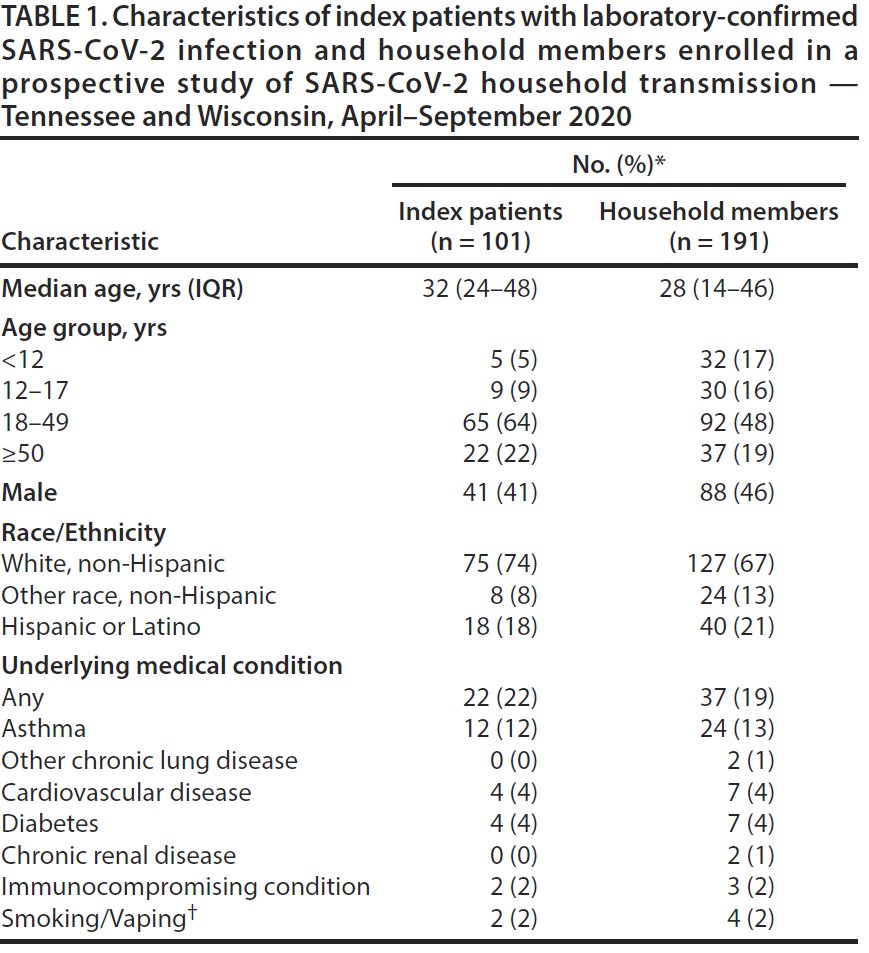
191 non-symptomatic family members of 101 symptomatic COVID-19 cases were enrolled in study 4d (median) after symptom onset of index case & self-collected nasal swabs & saliva samples daily for next 7d & kept symptom diary.
191 non-symptomatic family members of 101 symptomatic COVID-19 cases were enrolled in study 4d (median) after symptom onset of index case & self-collected nasal swabs & saliva samples daily for next 7d & kept symptom diary.
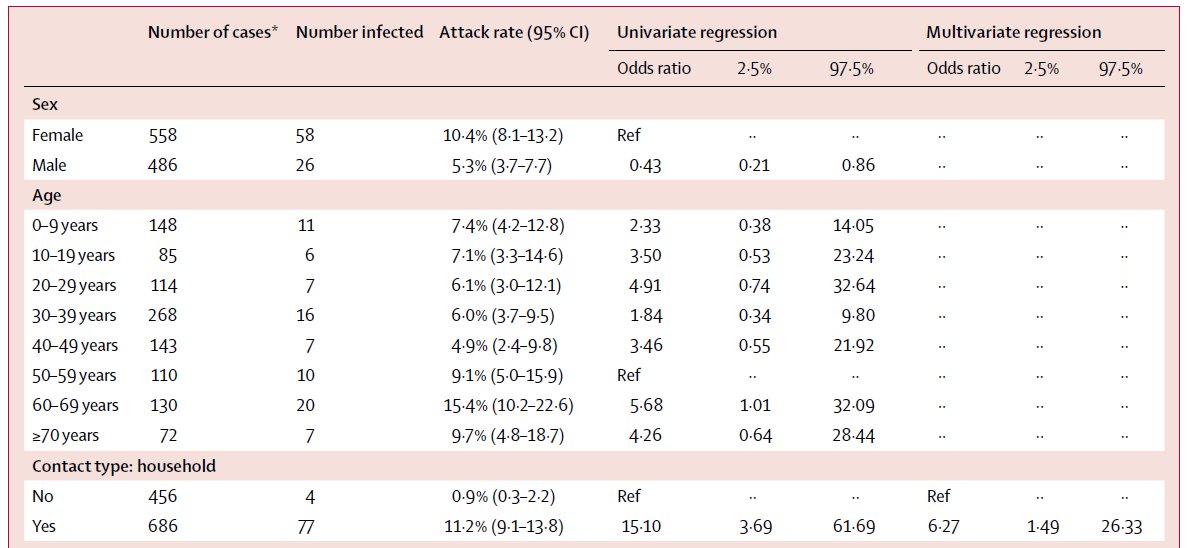
What did they find? 5 key results:
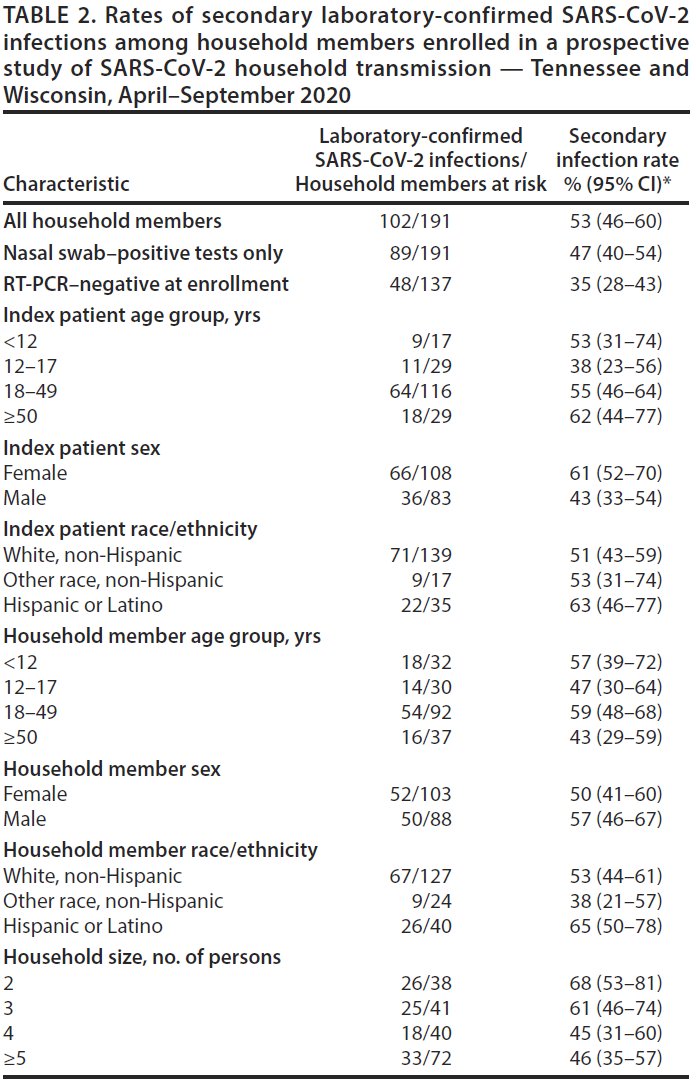
1 Overall secondary attack rate (SAR) 53% high! Higher than all 40 studies in meta-analysis above.
2 SAR similar across ages of index cases!
3 SAR similar across ages of contacts!
4 SAR higher for female index cases.
5 SAR dec. w/ household size
1 Overall secondary attack rate (SAR) 53% high! Higher than all 40 studies in meta-analysis above.
2 SAR similar across ages of index cases!
3 SAR similar across ages of contacts!
4 SAR higher for female index cases.
5 SAR dec. w/ household size
Lots to explain & many caveats.
1st, as in ALL studies of this type, index case identified as 1st person w/ symptoms in household. Is this the actual index case & could there be >1 in household? We can't know w/out more info. Bummer b/c authors have info to address this!
1st, as in ALL studies of this type, index case identified as 1st person w/ symptoms in household. Is this the actual index case & could there be >1 in household? We can't know w/out more info. Bummer b/c authors have info to address this!
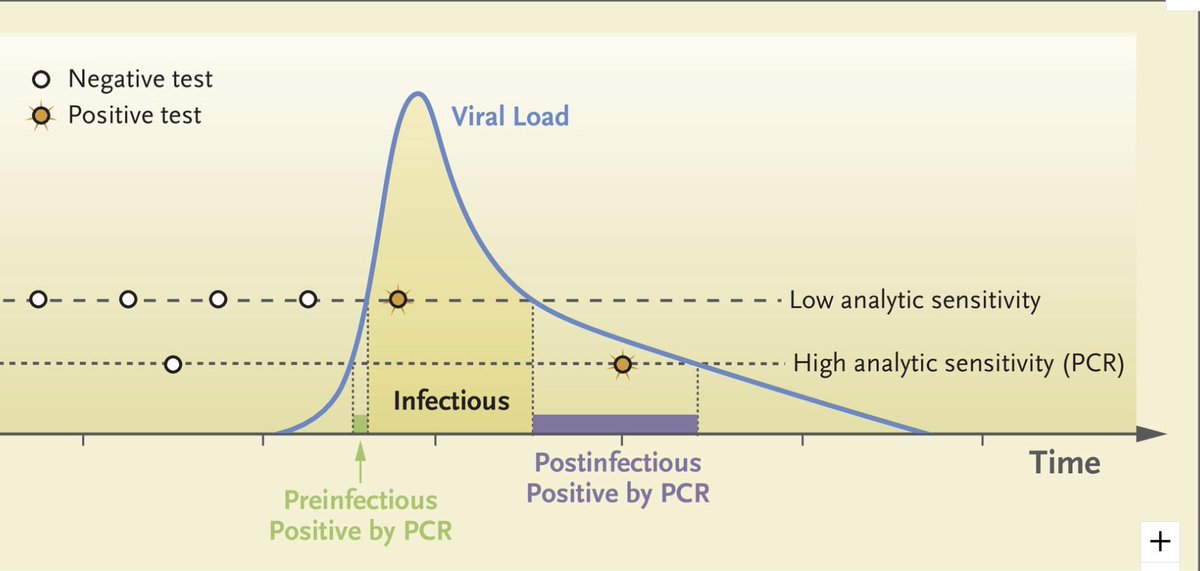
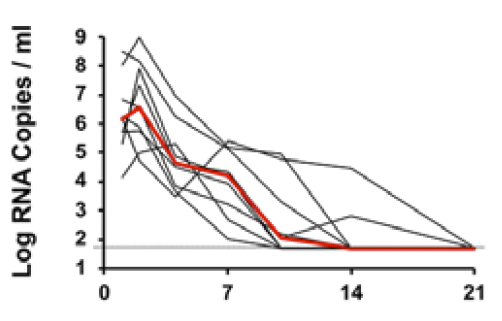
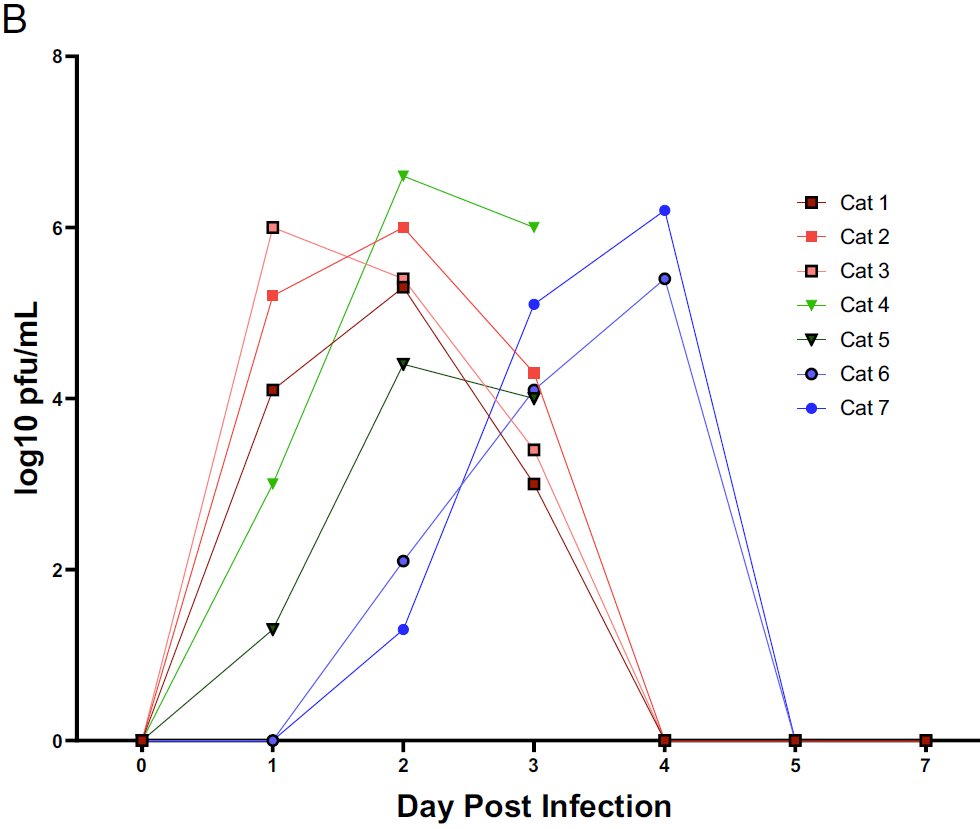
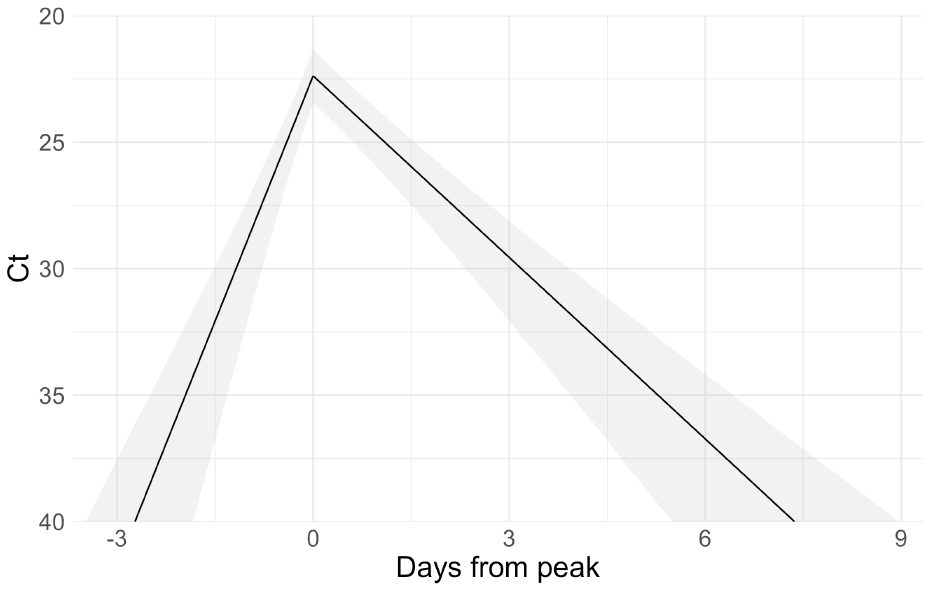
Repeated serological testing of all household members could help, as could viral load trajectories (authors have this data!!!) as could viral sequencing. Great new paper by @StephenKissler @yhgrad et al show load trajectories.
medrxiv.org/content/10.110…
medrxiv.org/content/10.110…
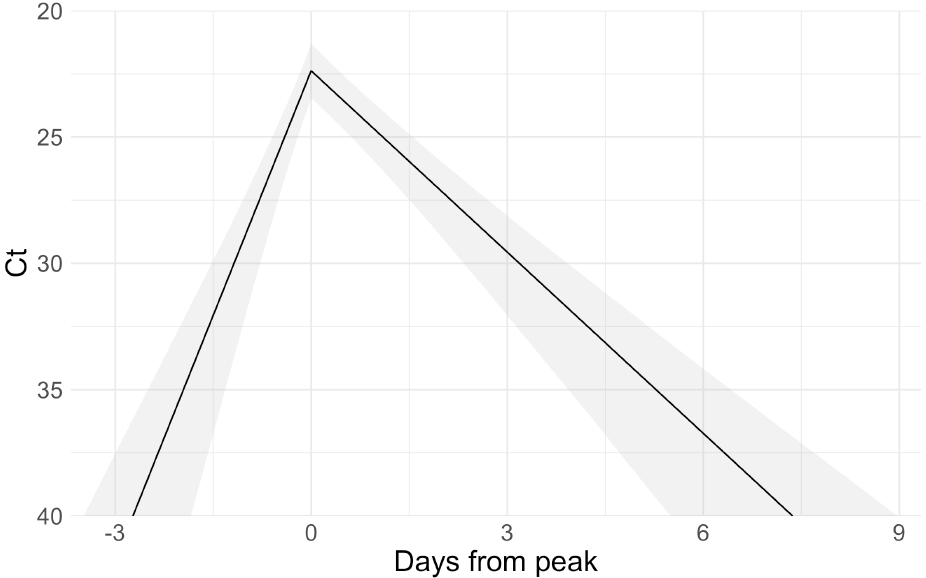
If viral loads are increasing (Ct decreasing) in one person & decreasing in another it's *likely* that person w/ decreasing loads got infected 1st. Index case should seroconvert earlier & secondary infections from index case should have nearly identical viral sequence of index.
Study acknowledges this issue & also reports overall attack rate excluding secondary infections that were PCR+ when 1st tested: 35% (28%-43%).
Note: attack rate is also inflated by infections that occurred outside household & were attributed to within household. Amount uncertain.
Note: attack rate is also inflated by infections that occurred outside household & were attributed to within household. Amount uncertain.
Many (most?) household members testing positive at enrollment could have been infected in house: tested median 4d after index case's symptom started, so median 9d post index case's infection; plenty of time for index to infect household member & their viral load be detectable.
So I'd guess that attack rate is closer to 53% than 35% but need more info to be certain. Unfortunately study doesn't provide these minimal attack rates for all groups (just overall). So we don't know if issue is bigger for some groups of index cases than others.
Similar attack rate for all ages of index & secondary cases contrasts sharply with many (but not all) previous papers (fig from Madewell cited above). A key issue is that many studies (including Yousef in fig) did NOT test all contacts by PCR daily & likely missed infections.

Does this paper "settle" the issue & show that kids have equal susceptibility & infectiousness? Of course not. But it has much more rigorous methods (daily swabs less likely to miss infection) than most other studies like this, so it shouldn't be ignored.
Final 2 results:
4. higher attack rate from female vs male index patients. This might result from women being more likely to be caregivers for children than men.
4. higher attack rate from female vs male index patients. This might result from women being more likely to be caregivers for children than men.
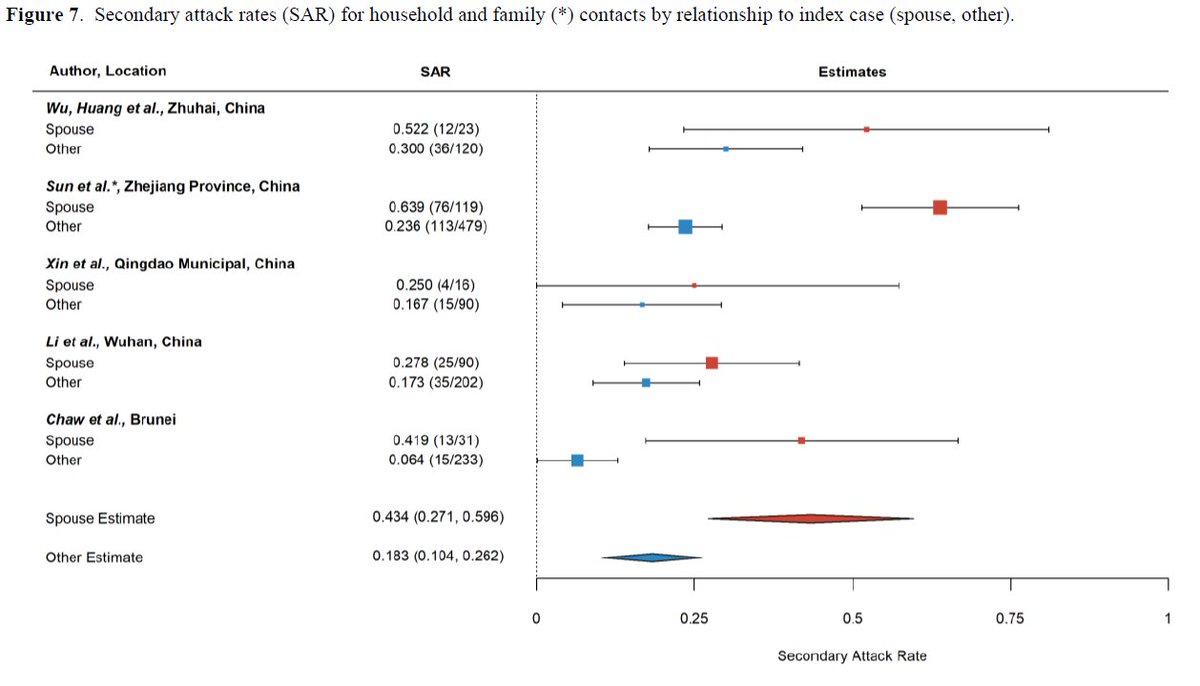
5. lower attack w/ increasing household size:
this likely stems from higher transmission to spouse than non-spouse; households w/ more people have more non-spouses.
this likely stems from higher transmission to spouse than non-spouse; households w/ more people have more non-spouses.
Conclusions
Study suggests attack rate might be much higher than previous studies. Why would this be? My #1 guess (& suggested by authors) is differences in behavior w/in household among study populations. In China, cases often isolated from household very quickly. Not in USA.
Study suggests attack rate might be much higher than previous studies. Why would this be? My #1 guess (& suggested by authors) is differences in behavior w/in household among study populations. In China, cases often isolated from household very quickly. Not in USA.
Study reports that 40% of index cases spent 4+ hours in same indoor room w/ household members while symptomatic. Thus, little isolation (masks?); lots of opportunity for transmission before & after symptom onset. Need analysis of whether this predicts transmission from index case
Why diffs in infections in kids & transmission from kids than majority of other studies? I'd guess combination of better methods to detect infection & behavioral diffs in families than other pops. As noted above, not much isolation despite symptoms. Safe isolation space needed!
Next steps:
Need many more studies like this, but to maximize insight gained we need to make most of data. No reason not to use sequential Ct scores as many of us have been suggesting to understand infection dynamics (@michaelmina_lab @StephenKissler @yhgrad).
Need many more studies like this, but to maximize insight gained we need to make most of data. No reason not to use sequential Ct scores as many of us have been suggesting to understand infection dynamics (@michaelmina_lab @StephenKissler @yhgrad).
We also need to add sequencing of viruses to link cases or identify outside infection as more likely source. Finally, serological tests could be used to:
-determine if household members are already immune
-see who seroconverts 1st to add evidence for IDing index case
-determine if household members are already immune
-see who seroconverts 1st to add evidence for IDing index case
Authors say this is ongoing study so I hope they'll add these improvements & share new results soon!
@nataliexdean @DrZoeHyde @mlipsitch @apsmunro @rozeggo
@nataliexdean @DrZoeHyde @mlipsitch @apsmunro @rozeggo
Perhaps no surprise, @DrZoeHyde has a thread on this paper also, written at almost exactly the same time w/ similar conclusions:
https://twitter.com/DrZoeHyde/status/1322429296577634304
• • •
Missing some Tweet in this thread? You can try to
force a refresh