"What's the matter with Reading? (and xG)"
Some interesting discussion (if you're a footy data 🤓 like me at least!) Thursday on the use of Expected Goals (xG), which Reading's wild start to the season has brought a spotlight on.
A few thoughts from me below.
[thread]
Some interesting discussion (if you're a footy data 🤓 like me at least!) Thursday on the use of Expected Goals (xG), which Reading's wild start to the season has brought a spotlight on.
A few thoughts from me below.
[thread]
https://twitter.com/Analytics1871/status/1321902632605200384
The good people at @FiveThirtyEight supply their match level xG and non-shot xG data for a lot of leagues, and from 2016, on their site for free: projects.fivethirtyeight.com/soccer-api/clu…
That's the data I've used in the rest of the tweet thread.
That's the data I've used in the rest of the tweet thread.
A word of caution, of course, that xG and non-shot xG data aggregated at match level *can* be misleading:
In a probalistic sense, ie. "how likely is the win?", it's better to have one shot all game that is 0.5 xG, a 50% probability of a goal, than 20 shots that are 0.025 xG each
In a probalistic sense, ie. "how likely is the win?", it's better to have one shot all game that is 0.5 xG, a 50% probability of a goal, than 20 shots that are 0.025 xG each
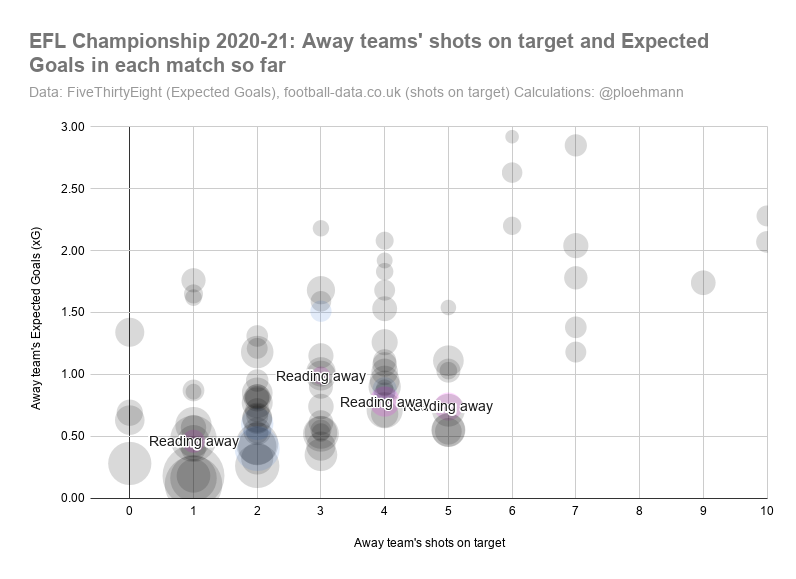
If one team in a match has a lot more shots (and/or shots on target) than the other team, but both teams have about the same xG, it could be an indication of exactly that being at play.
xG and shots (on target) tend follow one another quite well however:

xG and shots (on target) tend follow one another quite well however:


The team with the most Expected Goals only actually win about half of their matches. There's significant spread, though: 


It's similar with the bookmakers' favourites, who only win 40% of the time in the Championship. Even if we take matches with a clear favourite - shorter than Evens (2.00) - that make up just 20% of the Championship's matches, the favourites still win less than half the time. 

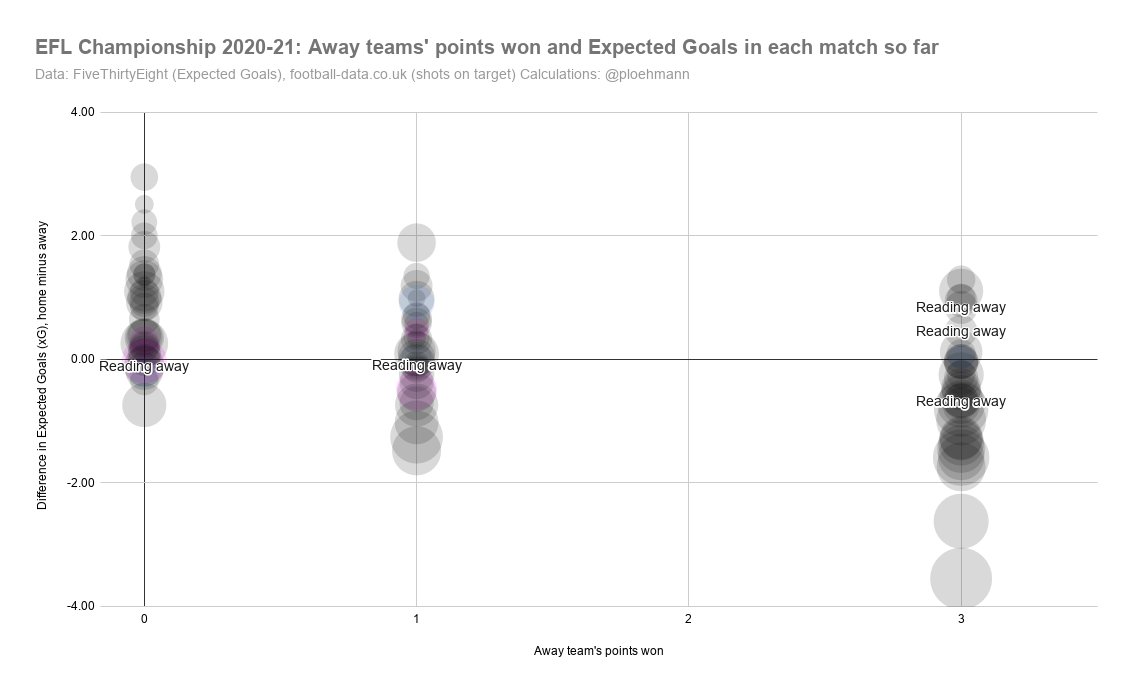
There's also little relationship between pre-match favourites and how the game panned out based on Expected Goals (xG): 

We can, however, use the Expected Goals of either team to calculate the likelihood they would've won if the game had been replayed (simulated) 100 times with the same set of chances. That can then be turned into Expected Points as follows (courtesy of @oh_that_crab): 

Those Expected Points can then be compared to the actual points won - and we see an altogether different league table emerge: 

The points won by teams are generally "more extreme" than the Expected Points would indicate. The overriding impression, however, is how little spread there is in the Championship. Its vast financial inequality does not seem to be wholly reflected in the generally tight matches: 

If we compare the points won in a game to the points the team would be expected to win based on Expected Goals (xG) and non-shot Expected Goals (ns-xG). 4 of the 10 biggest overperformances in matches are Reading's: 

Reading's efficiency, goals from number of shots on target, is head and shoulders above the rest.
That's the positive version.
The negative is that since 2018 no team has finished the season with more than 42% of shots on target being goals.
Reading's currently on 59%:

That's the positive version.
The negative is that since 2018 no team has finished the season with more than 42% of shots on target being goals.
Reading's currently on 59%:


• • •
Missing some Tweet in this thread? You can try to
force a refresh


