
For this year's #30DayMapChallenge i will be trying to create 30 maps on #Berlin just using #OpenData and #OpenSource software. For day 01 - Polygons, a map of all of Berlin's street trees. #QGIS Source: github.com/sebastian-meie… 
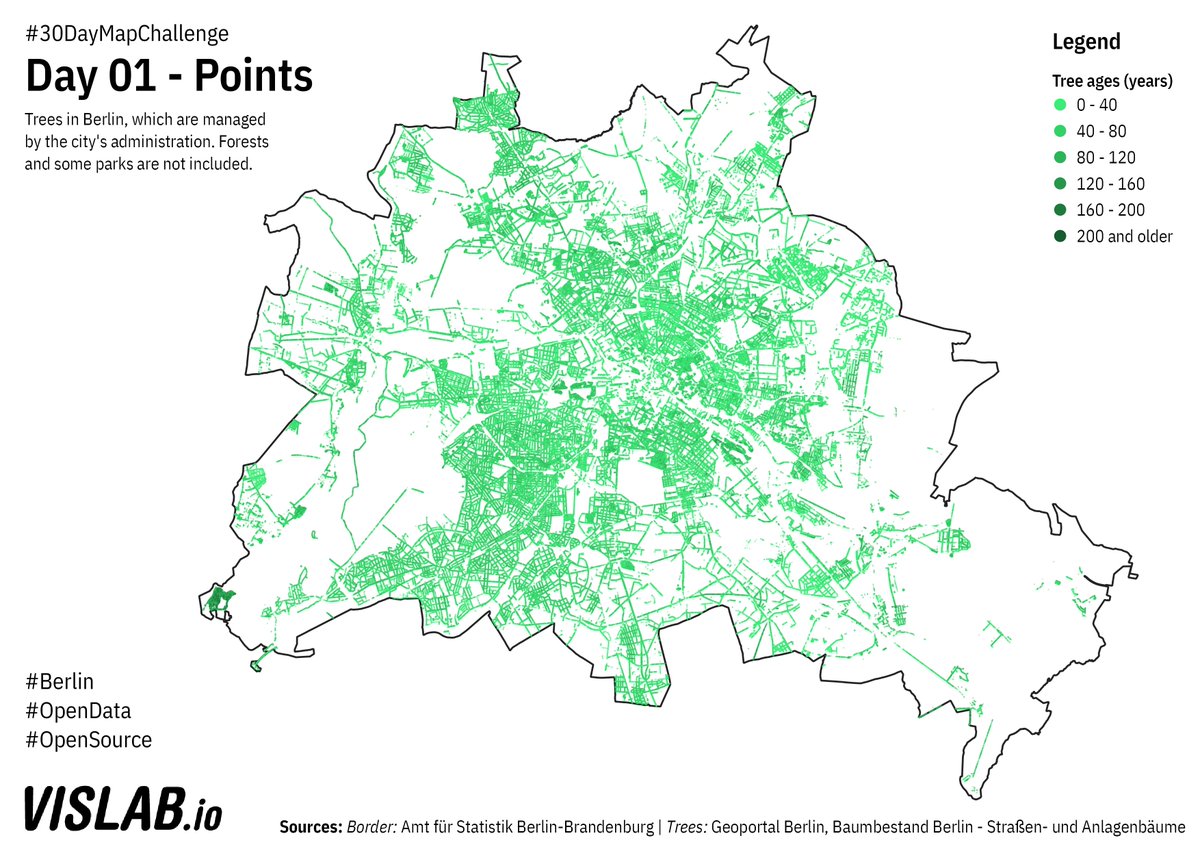
BTW @citylabberlin has built an #FOSS platform for visualising and managing joint efforts for watering trees during dry periods in the summer: giessdenkiez.de Source code: github.com/technologiesti…
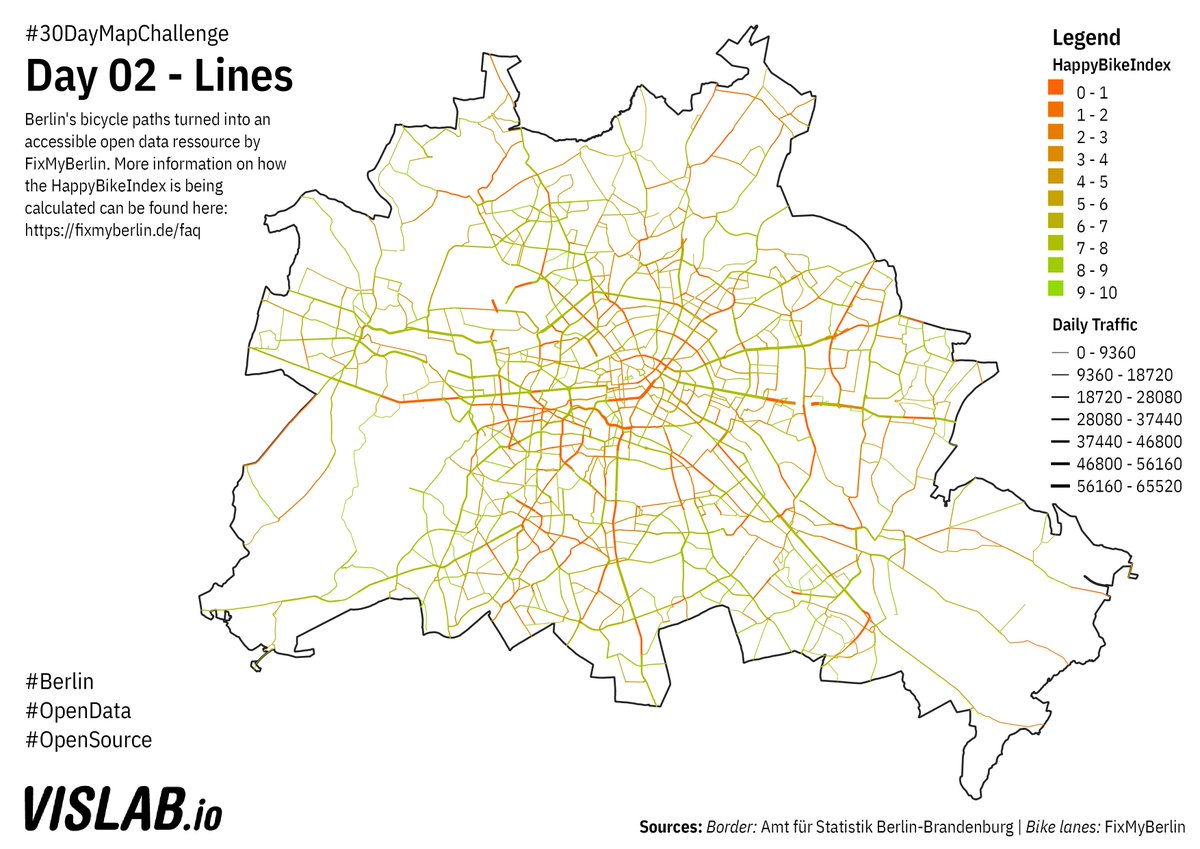
Day 2 of #30DayMapChallenge : Lines. Bike lanes in Berlin provided by @FixMyBerlin's API, showing their HappyBikeIndex. To explore the data set more in depth check out: fixmyberlin.de/zustand Code: github.com/sebastian-meie… 
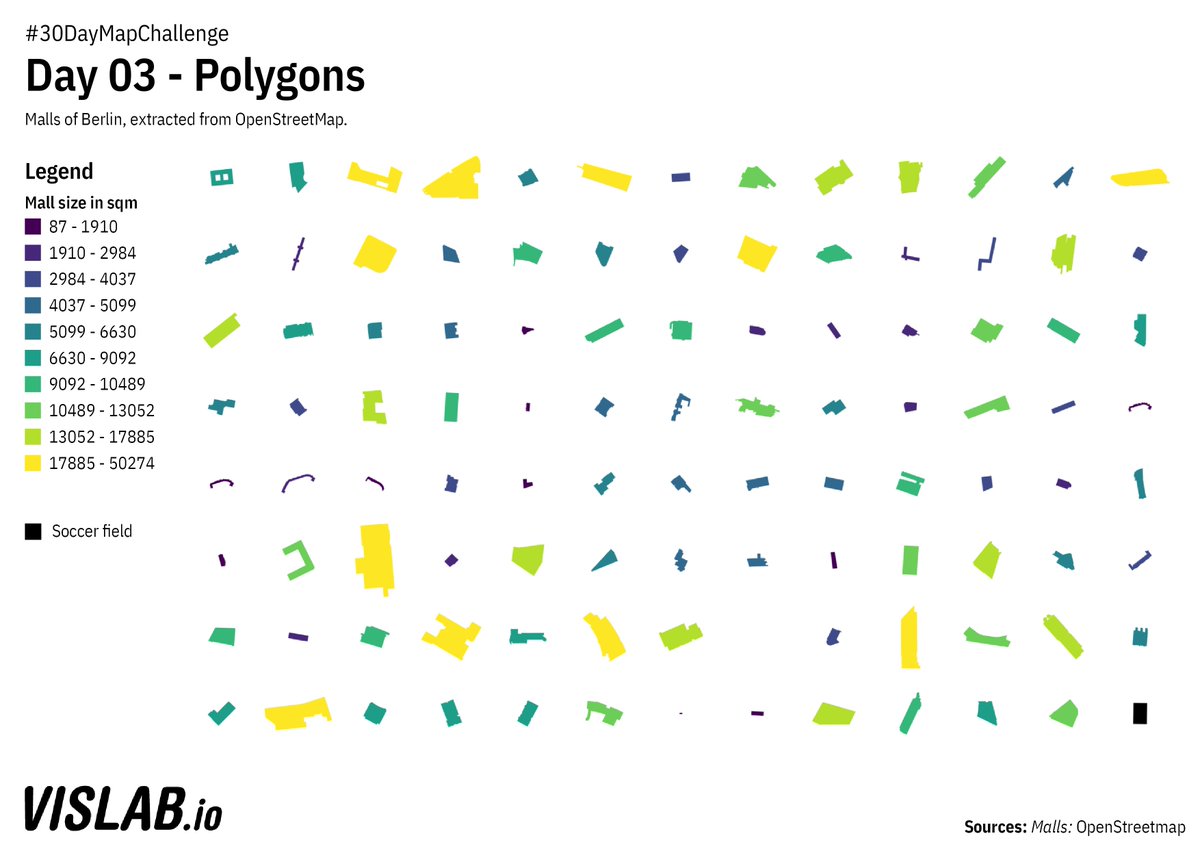
Day 3 of #30DayMapChallenge : Polygons. Shopping Malls of Berlin (and a soccer field for reference), exported from @openstreetmap Code: github.com/sebastian-meie… 
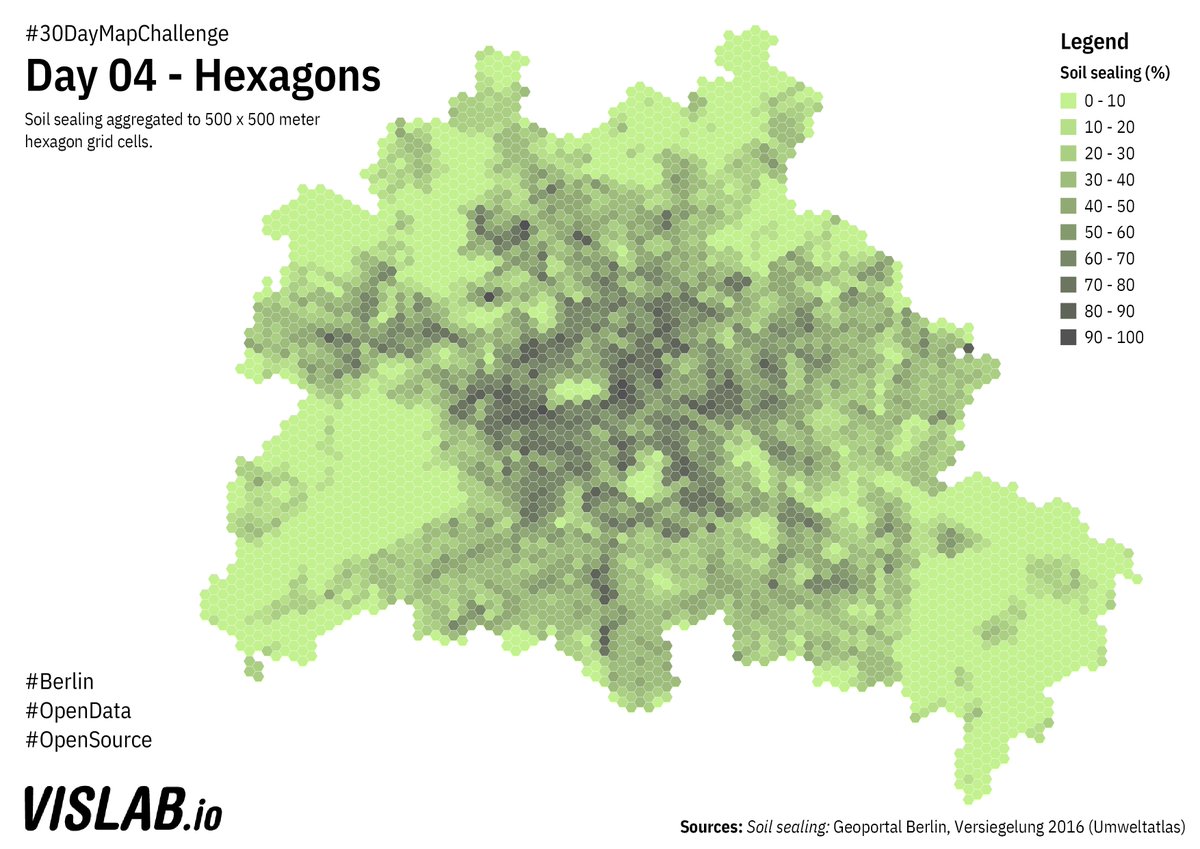
Day 4 of #30DayMapChallenge : Hexagons. The soil sealing of Berlin, aggregated to 500x500m hexagon grid cells in percentage. Besides @qgis also using @postgis today. Code: github.com/sebastian-meie… 
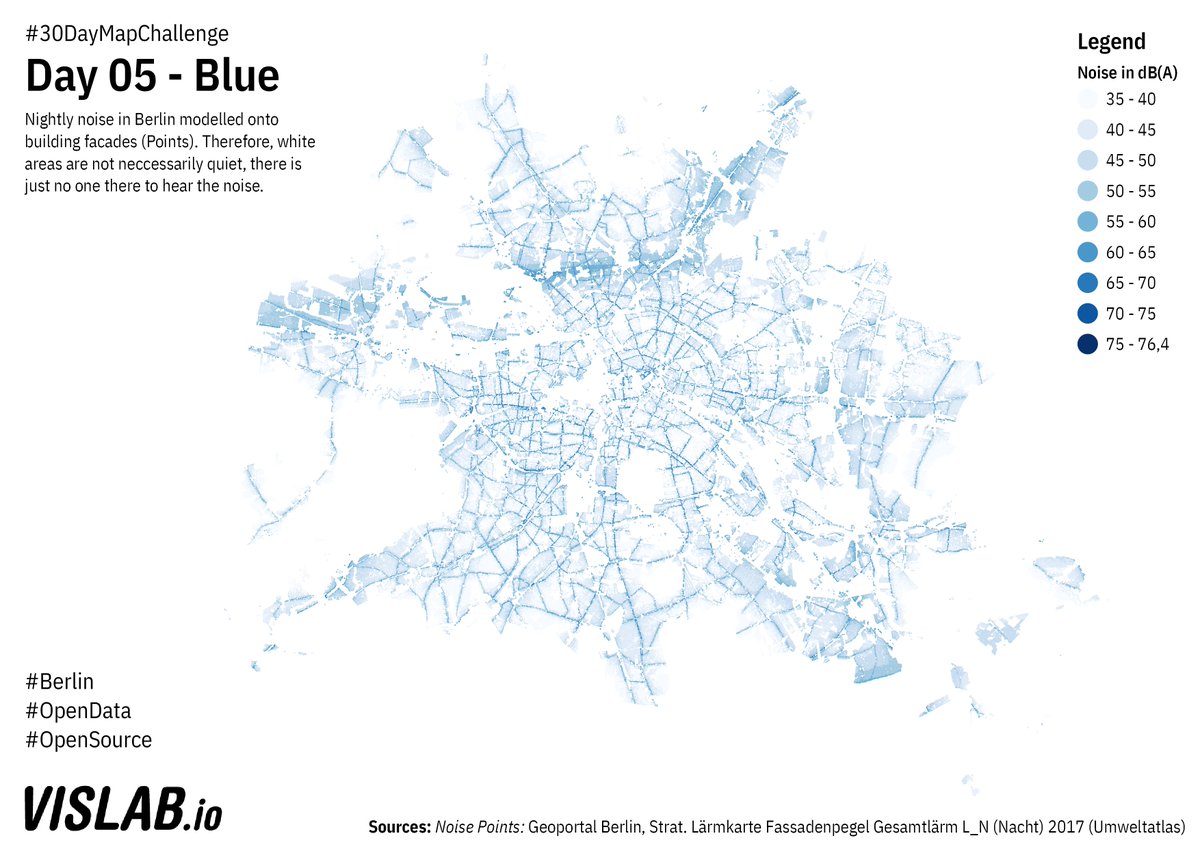
Day 5 of #30DayMapChallenge : Blue. Nightly noise levels in Berlin. The model projects noise onto residentialish buildings. White areas are not quiet, just no one living there to hear the noise. Some noisy areas in those white voids, like airports. Code github.com/sebastian-meie… 
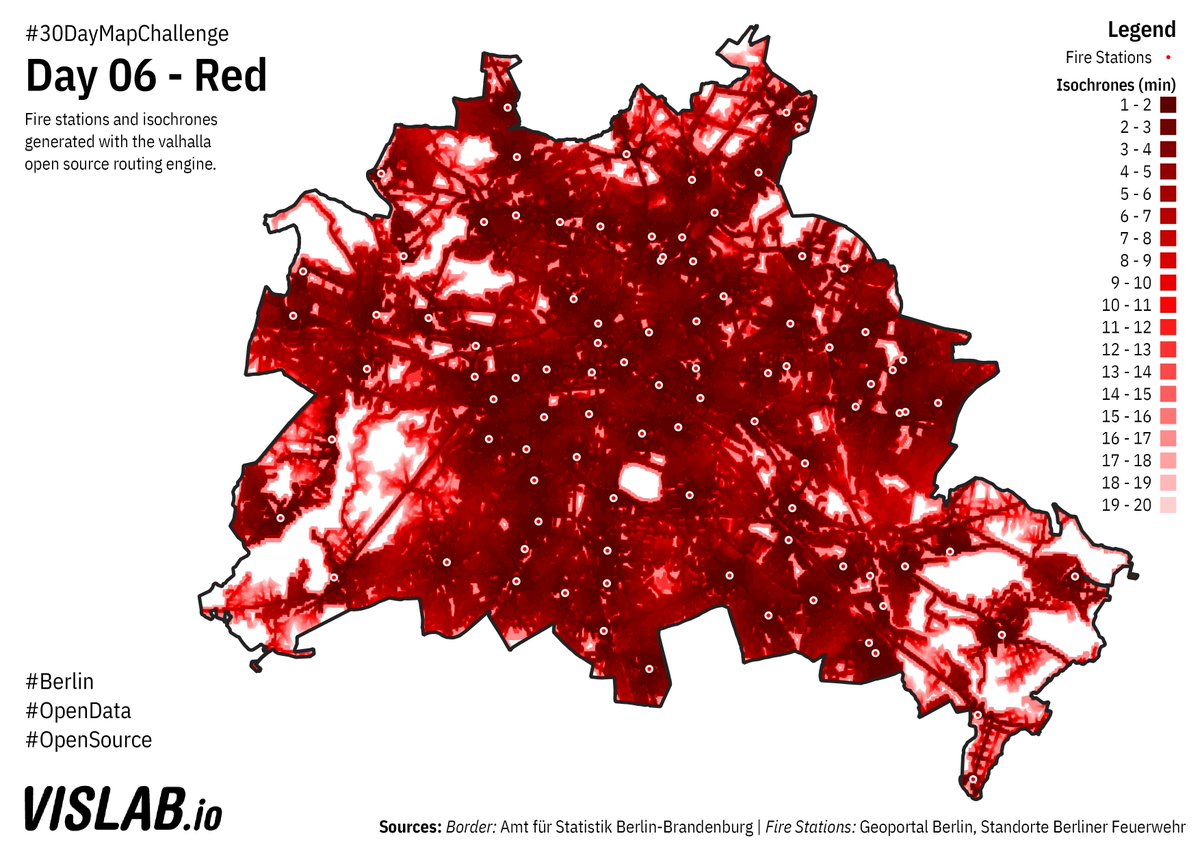
Day 6 of #30DayMapChallenge : Red. Fire stations with surrounding isochrones (estimated time of arrival). Thought this would look more interesting, but looks like @Berliner_Fw is nicely distributed🚒👩🚒👨🚒👍. Isochrones done with @ValhallaRouting Code: github.com/sebastian-meie… 
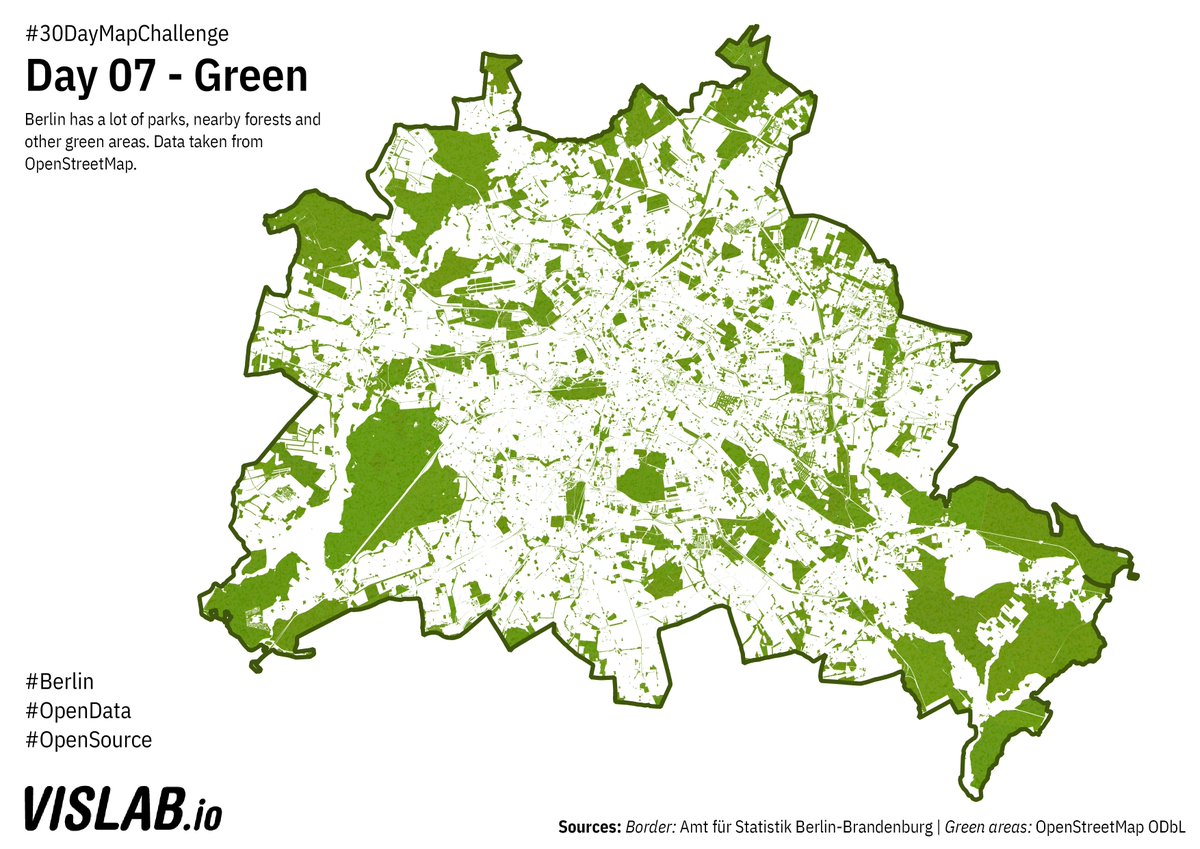
Day 7 of #30DayMapChallenge : Green. All the green bits of Berlin from forests to parks to allotments, Berlin has a lot to offer🌲🌹🌻🌷🌼🌺🌳. Data from @openstreetmap Code: github.com/sebastian-meie… 
Day 8 of #30DayMapCallenge : Yellow. Roof's suitability for photovoltaik solar energy systems. An interactive version can be found here: energieatlas.berlin.de/?permalink=izu… Code: github.com/sebastian-meie… 

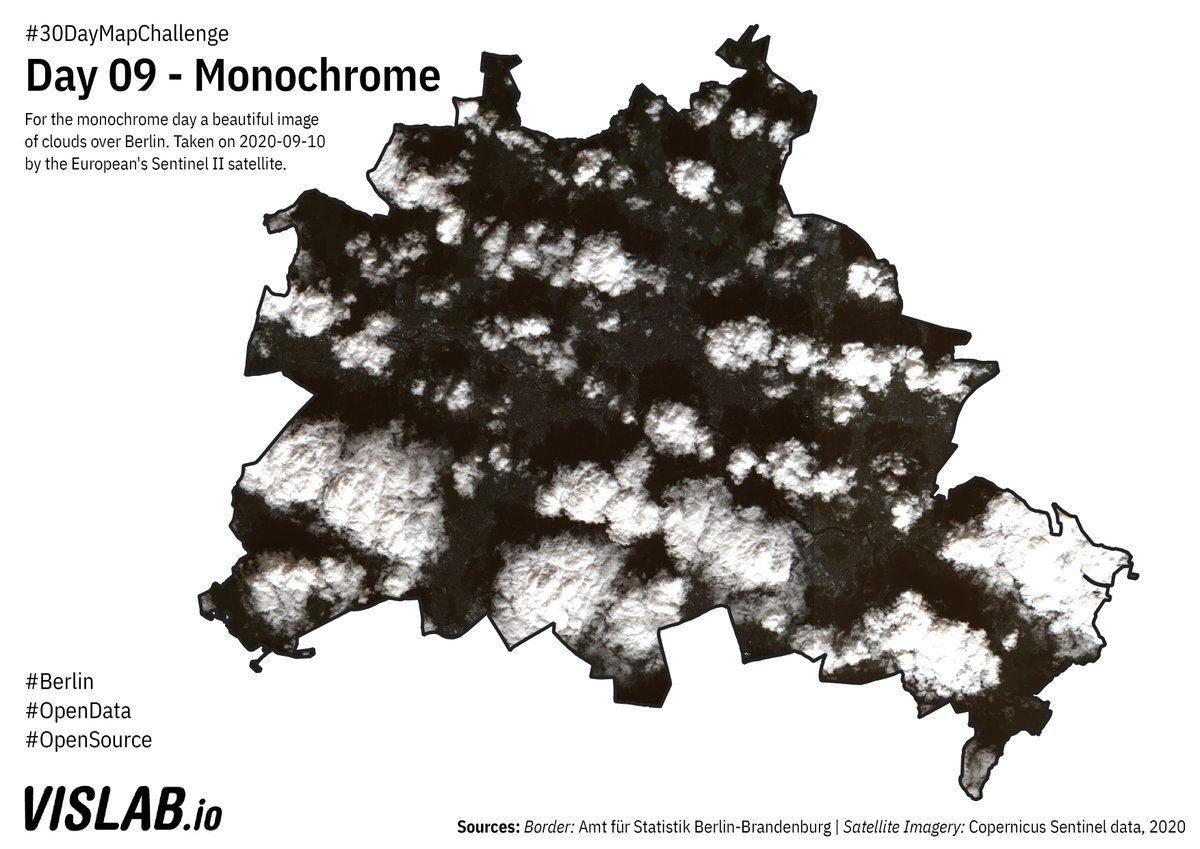
Day 9 of #30DayMapChallenge : Monochrome. A cloudy sentinel 2 photo from Berlin. @esa 's @CopernicusEU portal has tons of open data available. If you are new to satellite data, good tutorial by @FU_Berlin blogs.fu-berlin.de/reseda/ Code & Data links: github.com/sebastian-meie… 
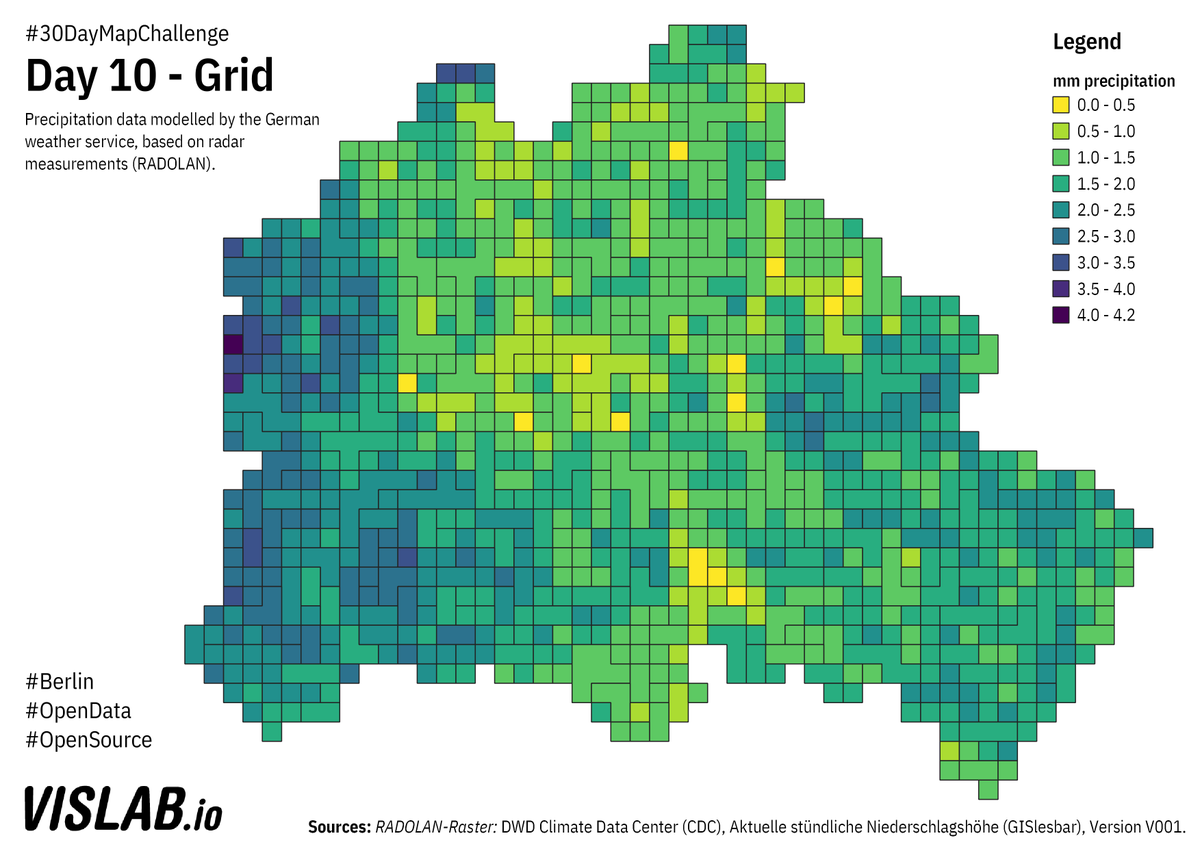
Day 10 of #30DayMapChallenge : Grid. Precipitation data from German Weather Service (DWD). The RADOLAN product provides modelled 🌧️ from radar observations. This is hourly data for November 2nd 1:50AM. DWD has tons of open data opendata.dwd.de Code github.com/sebastian-meie… 
Day 11 of #30DayMapChallenge : 3D. Today i explored for the first time @qgis 3D feature. "Slightly" exaggerated elevation ⛰️⛏️🏔️. View from Havel and Lindwerder over Berlin. Code: github.com/sebastian-meie… 

Day 12 of #30DayMapChallenge : Not GIS. I transformed @VBB_BerlinBB #GTFS data into a network dataset and loaded it into @cytoscape . TBH not really helpful yet very beautiful. Data and Code: github.com/sebastian-meie… 

Day 13 of #30DayMapChallenge : Raster. One of my favourite aerial/satellite imagery are infrared images. They provide information about vegetation (darker red) but also make earth look like a weird alien planet. Code: github.com/sebastian-meie… 

Day 14 of #30DayMapChallenge : Climate change. While this map of renewables looks promising. They only account for 1-5 percent of Berlin's energy consumption. Still a lot of fossil energy including coal are Berlin's primary energy source. Code: github.com/sebastian-meie… 

Day 15 of #30DayMapChallenge : Connections. Reusing Berlin's public transport network for a map of all connections of Berlin and beyond. Code: github.com/sebastian-meie… 

Day 16 of #30DayMapChallenge : Islands. Berlin also has a couple of islands. This group here sits in the Tegler See. So todays map is not about realistic depictions, but rather me exploring @qgis styling options, like random marker fill 🤩. Code: github.com/sebastian-meie… 

Day 17 of #30DayMapChallenge : Historic. A quickly goereferenced map of Berlin in its early stage (1688). Bringing together Cöln (yellow) and Berlin (red). More interactive historic maps with address lookup: histomapberlin.de/histomap/de/in… Code: github.com/sebastian-meie… 

Day 18 of #30DayMapChallenge : Landuse. While probably the most boring map of all. I find it very interesting that large parts of the park Tempelhofer Feld are classified as residential. I thought that decision was still up for debate?! Code: github.com/sebastian-meie… 

Day 19 of #30DayMapChallenge : NULL. 30 days are really long, so i am using todays theme to take a day off... #NULL #UNDEFINED #NA 

Day 20 of #30DayMapChallenge : Population. I used building types and floors to model population on a building level and then represent each individual person as a dot (random points in polygon) using @qgis & @PostgreSQL + @postgis Code: github.com/sebastian-meie… 

Day 21 of #30DayMapChallenge : Water. Berlin has a lot of Water and a lot of public bathing spots within its rivers and lakes. There is an app by @TSBBerlin where you can see daily water quality predictions: badegewaesser-berlin.de Code: github.com/sebastian-meie… 

Day 22 of #30DayMapChallenge : Movement. Our mobility highly depends on our ability to reach/use places and, therefore, their accessibility. A map of place's accessibility based on @SOZIALHELDEN accessibility.cloud an interactive version: wheelmap.org 

Day 23 of #30DayMapChallenge : Boundaries. I remember starting working with Berlin's spatial data, I was confused about all those boundaries: Administrative, Political, Statistical. I wrote an article a while ago about this: lab.technologiestiftung-berlin.de/projects/spati… Code: github.com/sebastian-meie… 

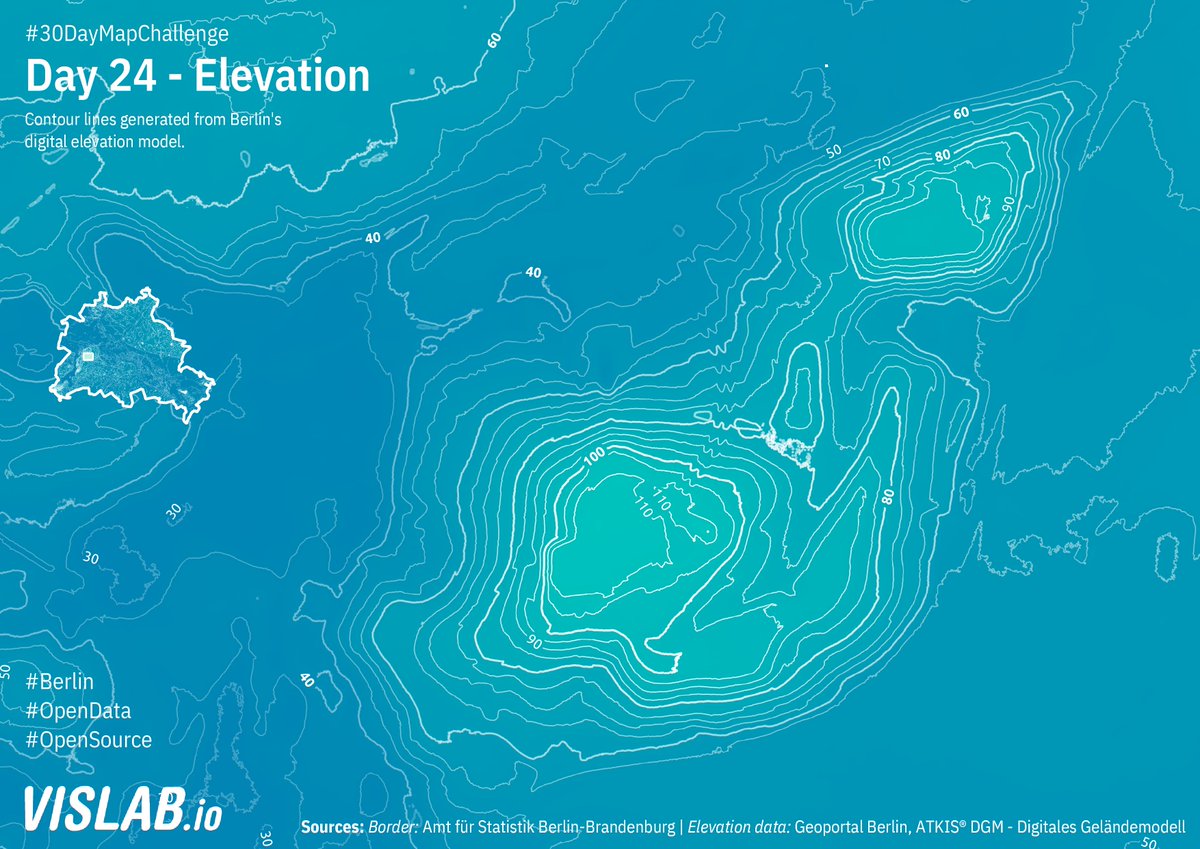
Day 24 of #30DayMapChallenge : Elevation. Teufelsberg and Drachenberg in the Grunewald forest. There are many open terrain and elevation models out there. Berlin has its own very detailed one. I find contour maps very visually pleasing. Code: github.com/sebastian-meie… 
Day 25 of #30DayMapChallenge : COVID. A cartogram of overall COVID cases (per 100k inhabitants) in Berlin's districts visualised through a cartogram (using a QGIS-Plugin). Code: github.com/sebastian-meie… 

Day 26 of #30DayMapChallenge : New Tool. This @waveshare00 e-ink display was sitting in a drawer for ages. Perfect reason to get started. The #raspberrypi controls the display. Once graphic is loaded power can be turned off. Only accepts b/w bmp. Code: github.com/sebastian-meie… 

@waveshare00 Day 27 of #30DayMapChallenge : Big or small data. There is not a lot of "big" data available. A nice project by @DAI_Labor, an observation of traffic around Ernst-Reuter-Platz. The results are available as open data. Using @qgis temporal feature. Code: github.com/sebastian-meie…
Day 28 of #30DayMapChallenge : Non-Geographic Map. In this square map of age distributions by districts, the districts are positioned relative to their actual spatial position (explanatory map on the left). Square map built in @d3js_org Code: github.com/sebastian-meie… 

Day 29 of #30DayMapChallenge : Globe. The challenge has been a good reason to explore @qgis features i have not tried before, like custom projections to create globes 🌎🌍🌏 Code: github.com/sebastian-meie… 

Day 30 of #30DayMapChallenge : A map. Concluding the map challenge with a multivariate map, visualising a socio-economic index combined with population density and the trend of the index. Big fan of bi- or multivariate maps. Code: github.com/sebastian-meie… 

• • •
Missing some Tweet in this thread? You can try to
force a refresh


