Separately, I wanted to address the question of "why do this?" with regards to sequencing of infections involved in the White House #COVID19 outbreak. 1/10
Although the origins of the White House outbreak were characterized as "unknowable", viral genome sequencing can offer important clues to how infections in a cluster are connected to each other and to the larger COVID-19 epidemic. 2/10
This technology is rapidly becoming a standard course of action for COVID-19 clusters of public health interest. This seems obvious, but we can use science to understand and track the spread of COVID-19. 3/10
With all of the resources of the federal government at the disposal, cases in the White House outbreak could easily have been sequenced and science conducted. However, this sequencing was not performed. 4/10
More generally, we could have had a national program to conduct case-based interventions with targeted testing, contact tracing and isolation. I wrote about this as "the Apollo program of our times" over seven months ago on March 18. 5/10
This program never launched and was never really attempted. 6/10
The lack of genetic sequencing of the White House COVID-19 cluster is just one more example of scientific / technological solutions not being implemented. 7/10
I wanted to show that this could be done and to use science to shed light on something dismissed as "unknowable". 8/10
Regarding timing, we've worked hard this month to seek IRB approvals, enroll individuals, collect swabs and sequence these specimens, with the second sequencing run finishing yesterday morning. 9/10
I believe it would be inappropriate to sit on results of such obvious public interest and so moved forward with releasing the technical report today. 10/10

• • •

Missing some Tweet in this thread? You can try to force a refresh
 

Keep Current with Trevor Bedford

Trevor Bedford Profile picture

Stay in touch and get notified when new unrolls are available from this author!

Read all threads

This Thread may be Removed Anytime!

PDF

Twitter may remove this content at anytime! Save it as PDF for later use!

Try unrolling a thread yourself!

how to unroll video
  1. Follow @ThreadReaderApp to mention us!

  2. From a Twitter thread mention us with a keyword "unroll"
@threadreaderapp unroll

Practice here first or read more on our help page!

More from @trvrb

1 Nov
Our research group at @fredhutch, @UWMedicine and @BrotmanBaty has sequenced the viral genomes of two SARS-CoV-2 infections that were connected to the White House #COVID19 outbreak. The @nytimes reports here: nytimes.com/2020/11/01/sci…. 1/16
We enrolled two individuals with exposures linked to the White House COVID-19 outbreak into an IRB-approved research study, collected nasal swabs and sequenced the SARS-CoV-2 virus in these swabs. 2/16
Importantly, these two individuals attested that they had no direct contact with each other in the days preceding their diagnoses and are independently linked to the White House COVID-19 outbreak. 3/16
Read 18 tweets
19 Oct
Daily #COVID19 case counts are increasing in the US and we seem to hitting a third wave (or second surge if you'd prefer). Here I wanted to look at how case counts through time correlate across different states. 1/12
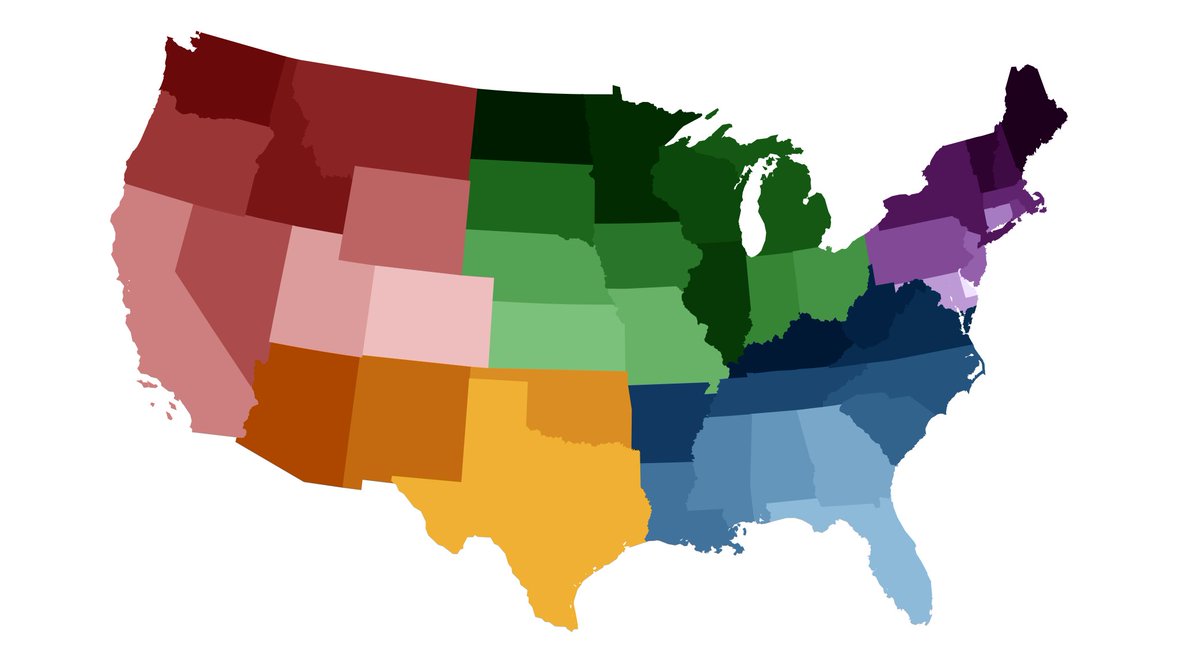
I start with a simple coloring to group states in the West (in red), the Southwest (in orange), the Midwest (in green), the Southeast (in blue) and the Northeast (in purple). Color ramp borrowed from @andersonbrito_. 2/12
Using data from @COVID19Tracking, I plot daily confirmed cases for each state since March as a stacked chart. The three crests are obvious (though not clear how large the third will end up being). Different regions are contributing to each wave to different degrees. 3/12
Read 13 tweets
9 Aug
A follow up to yesterday's controversial thread on societal behavior, population immunity and Rt to specifically address issue of what fraction of the population in Florida, Texas and Arizona may have had COVID-19. 1/16
Multiple people expressed skepticism that 20% seroprevalence in Florida is reasonable. Others thought that 20% was patently impossible due to implied crude infection fatality ratio (IFR). 2/16
This thread walks through a ballpark version of implied IFR that takes into account reporting delays in Florida, Texas and Arizona in their recent epidemic surge. Data and figures that follow from @COVID19Tracking. 3/16
Read 17 tweets
7 Aug
I wanted to discuss the degree to which population immunity may be contributing to curbing #COVID19 in Florida, Arizona and Texas, where recent surges have resulted in substantial epidemics. 1/16
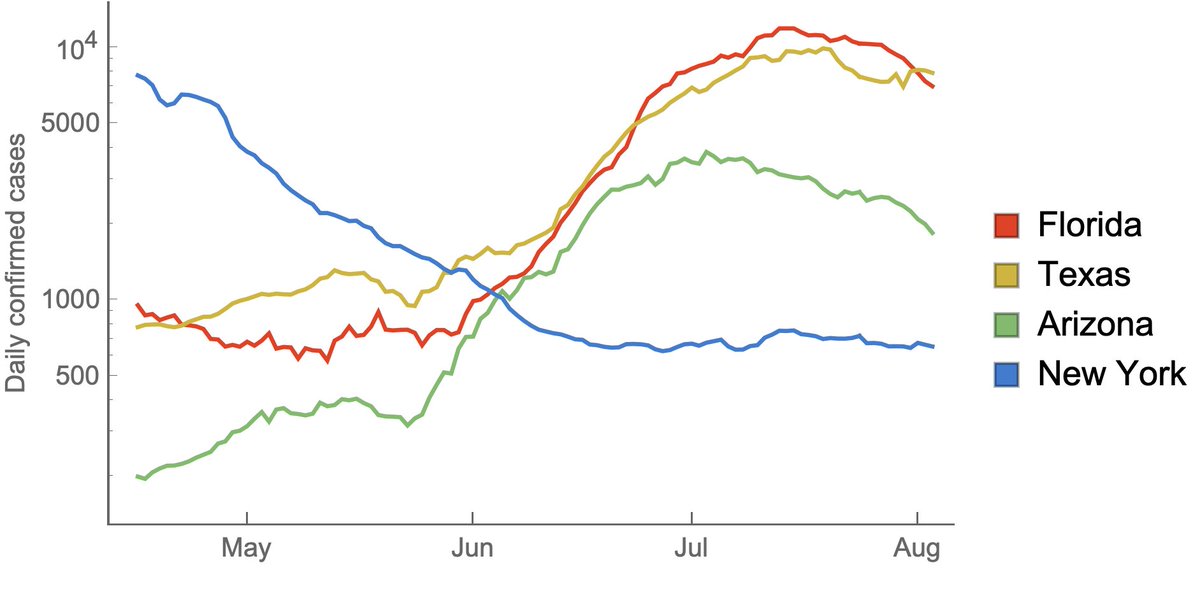
After increasing dramatically in June and July, daily case counts in Florida, Arizona and Texas have begun to subside. Data from @COVID19Tracking. 2/16
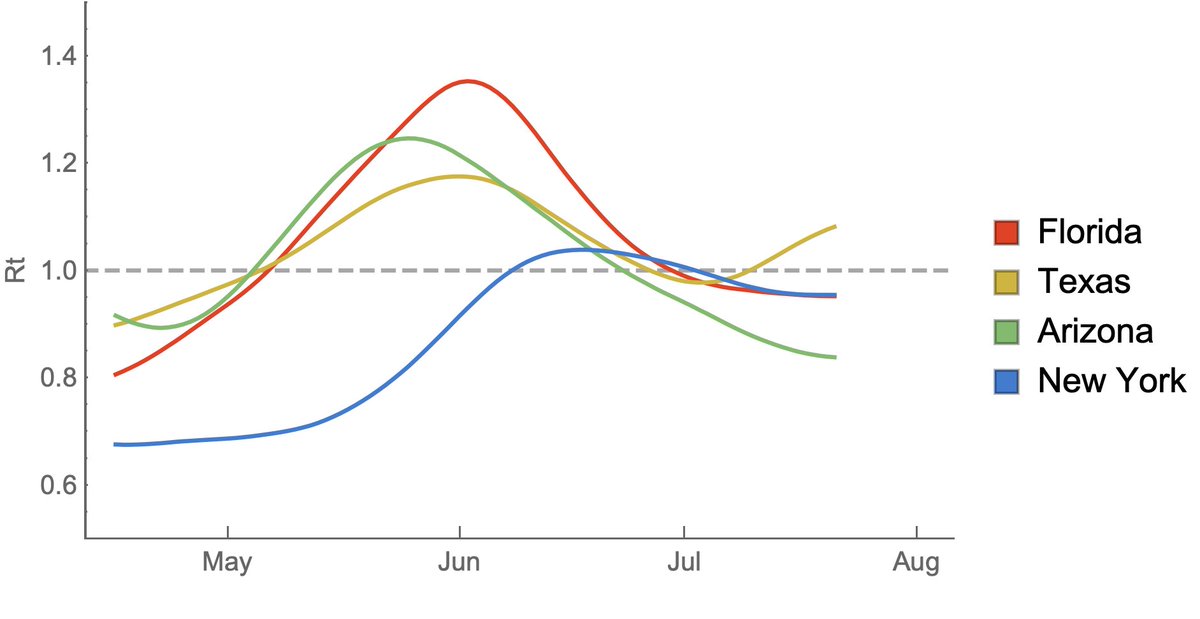
This corresponds to a peak Rt of between 1.2 and 1.4 in late-May / early-June and steady reductions since this point. Declining case counts correspond to Rt < 1. Rt estimates from rt.live. 3/16
Read 17 tweets
23 Jul
With @CDCgov's update to their seroprevalence results across sites in the US, it's possible to see if with increased availability in testing whether we're catching a larger fraction of infections as confirmed cases. 1/13
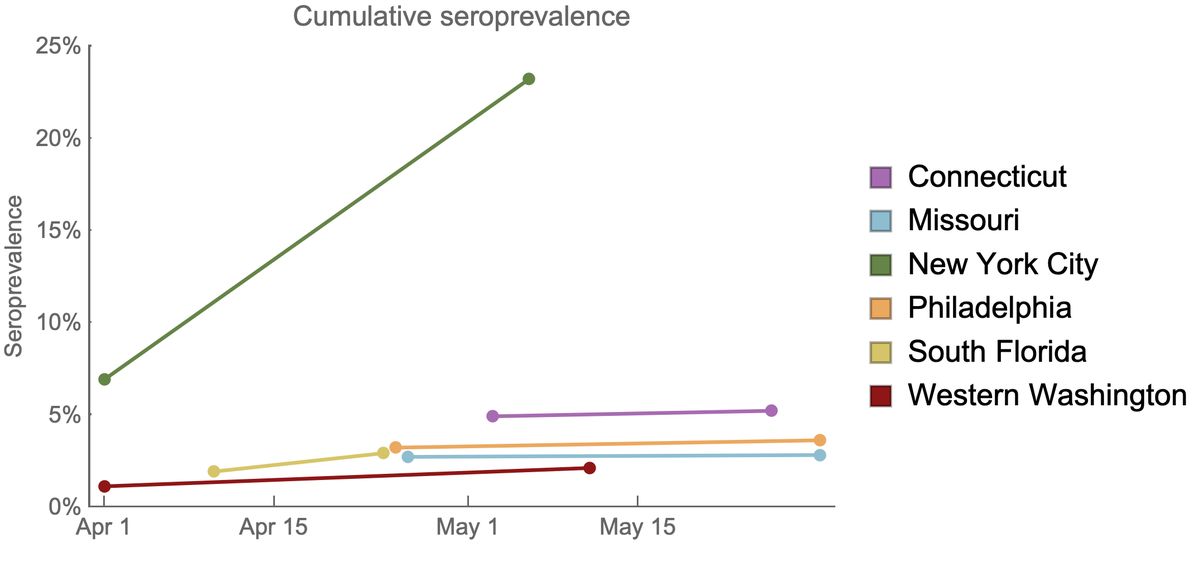
The @CDCgov seroprevalence survey (cdc.gov/coronavirus/20…) tests blood samples from different sites in the US for COVID-19 antibodies. With a serosurvey, it's possible to look at the path of the epidemic in a broader fashion than what's available from PCR assay results. 2/13
By taking multiple cross-sectional samples, it's possible to see the rate at which seropositivity increases. Here I'm replotting data from the CDC dashboard (cdc.gov/coronavirus/20…) to show seroprevalence at 6 sites across 2 different timepoints for each site. 3/13
Read 14 tweets
17 Jul
A follow up to the thread two weeks ago on rising case counts and "reopening", looking at continued trajectories in states with large epidemics. 1/15
When looking at epidemic dynamics, it's worth paying close attention to how the "fundamental reproductive number" changes through time, usually called Rt. This expresses how many secondary infections a primary infection leaves on average. 2/15
Approaches like epiforecasts.io/covid/ and rt.live estimate Rt from confirmed case data. Critically, due to disease incubation period, delays in seeking testing and delays in test reporting, we don't know what Rt is at the very moment. 3/15
Read 17 tweets

Did Thread Reader help you today?

Support us! We are indie developers!


This site is made by just two indie developers on a laptop doing marketing, support and development! Read more about the story.

Become a Premium Member ($3/month or $30/year) and get exclusive features!

Become Premium

Too expensive? Make a small donation by buying us coffee ($5) or help with server cost ($10)

Donate via Paypal Become our Patreon

Thank you for your support!

Follow Us on Twitter!