"Coronavirus: T-cell immunity exists six months after infection, study finds" - Sky
This must come as quite a shock. Who'd have thought there could be more to immunity than antibody levels?
Of course that's not the whole article...
The article goes on to say...
"But the researchers, from Public Health England and the UK Coronavirus Immunity Consortium, warn that it's still not clear whether the T-cell levels were high enough to protect against re-infection."
I suggest refering to known science as a starting point. There used to be quite a lot of it around, although we seem to have mislaid it recently.
To be cautious though I suggest (seriously) this:
1) Treat as true the commonly declared hypothesis that "only people with measurable levels of antibodies have immunity".
2) Work out what should happen if that is the case.
3) Test your predictions against observed reality.
4) Do you see what you should see?
If YES: Your hypothesis may be correct (although never 100%; another conversation).
If NO: Your hypothesis regarding immunity from #SARS_CoV_2 is wrong.
This video, half a century old, summarise the idea beautifully.
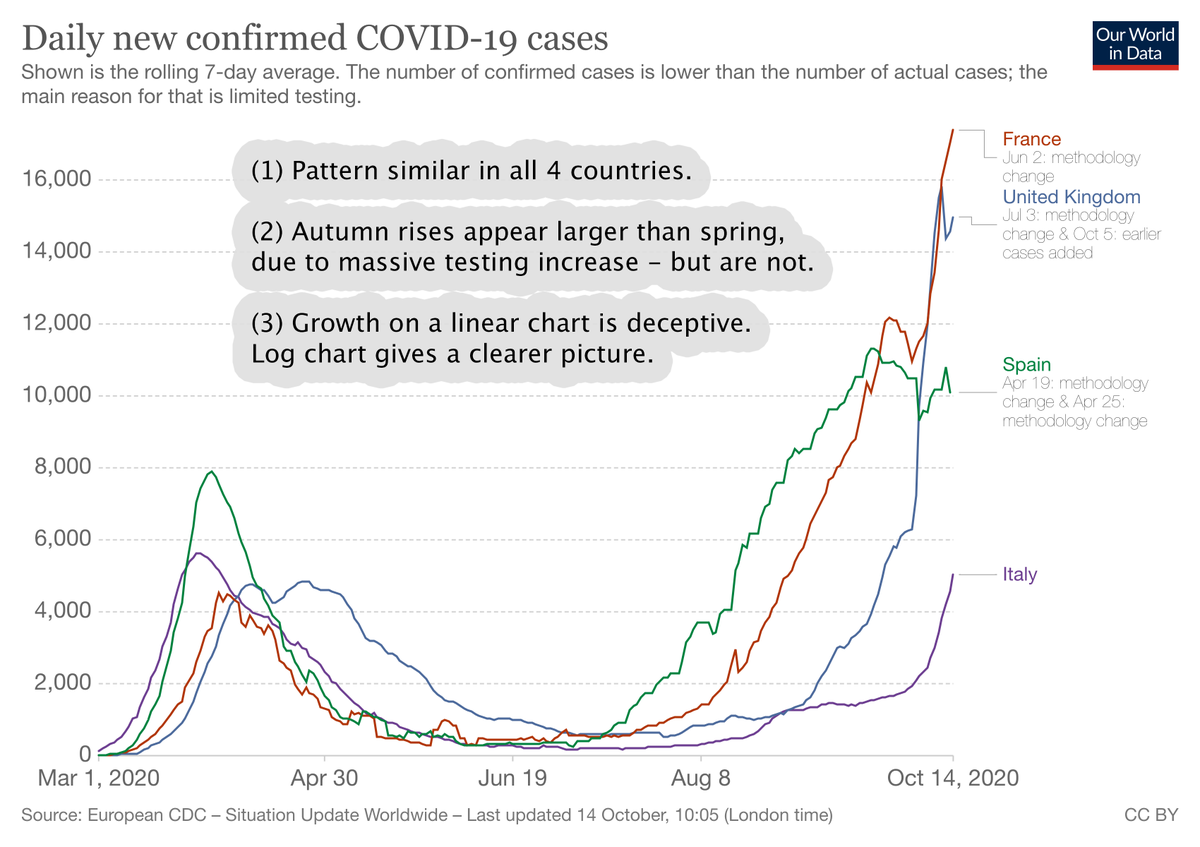
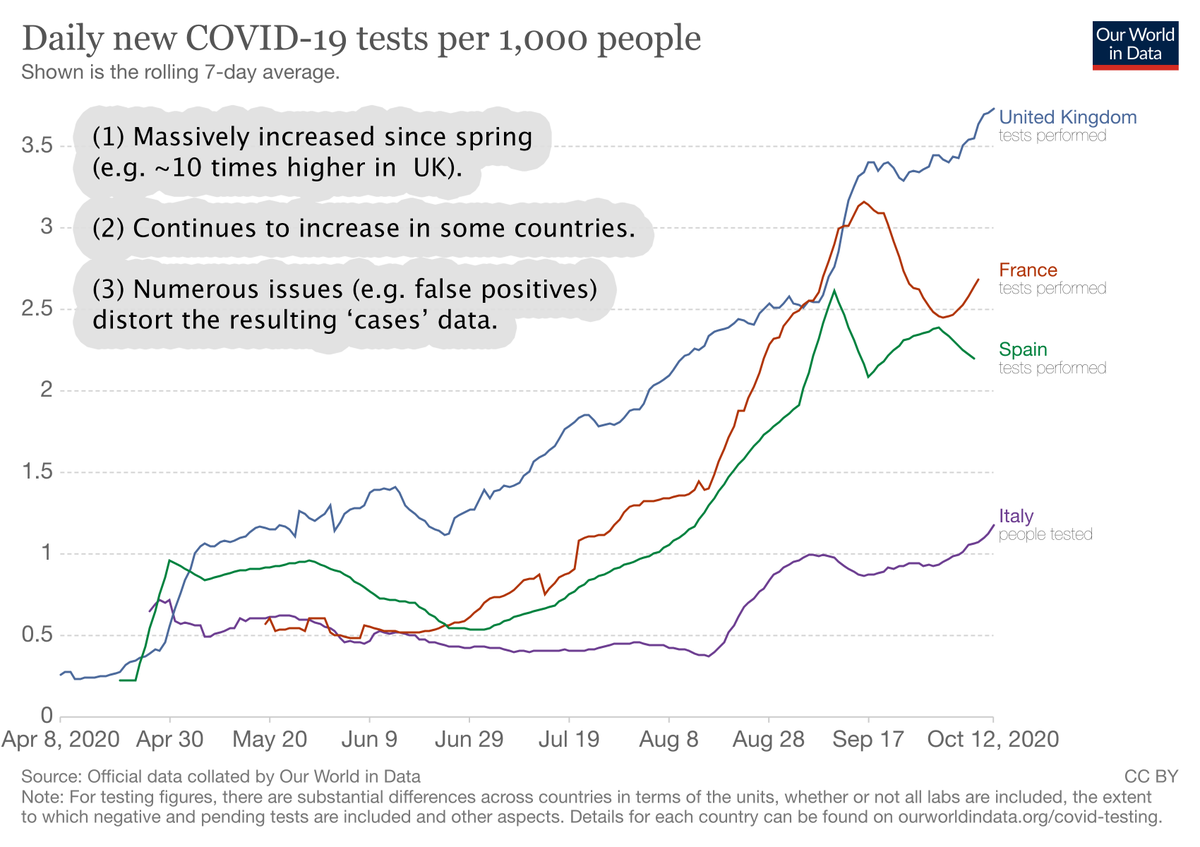
The recent ICL study re declining antibody levels provides an opportunity to examine the hypotheses that only measurable levels of antibodies provide effective immunity. See attached. When checked against reality this hypothesis appear to be wrong.
What actually matters though is not just the probability of succumbing to the virus if infected but also the probability of becoming infected in the first place.
Population Fatality Rate (PFR) = probability of infection X IFR
ICL UK STUDY SHOWS DECLINING ANTIBODY LEVELS,
“DASHING HOPES OF HERD IMMUNITY”
ANALYSIS
An ICL led study of population antibody levels found that, between late June & late September “the number of people testing positive dropped by 26.5%” imperial.ac.uk/news/207333/co…
[27 Oct 2020v1]
The interpretation reported in the media - & seemingly widely believed - is that only those with measurable antibody levels possess immunity & that, if those fade, people become susceptible to re-reinfection.
e.g. news.sky.com/story/coronavi…
& bbc.co.uk/news/health-54…
This ignores well established knowledge regarding the immune system, which is more complex than mere possession of measurable levels of antibodies. In fairness some articles do mention this.
However, the true judge is reality, which we can attempt to study through the data.
CZECH REPUBLIC & HUNGARY
are currently reporting higher daily Covid-19 deaths per M than other European countries. Current daily deaths are significantly higher than their spring peaks. Interestingly, both experienced far lower earlier total deaths than many other countries.
One possibility is that the lower earlier totals correspond to fewer infections, leaving a larger proportion of the population still susceptible.
Incidentally, I do agree with people who've pointed out the unpleasantness of treating this sort of comparison almost as a macabre spectator sport. That should not be the intention. The purpose is to use the information to learn about the virus, value of measures taken etc.
AUTUMN 2020 CORONAVIRUS GROWTH
IN UK, FRANCE, ITALY & SPAIN
APPEARS TO BE MUCH MILDER THAN SPRING
An analysis:
[14 Oct 2020 v1]
[Notes added to charts in grey bubbles are my own.]
[Analysis, opinions & errors my own.]
Several countries that experienced relatively high fatalities in the spring have seen an autumn increase. The patterns are similar.
Comparing the recent increases to the spring suggests that the underlying situation might be significantly less severe than generally believed.
TESTING: See notes on chart.
Despite numerous issues relating to testing, we will treat the data as accurate here so as to err on the side of caution & good faith. This should give us a worst case picture, with the reality being likely somewhat milder.
While clearly this is only a "best guess" figure, we can still conduct a rough analysis, leading to an interesting conclusion.
10% of world population ~ 750M
Covid-19 deaths to date ~ 1M
Implied IFR = 1/750 = ~ 0.13%
(IFR = Infection Fatality Rate)
An IFR of ~0.13% is almost an order of magnitude lower than the ~1% values seen in much of the predictive modelling that has been used to guide policy, lockdown decisions etc. (E.g. ICL used 0.9% for UK in March).
Even for a rough estimate, this is a significant difference.
ANALYSIS OF SARS-CoV-2 GROWTH ILLUSTRATION PRESENTED AT VALLANCE-WHITTY DOWNING STREET BRIEFING ON 21 SEP 2020
Implied CFR appears to be >50% lower than IFR used by ICL in March, suggesting new cases in red area would lead to ~2,000 deaths (~5% of spring total).
[26 Sep 2020v1]
The red area would contain a total of ~500,000 new cases.
How many deaths would be expected to occur as a result?
PV commented that, by mid October, there might be 50,000 new cases per day & that this would be expected to lead, a month or so later, to 200 plus deaths per day.
This implies a Case Fatality Rate of approx:
CFR = 200 / 50,000 = ~ 0.4%.
Since not all infections are detected, the Infection Fatality Rate (IFR) will be lower still.
This ~0.4% CFR is, however, in itself 50%+ lower than the 0.9% IFR used in ICL’s March paper & modelling.