The IMF's metric (without adjustments) suggested that Turkey had a slightly stronger reserve position that China going into 2020. Which is absurd.
(and yes, I do read the details of the IMF's ESR!)
The reason is simple: measures of reserve need based on broad money (m2) imply that countries with big domestic deposit bases (China, Korea and the like) need a ton of reserves, while countries with small banking systems (like Argentina) need far fewer
But the countries with small banking systems tend to have trouble financing fiscal deficits or rapid credit growth domestically, and often end up having current account deficits and lots external debt. In practice they need more not fewer reserves than the big surplus countries
Countries with relatively small banking systems (modest m2 to GDP) tend to have large amounts of short-term debt ...
Turkey and Argentina are cases in point. I believe their reserve need is a lot closer to reserves v STD than reserves v M2!
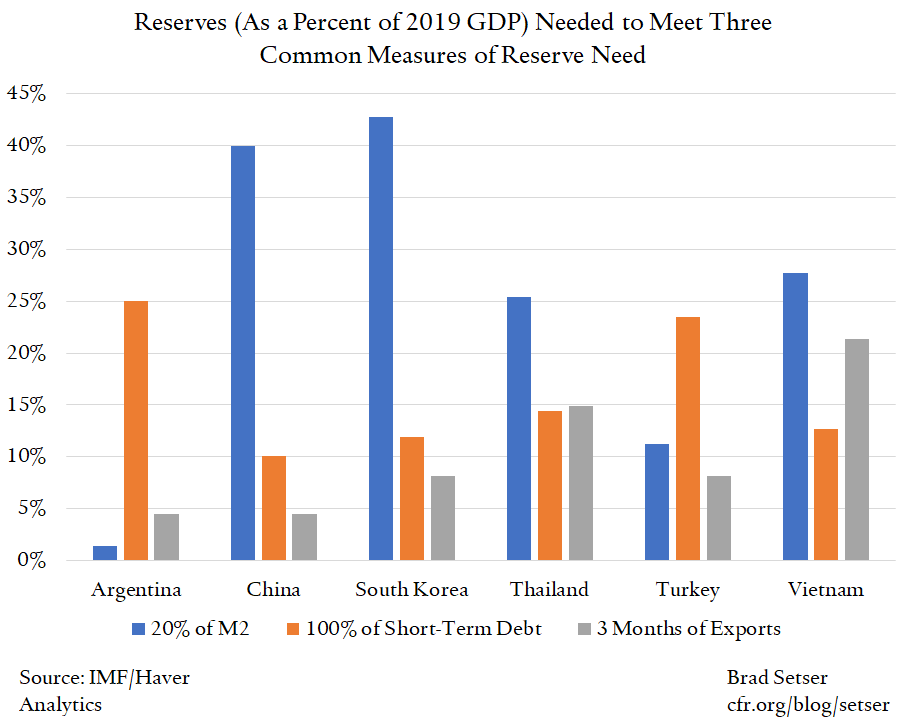
So the IMF's composite indicator (by blending two indicators that are often inversely correlated) muddies up any strong signal --
And when it comes to assessing vulnerabilities, I think you really need to isolate the strong signals.
And because countries with large banking systems with lots of domestic currency deposits (a high m2 to GDP) tend to run external surpluses and countries with small banking systems tend to run deficits ...
The IMF's metric systematically raises the estimated reserve need of BoP surplus countries while systematically lowering the estimated reserve need of BoP deficit countries.
That is basically backwards. Deficit countries actually are the ones who need more reserves.
This is in fact an intellectual hill that I am willing to die on ...
The crazy China v Turkey result highlights a systemic problem in the current metric.
• • •
Missing some Tweet in this thread? You can try to
force a refresh
A bit more on global debt issues, spurred by the @petersgoodman article.
As noted in the NYT, debt service deferral cannot be the only way to help low income countries, as not all low income countries are highly indebted.
Yet some countries really do have too much debt
1/x
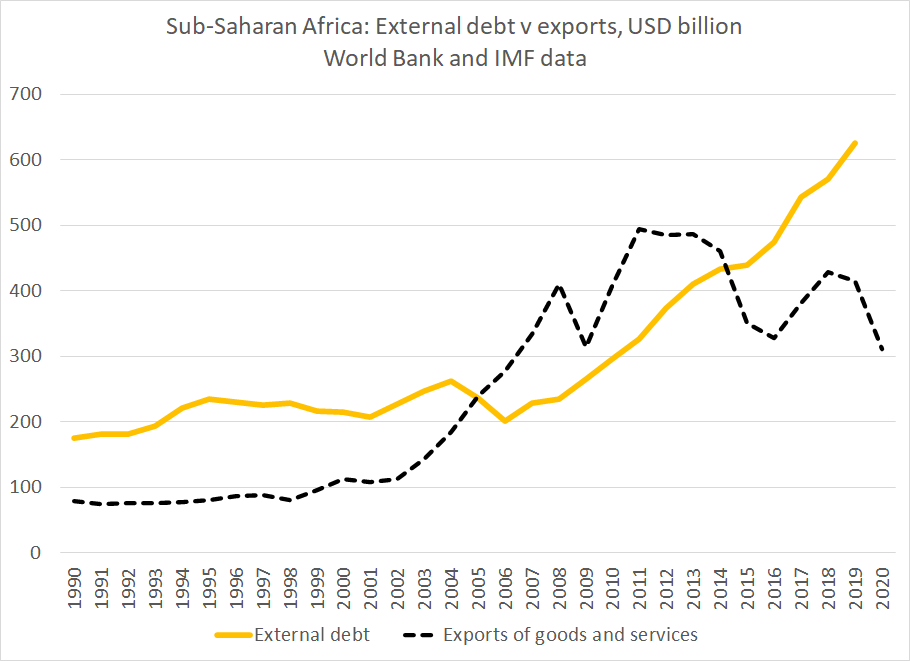
As the chart above shows, African countries borrowed heavily between 2010 and 2019 -- so external debt, net of reserves, rose from around $100b to over $400b ...
That's a problem now, as exports (needed to repay external debt) are down. External debt is now 2x exports
2/x
And since most of the new debt has come from Chinese policy banks and the bond market not traditional bilateral lenders or the MDBs, it carries a fairly high (for Africa) interest rate. Interest payments are rising faster than total debt
The New York Times (@petersgoodman) highlights how the global financial response to the pandemic, to date, has fallen short of providing the financial support low income countries need to cope effectively with the shock
Deferring debts owed to bilateral creditors was always going to only be a small part of the solution, but especially if China deemed key institutions like the CDB to be "private."
It was thus a mistake to make the DSSI the central mechanism for providing pandemic support
2/x
Only about $5b of the $30b in non-MDB debt coming due in 2020 will be rescheduled; the initiative has failed even on its own terms.
And since debt burdens aren't uniformly distributed, even a broad DSSI limited to bilateral creditors would not have provided enough to most
... "currency traders sense the hand of the state, albeit more discreet than in the past. “My guess is that the central bank now has special trading accounts at the state banks" ...
I have long thought that you can get a more accurate picture of what China is really doing by adding the net foreign assets of the state banks to the PBOC's reported (CNY balance sheet) foreign exchange reserves -- which have indeed been a bit too steady for the last year +
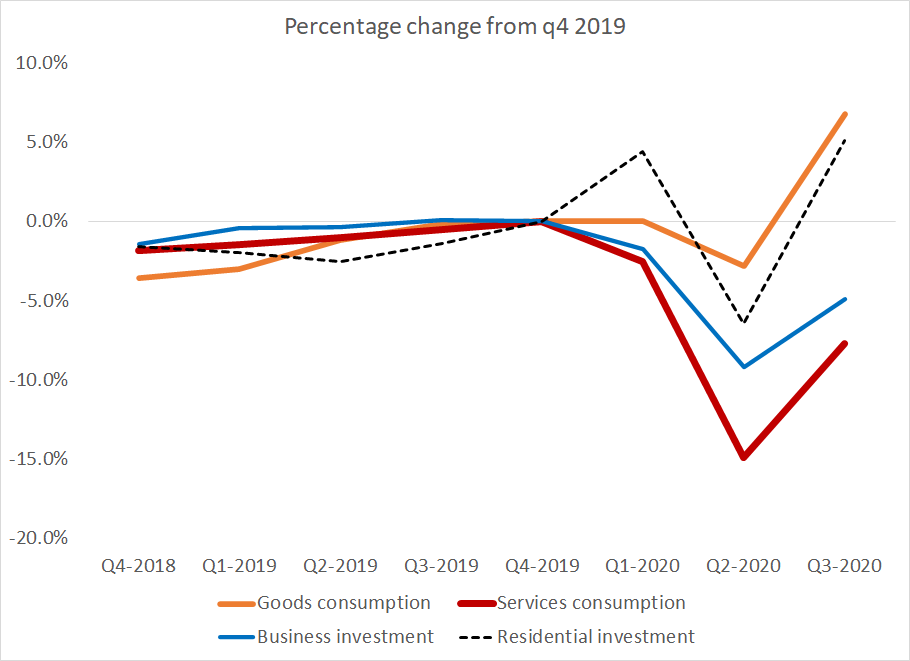
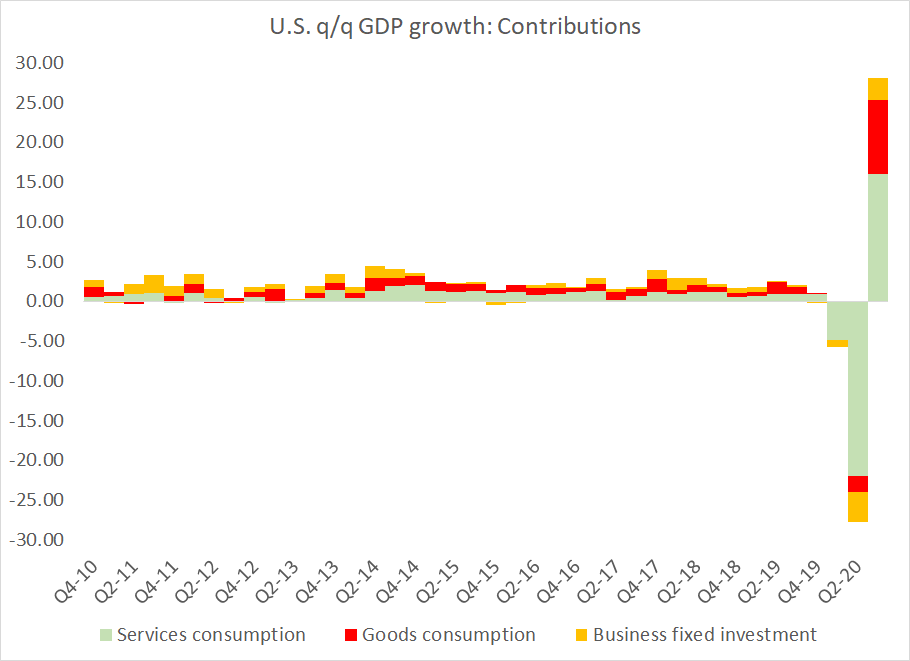
Today's GDP data obviously has gotten its share of coverage -- but I did want to highlight now unusual the downturn in q2 and partial recovery in q3 are. The downturn was led by services (usually the most stable component), and services are lagging the broader recovery
1/x
All this is looks totally crazy in the (annualized) contributions data, as, well, data wasn't designed for these kinds of swings.
But it is clear that goods consumption led the recovery
2/x
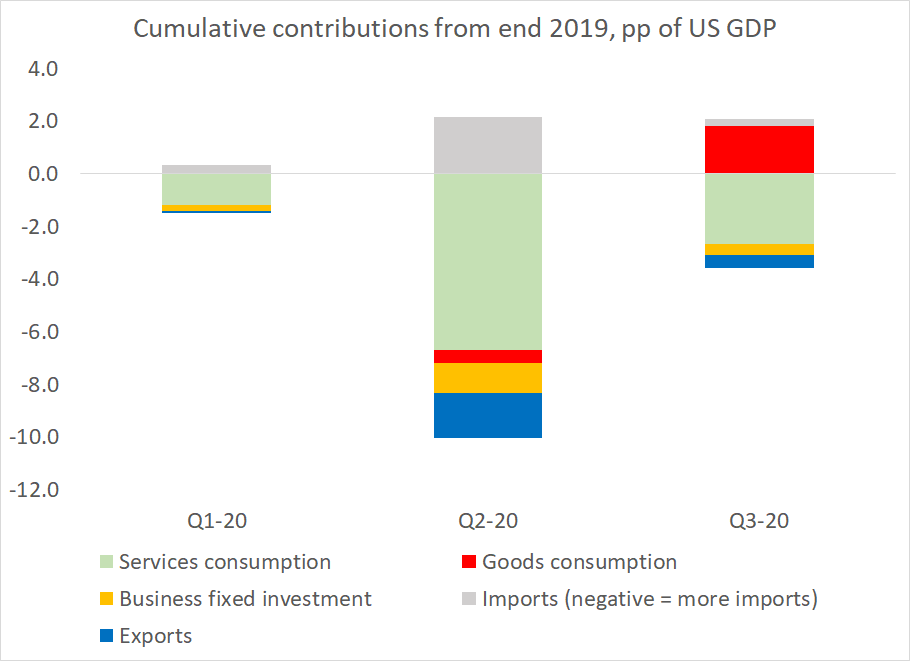
I de-annualized the data to put it on a more reasonable scale over the last year. Goods consumption is now 1.8 pp of US GDP higher than in q4 2019. Services consumption is down 2.7 pp of GDP
Also please note that the numbers here are cumulative loans not current exposures. At the same time, the WB numbers on exposures miss a lot of project finance.
Another important point -- both China and bond holders have lent to a (subset) of African countries at higher rates than the MDBs/ the traditional bilateral creditors. So the interest bill for those countries that have borrowed has increased faster than the stock of debt
2/x
A chart from a recent report by the Group of Thirty that (hopefully) highlights how not all low income countries are in the same position
(higher numbers on both the x and y axis are bad ... )
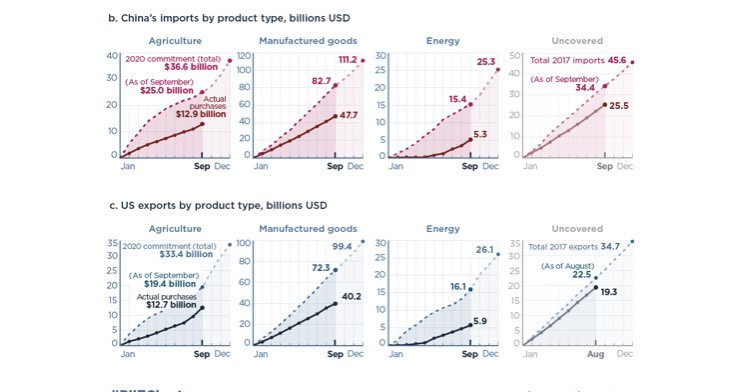
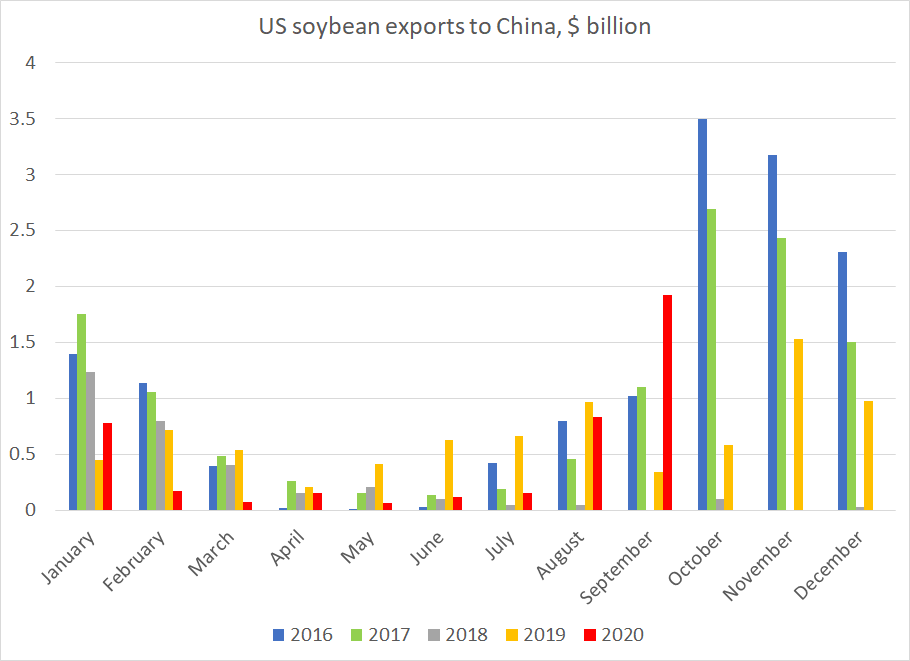
My (more modest) seasonal adjustment looks at the monthly data. The 'beans numbers were (as expected) solid. September basically made up for a weak start of the year. I hear the 'bean harvest came in early, and supplies in Brazil are by all accounts tight
2/x
Bean exports should top the 2017 base given the orders data USTR highlighted and current bean prices. Topping 2016 may be harder ...
(But don't forget 2018 -- the empty bar there isn't an accident; China showed that its state import companies control the market)
3/x