Interesting to compare Colorado and Ireland.

Ireland 5 million
Colorado 5.8 million

Ireland 1,917 C19 deaths
Colorado 2,292 C19 deaths

But the most intriguing part is comparing their Covid curves.

Read on.

1/12
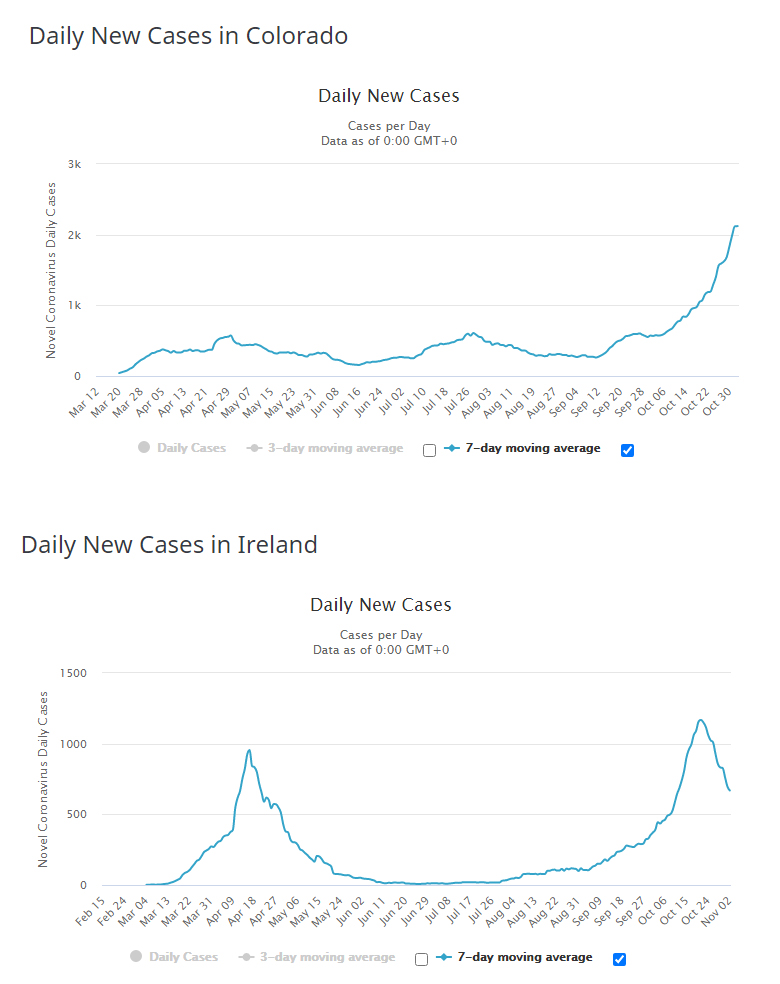
First look at cases. Ireland's cases started growing in early September and they seemed to have peaked on about Oct 20 (remember this date).

Colorado turned upward about about a week later, paused and then had fast growth.

2/12
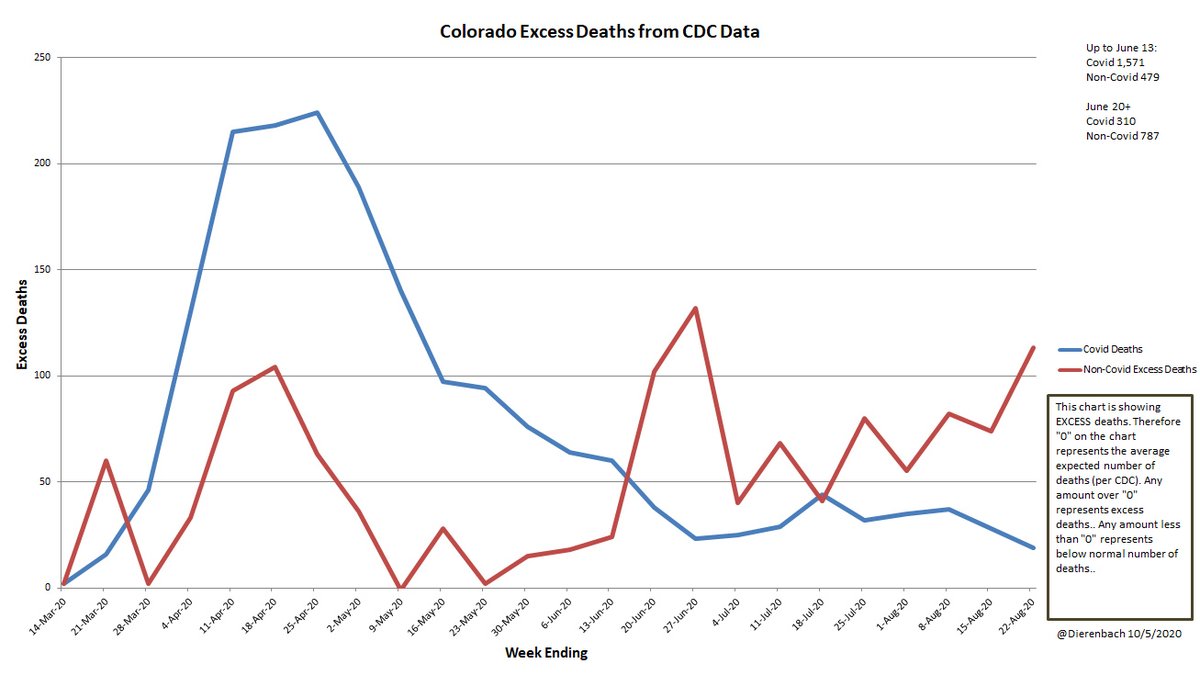
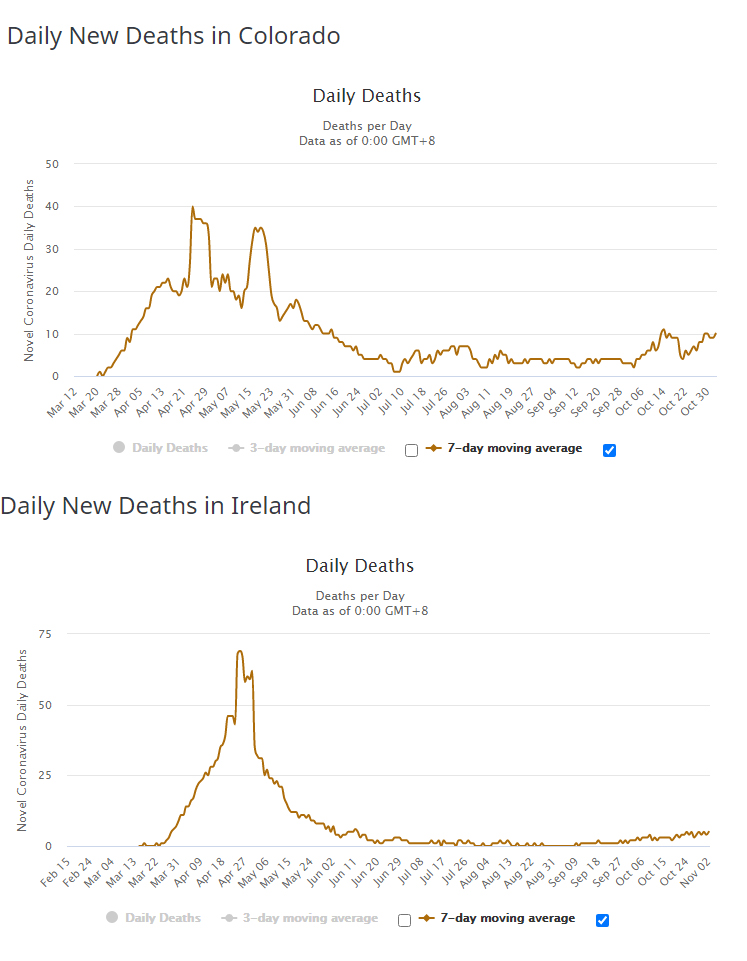
Next look at deaths. Both Colorado and Ireland had peak fatalities in late April.

Note that Ireland, like Colorado, hasn't seen a spike in deaths comparable to the April spike. This seems to be a common occurrence.

3/12
In Ireland, why did cases turn downward on October 20?

I would argue the natural course of the disease. Others argue it's the harsher lockdowns imposed by Ireland on - you guessed it - October 20.

4/12

But infections have a median 5 day delay between infection and symptoms, so an instant biological effect seems unlikely.

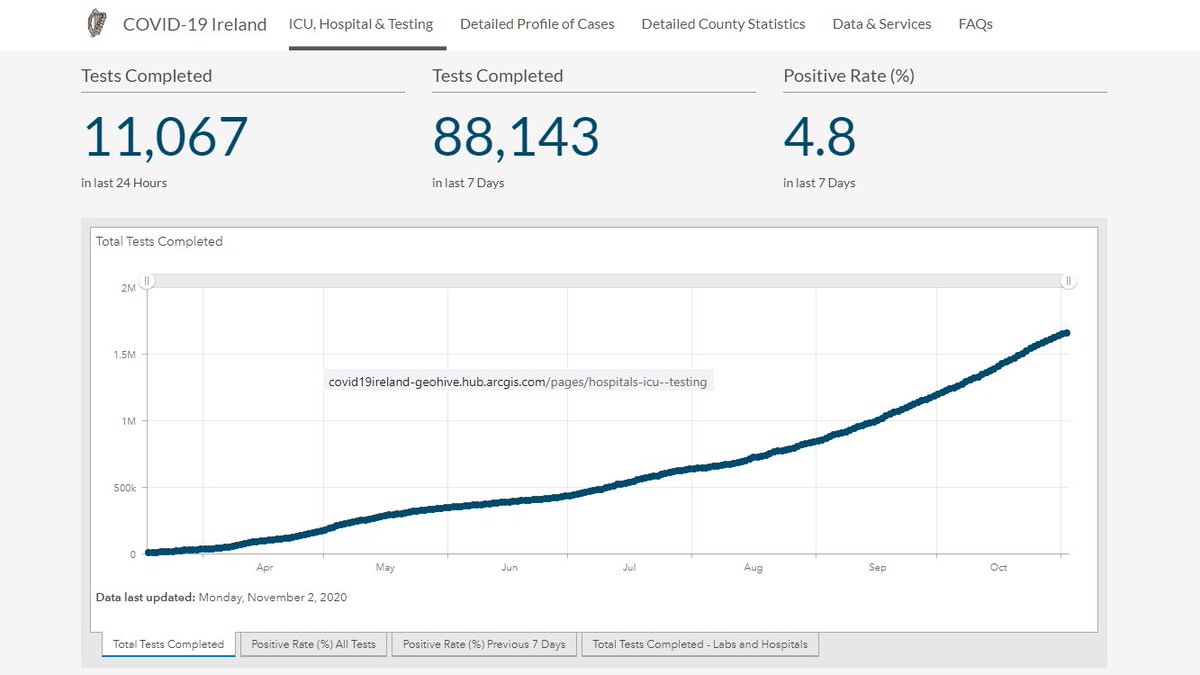
Also, in Ireland testing did not immediately wane due to lockdown, so it doesn't seem to be a testing artifact.

5/12
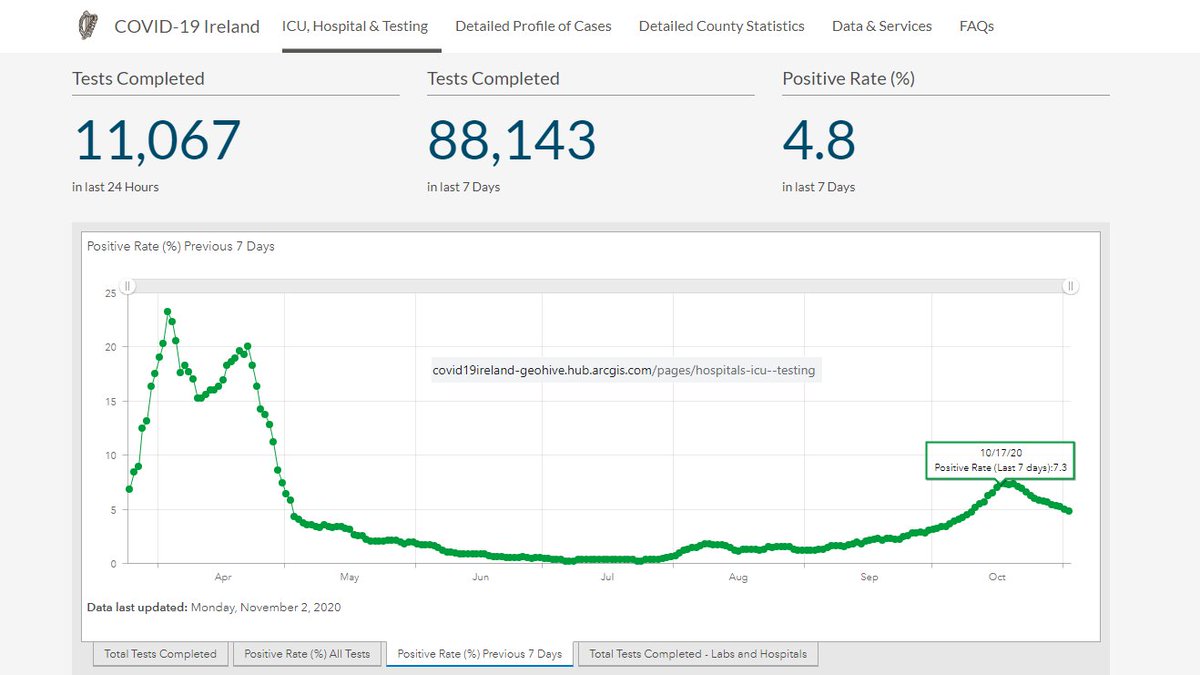
And Positivity in Ireland plateaued a couple of days before lockdown.

6/12
My point is: Colorado needs to hold on & NOT lockdown. Ireland is real world evidence out there that Covid doesn't race uncontrolled for long. Ireland saw its peak at about 1,200 cases/day after about 2 months of growth. If CO follows suit, we could see a peak very soon.

7/12
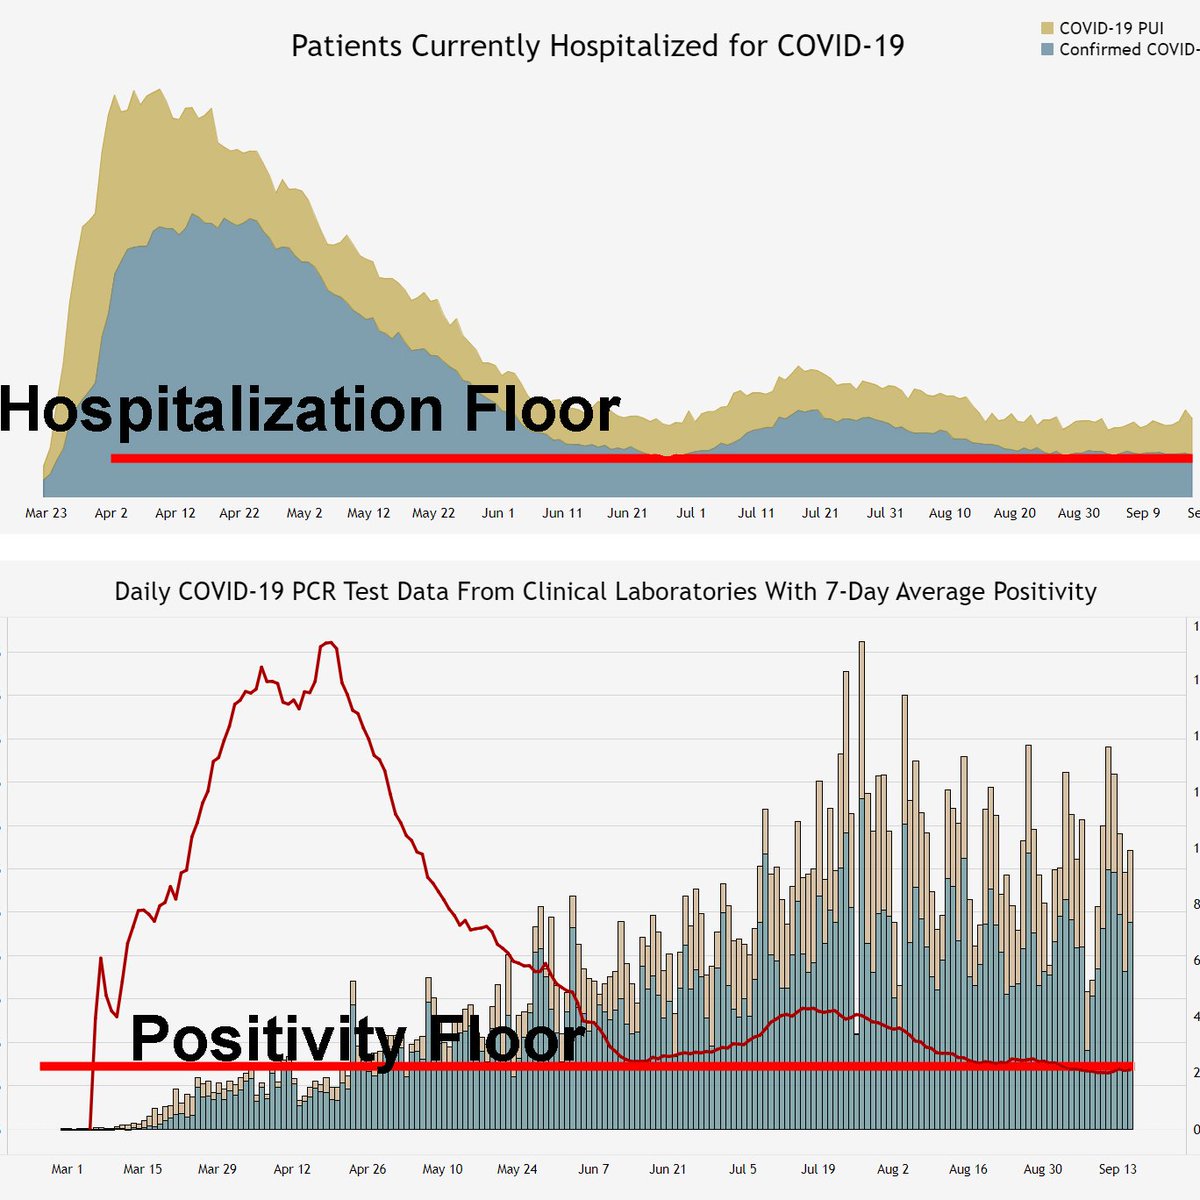
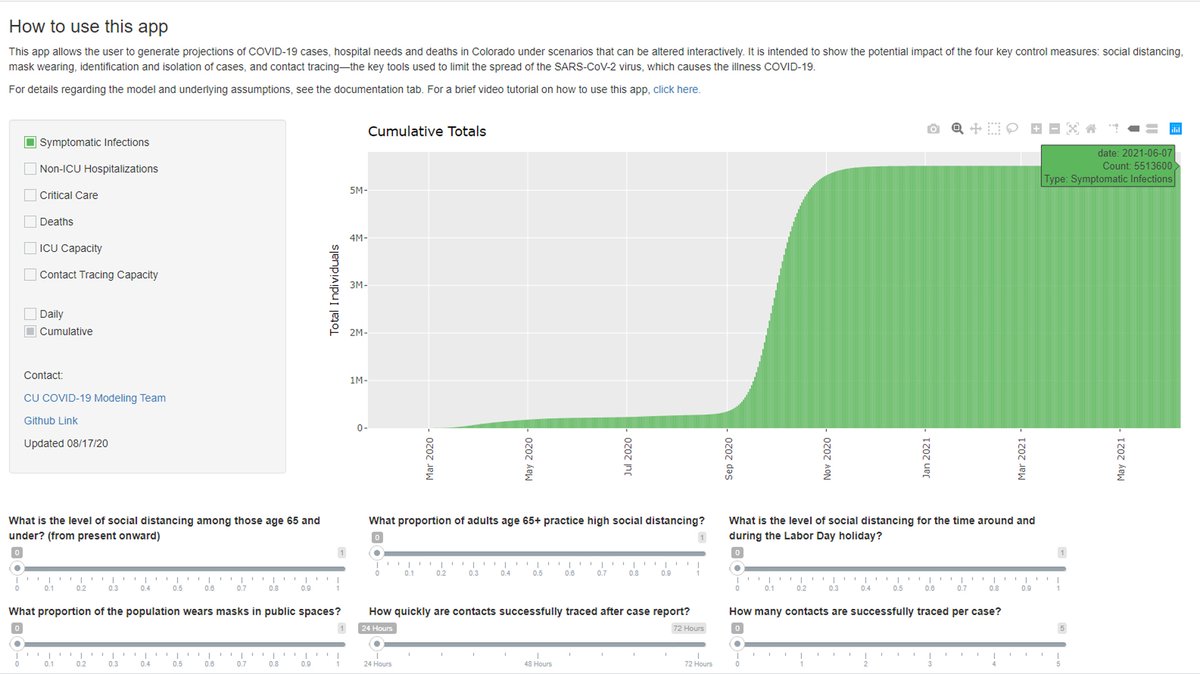
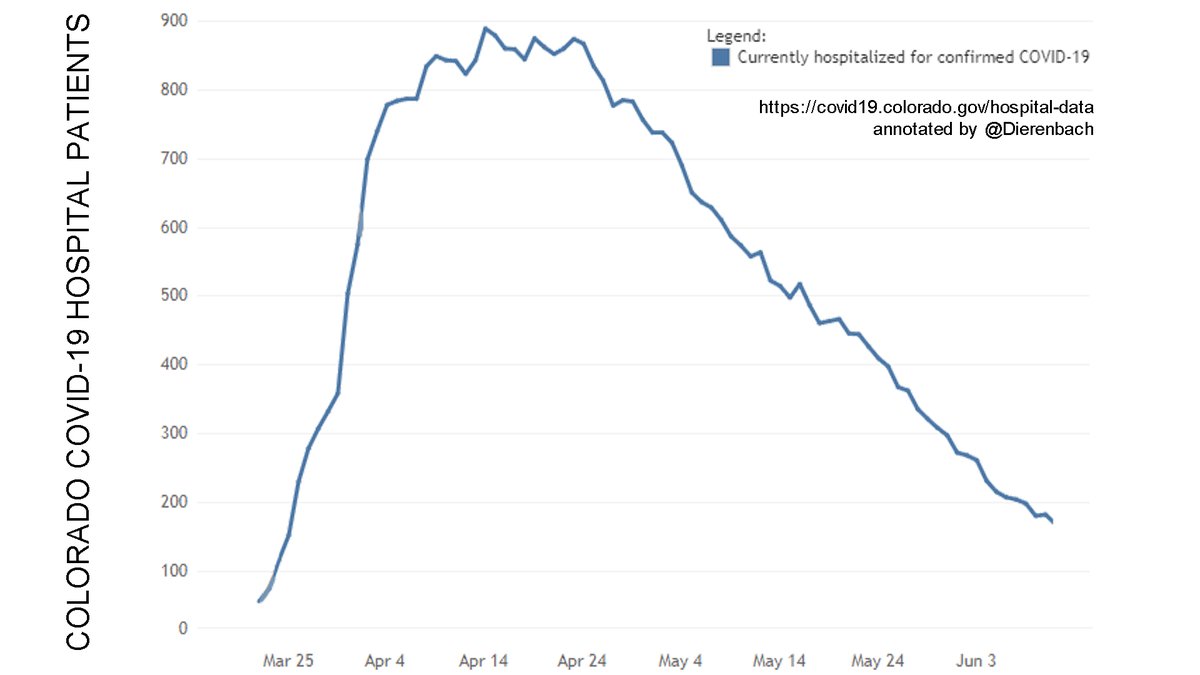
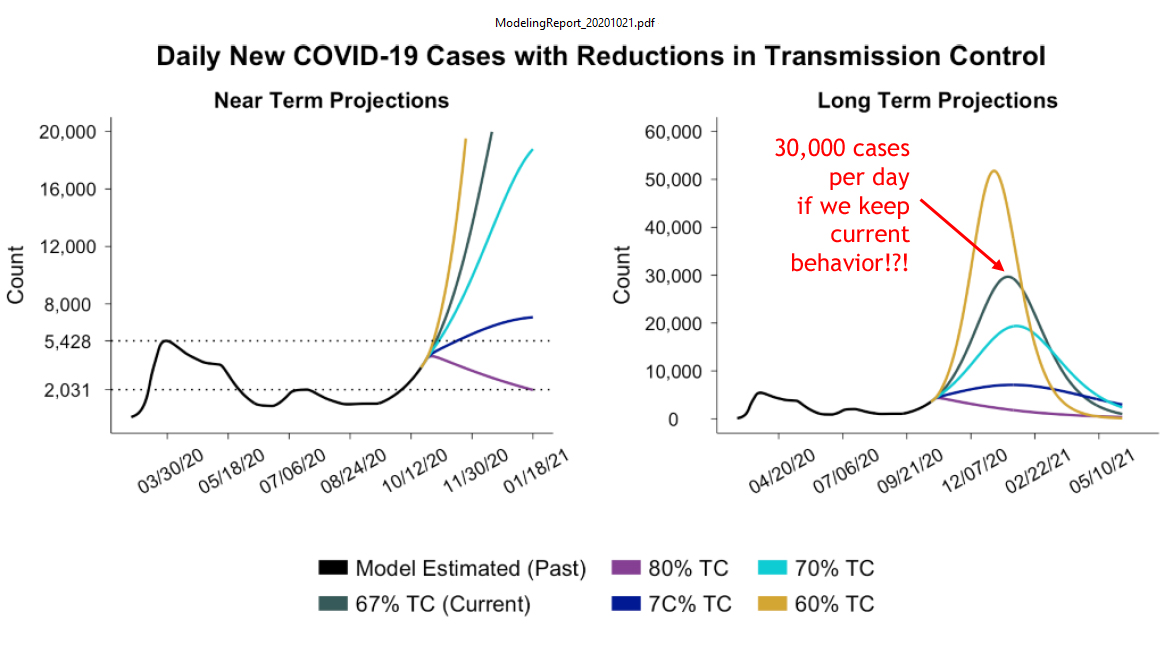
Covid-19 Modeling Group predicts we'll hit 30,000 infections/day (15x current level!). I value observations over modeling & Ireland tells us peak may be close. We need to urge @GovofCO & @CDPHE to not lockdown. CO hosp capacity is manageable & we're not seeing April-like deaths.
A nightmare scenario is we enter lockdown, cases turn downward as part of the natural process, but people become convinced the lockdowns caused the downturn, and we remain too afraid to open back up. This is what happened to CO over the summer when we could have opened more. 9/12
In June in Colorado, Covid hospitalizations and deaths went down, not because of lockdowns, but because of seasonality. We could have spent the summer freer and building resistance that would have lowered the intensity of the spike we're seeing now.

10/12
@GovofCO @CDPHE and Colorado modelers think any change in Covid is solely due to our behavior.

They never speak of the virus's behavior changing.

But pattern of changing with seasons is seen worldwide, whether you lockdown hard (Peru, Italy) or soft (Sweden). Virus gonna virus.
A lockdown now would do far more harm than good. It would compound the tragedy of Covid with the tragedy of another lockdown and the additional deaths, despair, loss of quality of life, and loss of education of our children that lockdowns bring.

Tell @GovofCO No More Lockdowns!

• • •

Missing some Tweet in this thread? You can try to force a refresh
 

Keep Current with Karl Dierenbach

Karl Dierenbach Profile picture

Stay in touch and get notified when new unrolls are available from this author!

Read all threads

This Thread may be Removed Anytime!

PDF

Twitter may remove this content at anytime! Save it as PDF for later use!

Try unrolling a thread yourself!

how to unroll video
  1. Follow @ThreadReaderApp to mention us!

  2. From a Twitter thread mention us with a keyword "unroll"
@threadreaderapp unroll

Practice here first or read more on our help page!

More from @Dierenbach

25 Oct
Hi @Jendrite, I read through this article you tweeted to me. It was long and full of questionable logic. I did read it all and considered its arguments and evidence and remain thoroughly unconvinced that Sweden is a disaster.

1/1,000

time.com/5899432/sweden…
To the contrary, like the recent WHO official, I believe Sweden was the model. Since I read it and wrote down my thoughts, I figure I might as well post them in a too-long tweet thread that nobody will probably ever read, but that’s how I roll.

2/1,000
First, Sweden isn’t 12th, they are 14th by the standard of the article. This is because in the two weeks since the article was published, Sweden’s deaths per million has hardly moved while they were passed by Panama and Colombia.
Read 28 tweets
5 Oct
Colorado is committing suicide.

CDC excess death data shows since June 20 more than twice as many Coloradans have died from @GovofCO @CDPHE and local restrictions than have died from Covid.

310 with Covid, 787 from response.

Literally suicide.

Details follow.

1/9
The CDC tracks the total number of deaths for the country and each state. Any deaths over the expected number of deaths are “excess” deaths.

Note: CDC data takes a while to collect and publish so data is through Aug 22.

Data here: cdc.gov/nchs/nvss/vsrr…

2/9
In CO, Covid caused a massive spike in excess deaths March-May. The BLUE line.

However, aside from Covid, CO saw above normal fatalities. The RED line.

The red line has exceeded the blue line since June 20. Since then, deaths from our response have exceeded Covid deaths.

3/9
Read 9 tweets
17 Sep
Here are more thoughts regarding the possibility of a Covid floor in Colorado. First, as a reminder, both positivity and hospitalizations seem to have found a steady-state floor and have been at the same levels for weeks.

STEADY-STATE LEVELS ARE NOT NATURAL!

1/8
Here's a chart showing last 10 years of visits for Influenza-like illnesses (ILI) in US. What's missing? Aside from perhaps mid-July to mid-Aug summer nadir, there are no steady-state periods where ILI visits remain unchanged for weeks. Such balance doesn’t occur naturally.

2/8
And it makes sense, either the flu is spreading or contracting. To strike a perfect balance where there are a steady-state significant number of cases week over week would be very difficult. Even Colorado’s modeling group agrees.

3/8
Read 8 tweets
27 Aug
Fun fact #2:

Colorado's COVID-19 Modeling Group estimates that if we stopped social distancing and stopped wearing masks, 13,370,000 Coloradans would become infected with Covid-19.

Which is weird, as Colorado only has 5,841,000 residents.

Read on.
1/10
1st the model. The COVID-19 Modeling Group (CMG) made an app of their model. @GovofCO Polis said it's the same data used in CMG reports to him. Here is a screenshot of the model with social distancing & mask wearing set to 0.

It results in 5,513,600 Symptomatic Infections
2/10
The model is available at cucovid19.shinyapps.io/colorado/

3/10
Read 10 tweets
23 Jul
It's now possible to determine the effect of the severe lockdowns in Colorado from March thru May:

Lockdown lowered CO’s peak covid hospitalizations from about 1,120 to the 888 CO saw on April 14.

It delayed about 40 deaths by 3 months.

That’s it. That's all.

Thread explains.
Covid is inevitable. We can’t stop it. We can only delay some effects if we react harshly and early. This was the whole premise of “Flatten the Curve”. FTC never implied infection/hospitalization/death avoidance, just delay.
Here’s how the effects of Colorado's lockdown can be determined.

This chart is the covid hospitalizations curve for Colorado from 3/22 to 6/11. It displays the classic Gompertz curve associated with a virus moving through a population.
Read 18 tweets

Did Thread Reader help you today?

Support us! We are indie developers!


This site is made by just two indie developers on a laptop doing marketing, support and development! Read more about the story.

Become a Premium Member ($3/month or $30/year) and get exclusive features!

Become Premium

Too expensive? Make a small donation by buying us coffee ($5) or help with server cost ($10)

Donate via Paypal Become our Patreon

Thank you for your support!

Follow Us on Twitter!