Lemme tell you a little about why I'm not putting much weight on prediction markets this election. The short version is that the main US market, @PredictIt, is structured in a way that allows big mis-pricings to persist.
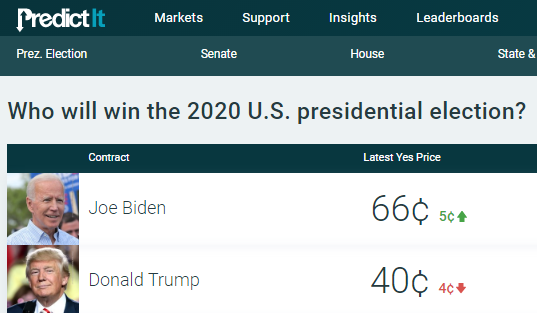
Right now, you can sell a share that pays $1 if Trump wins, for 40 cents. I would love to do that. But there are large transaction costs that get in the way, and they're so big that it would be wrong to infer that markets believe that Trump is anywhere near a 40% chance to win. 
Let's say that I'm willing sell 1000 of these shares, effectively buying "Not Trump" shares for 60 cents. If so, I'll lose $600 if Trump wins. You might think that I stand to win $400 if Trump loses, but that's not quite the whole story, because transaction costs are a big deal.
If Trump loses the election, I win my bet, but I have to pay 10% on my $400 in winnings, so now I'm down to $360. Then I have to pay 5% on all withdrawals, so if I want to withdraw the initial $600 I put in, plus the $360 I won, then that's another $48 in fees.
All told, I stand to lose $600, and if I win, I'll get $912 back, for a gain of $312. But these winnings are taxable, and @PredictIt will issue a 1099 to any US resident who wins more than $600/year. If my marginal tax rate is 35%, then I only get to keep $202.8 of my winnings.
Do the math, and realize that a bet that I could lose $600 on, and gain $202.8 on, is only worth it if I believe Trump to be less than a 25% chance to win (assuming risk neutrality). So a market price of 40 is consistent with a 25% chance of Trump winning.
Now add hassle and trading limits. At PredictIt, I can only buy $850 worth of shares (which is 1416 Not Trump shares at $0.60 each).
If I thought Trump was actually a 20% chance, my expected return is 1416 shares x (20% x lose $0.60 per share + 80% x win $0.2028 per share) = $60.
If I thought Trump was actually a 20% chance, my expected return is 1416 shares x (20% x lose $0.60 per share + 80% x win $0.2028 per share) = $60.
At the end of the day, savvy bettors aren't going to bother with all this hassle for $60 in expected profit.
So a major mis-pricing can easily persist. And that'a big part of my story for why the @PredictIt odds just don't look credible to me, and why that can be an equilibrium.
So a major mis-pricing can easily persist. And that'a big part of my story for why the @PredictIt odds just don't look credible to me, and why that can be an equilibrium.
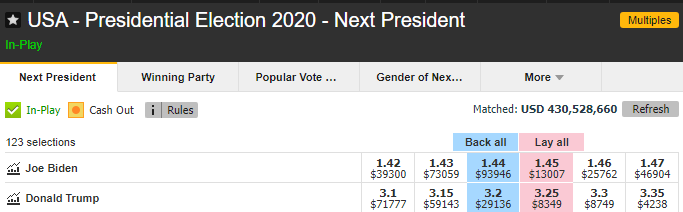
I'm more sympathetic to @Betfair, which rates Trump a 31% chance to win. That's still surprisingly pro-Trump, and there have been hundreds of millions bet in that market, and the distortions are much smaller.
Equally, Americans can't trade in the @Betfair market, which strikes me as problematic. Prediction markets work best when people are aggregating local knowledge. I'm not sure that's what European traders are doing.
https://twitter.com/JamesSurowiecki/status/1323734318901039107
I do think @Betfair will be useful for tracking the fluctuating fortunes of the candidates during the vote count. This is basically a math problem, and Europeans can do math as well as Americans! Think of it as operating a bit like a crowd-sourced "Needle."
Having said all this, it's clear that prediction markets rate Trump as more likely to win than most of the models do.
But if you want a markets-versus-models debate, this isn't a cycle with a well-functioning U.S. market, so it's not one where the markets are likely to shine.
But if you want a markets-versus-models debate, this isn't a cycle with a well-functioning U.S. market, so it's not one where the markets are likely to shine.
Finally, while much of this thread can explain some of the divergence between markets and models, much remains unexplained. Frankly, I'm a bit puzzled.
And while this thread gives you reasons to doubt that markets will perform well this time, who knows, they could!
And while this thread gives you reasons to doubt that markets will perform well this time, who knows, they could!
One more friction: At some point @PredictIt closes off its markets to new traders. So even if you wanted to correct the mis-pricing, you couldn't.
A market with binding limits on traders & their positions ends up being effectively a survey of its traders.
A market with binding limits on traders & their positions ends up being effectively a survey of its traders.
https://twitter.com/PredictIt/status/1323738470775402502
• • •
Missing some Tweet in this thread? You can try to
force a refresh