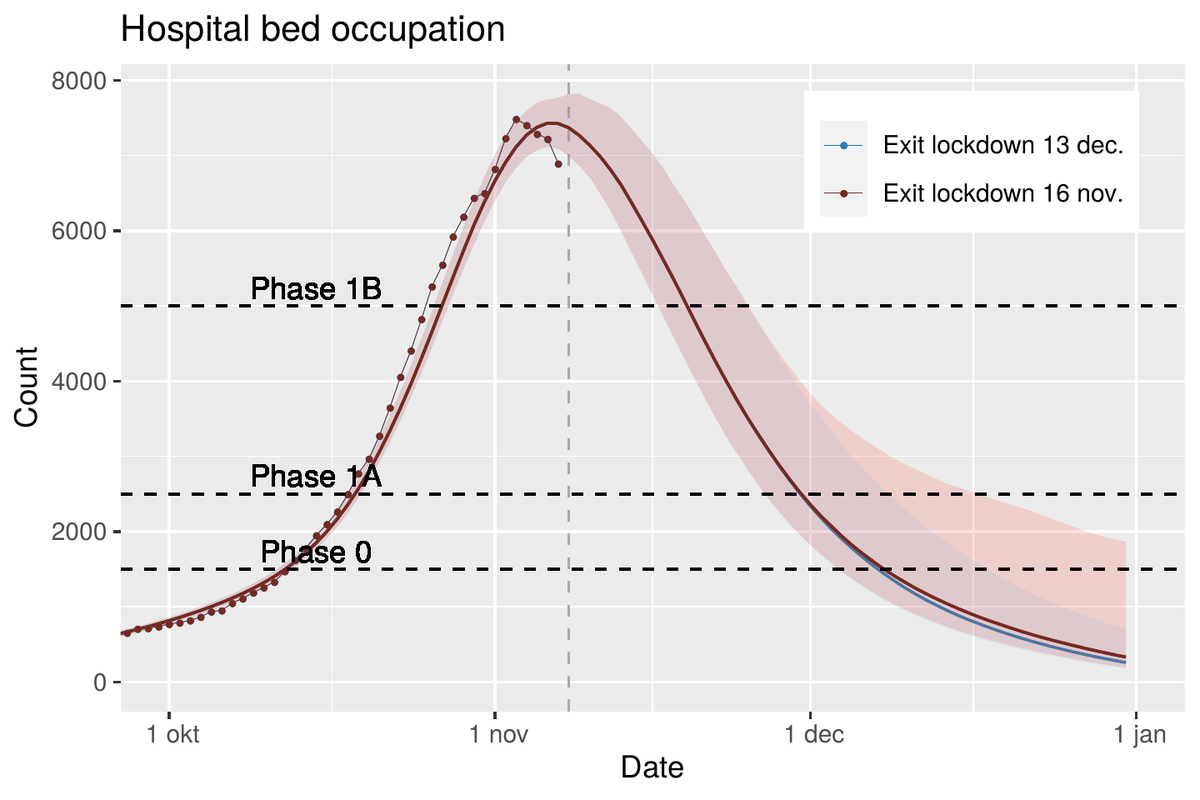
We zijn een week ver in de nieuwe lockdown. Dat betekent dat we vanaf deze week een effect mogen verwachten in de cijfers van besmettingen, en vanaf volgende week een impact op cijfers van hospitalisaties. Wat mogen we verwachten? 1/6
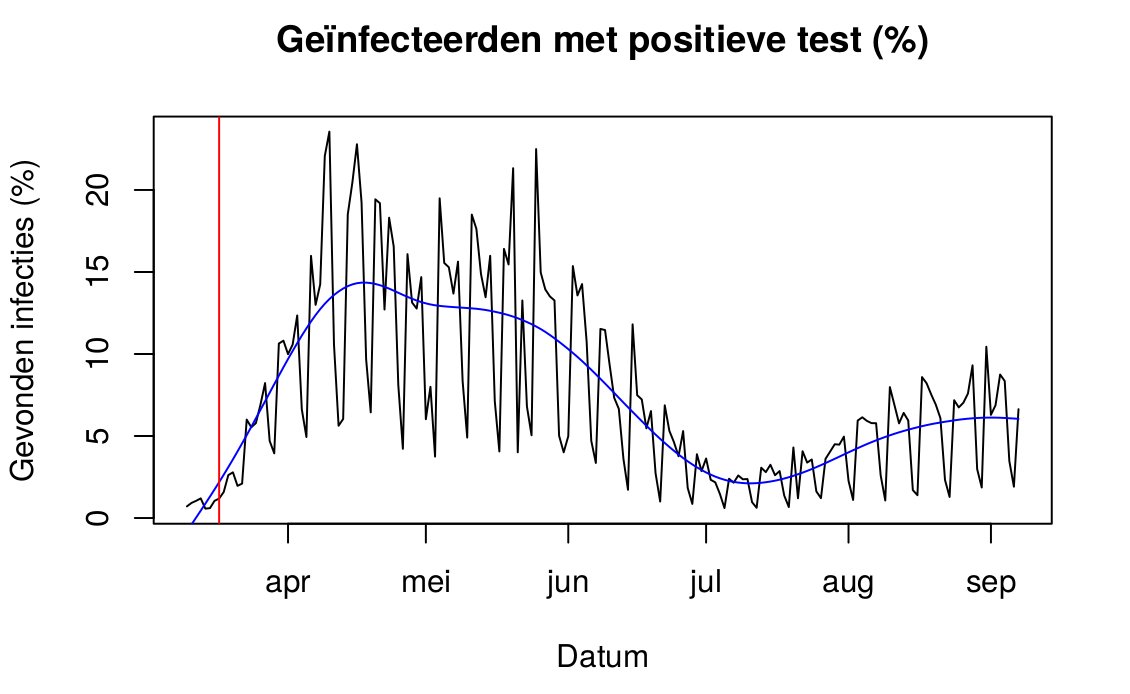
Hoe weten we dat maatregelen van de lockdown nog geen rol spelen in de cijfers nu? Voor de Belgische cijfers weten we dit uit modellen: de tijd van infectie tot test is gemiddeld +/- 8 dagen; van infectie tot hospitalisatie is gemiddeld +/- 13 dagen. 2/6
Nog vóór deze lockdown was de epidemie al aan het krimpen, met een reproductiegetal 0.6 - 0.8 (gjbex.github.io/DSI_UHasselt_c… ibz-shiny.ethz.ch/covid-19-re/). Dat is vergelijkbaar, of zelfs onder, het reproductiegetal tijdens de lockdown van maart. 3/6
We kunnen verwachten dat de lockdown dit getal verder terugdringt tot 0.4 - 0.5. Ter vergelijking nemen we
een scenario waarbij de lockdown al wordt opgegeven
na de verlengde herfstvakantie op 16 november, waarna we zouden terugvallen op de maatregelen van 19 oktober. 4/6
De lockdown is er om ziekenhuizen te vrijwaren. Het aanhouden van de lockdown zorgt voor een snellere daling vanaf december. Indien we de lockdown zouden opheffen vanaf 16/11, zal dit voor ziekenhuizen wellicht weinig verschil maken. 5/6
Als de lockdown dient om ziekenhuizen te vrijwaren is het logisch om om deze op te heffen zodra de er voldoende zekerheid is over de inschatting van het reproductiegetal vóór de lockdown, door een verdere daling van de hospitalisatiecijfers deze week. 6/6

• • •

Missing some Tweet in this thread? You can try to force a refresh
 

Keep Current with houter

houter Profile picture

Stay in touch and get notified when new unrolls are available from this author!

Read all threads

This Thread may be Removed Anytime!

PDF

Twitter may remove this content at anytime! Save it as PDF for later use!

Try unrolling a thread yourself!

how to unroll video
  1. Follow @ThreadReaderApp to mention us!

  2. From a Twitter thread mention us with a keyword "unroll"
@threadreaderapp unroll

Practice here first or read more on our help page!

More from @houterkabouter

8 Nov
Indien deze lockdown dient om de curves om te buigen, dan schiet ze wellicht haar doel voorbij, en in dat geval moet overwogen worden om deze veel sneller dan voorzien terug te draaien, gezien de grote maatschappelijke impact ervan.
Het is ondertussen duidelijk dat besmettingscijfers (zelfs >65j) spectaculair dalen, hospitalisatie cijfers dalen, en overlijdens wellicht deze week de daling zullen inzetten. Weinig spannend dus.
Modellen kunnen nauwelijks de snelle daling in besmettingscijfers bijhouden, zelfs na correctie voor nieuwe test strategie. 👇
Read 11 tweets
5 Oct
1/6 Wat Zweden was voor zij die de lockdown in maart overdreven vonden, lijkt Duitsland nu voor zij die de aanpak van onze overheid (en bij uitbreiding, alle andere Westerse landen) te laks vinden.

In beide gevallen is de waarheid niet zo spectulair.
2/6 Wat Zweden betreft tijdens de eerste golf: ook daar was er een gedragswijziging (zie Google mobility data) die Re tot dicht bij of net onder 1 bracht. Zweden zijn van nature misschien ook iets 'afstandelijker'. medrxiv.org/content/10.110… ImageImage
3/6 Wat betreft Duitsland: het wezenlijke verschil tussen de aanpak van Duitsland en andere Europese landen was in februari. Toen deed Duitsland een intensieve en succesvolle test, trace & contain waardoor initiële uitbraken werden de kiem ingesmoord.
ourworldindata.org/covid-exemplar…
Read 6 tweets
28 Sep
1/ Re estimate: 1.33 (1.26 - 1.42). Estimated Belgians currently infected: 120K (90K - 190K) <65y, 2200 (1400 - 3000) >65y. At this rate (continuing our current behaviour), estimated COVID-19 deaths until Jan 1 2021: 5000 (3000 - 8000). #COVID19be
2/ Zoomed in version. I added two new charts: estimated age of infected population and estimated IFR (as a result of this change in demography).
3/ The model estimates that the IFR of those infected changed from 1% in March/April to 0.1% now. This seems drastic but can be explained by a relatively modest change in demography of those infected: from an average 40y (+/- 40y) then, to an average 30y (+/- 30y) now.
Read 5 tweets
22 Sep
1/6 New model (details below), estimating the Belgian epidemic from hospitalization, death (and case) data. Current Re estimate = 1.4 (1.3 - 1.5). Estimated deaths, continuing current behaviour, until Jan 2021: 1900 (1300 - 2700), with a peak of 300 hospitalizations per day. Image
2/6 Zoomed in version. This model more reliably fits both deaths (within two age-groups) and hospitalization data, something which recent model fits didn't manage. Image
3/6 Until now, the model assumed that the hospitalization rate (HR) was proportional to IFR, but that assumption wasn't valid. The figure below shows estimates based on the Belgian epidemic until June 14th, using covid-19.sciensano.be/sites/default/… Image
Read 6 tweets
15 Sep
We are again approaching peak corona panic, but there are two good reasons to stay vigilant but calm.

1) There is no urgency to react.
2) There may be no need to react, provided we keep avoiding (close) contacts between generations and within older generations.

1/7
Starting with the second point: this model predicts that even if we do nothing, the evolution of the epidemic will be "benign". Cases will rise to high levels, but deaths and hospitalizations are limited.

2/7

Sounds familiar? That is what is happening in France and Spain, who are ahead of us. Even if one distrusts this model (as you should with any model), we can take advantage of that. If things get out of hand there, we still have time to react here.

3/7 Image
Read 7 tweets
11 Sep
New model reconciling deaths, hospitalizations, and cases (in decreasing order of weight) and estimated 50000 (30000 - 80000) Belgians infected <65y; 200 (100 - 350) >65y. Estimated Re since Sept 1 is 1.2 (0.9 - 1.5). Current IFR ~ 0.07%. Around 5% of infections are found.

1/4 Image
Incidence of cases, hospitalizations and deaths are modelled in a similar way, by assuming that the rate for each is proportional to the age-specific IFR, which is directly estimated from data on deaths.

2/4 Image
Today a high number of cases are found. If we would have tested during the first wave as we did now, we would have found up to 5000 per day (upper right graph). We are finding far more infections now compared to March, but actually less than in April/May (!).

3/4 Image
Read 4 tweets

Did Thread Reader help you today?

Support us! We are indie developers!


This site is made by just two indie developers on a laptop doing marketing, support and development! Read more about the story.

Become a Premium Member ($3/month or $30/year) and get exclusive features!

Become Premium

Too expensive? Make a small donation by buying us coffee ($5) or help with server cost ($10)

Donate via Paypal Become our Patreon

Thank you for your support!

Follow Us on Twitter!