Comparison of SPI-M medium term projections for England hospitalisations/deaths and subsequent data has now been published (along with some model descriptions):
assets.publishing.service.gov.uk/government/upl… 1/
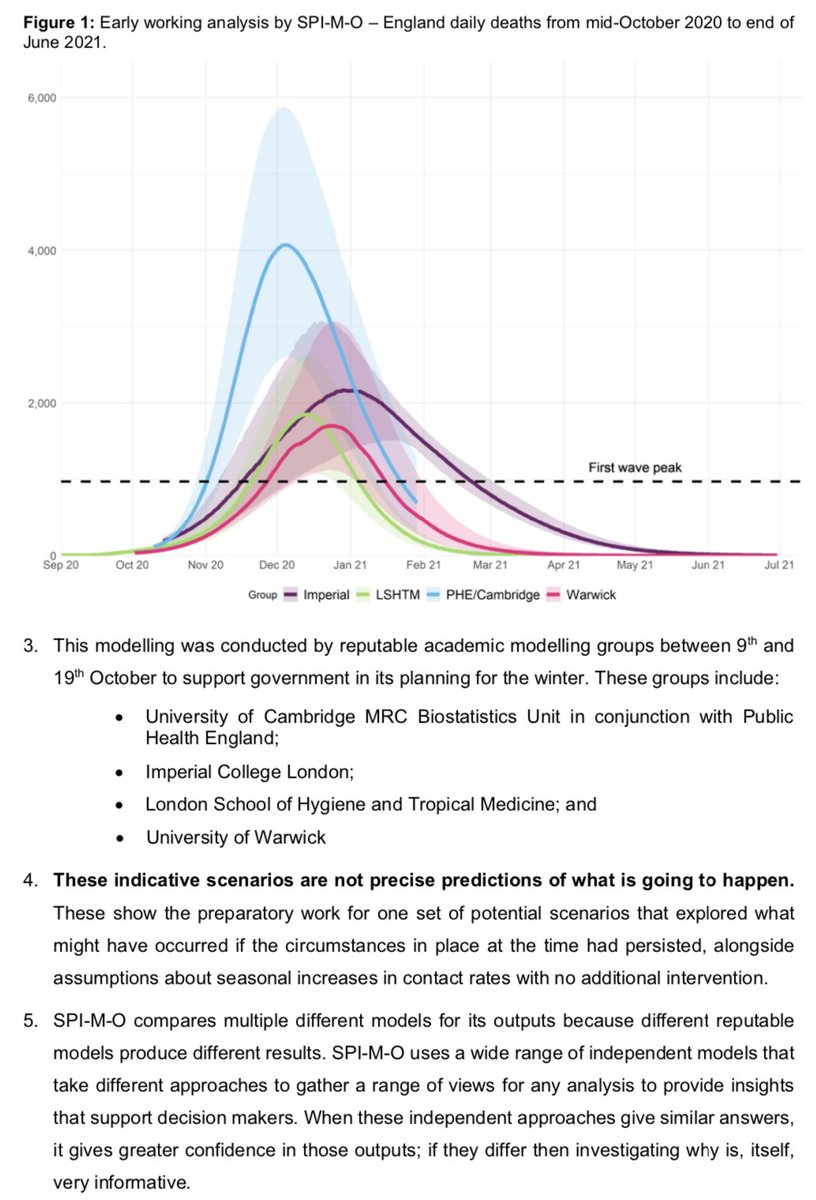
Additional context on that early working analysis also now available (noting that unlike above, these were *scenarios* to illustrate a reasonable worst case without further interventions, not forecasts): assets.publishing.service.gov.uk/government/upl… 2/
Finally, credit to my colleagues around the UK who have been working flat out on this sort of analysis for months (often around other full-time commitments) and who are still working as hard as they can to get more of their analysis/code out there.

• • •

Missing some Tweet in this thread? You can try to force a refresh
 

Keep Current with Adam Kucharski

Adam Kucharski Profile picture

Stay in touch and get notified when new unrolls are available from this author!

Read all threads

This Thread may be Removed Anytime!

PDF

Twitter may remove this content at anytime! Save it as PDF for later use!

Try unrolling a thread yourself!

how to unroll video
  1. Follow @ThreadReaderApp to mention us!

  2. From a Twitter thread mention us with a keyword "unroll"
@threadreaderapp unroll

Practice here first or read more on our help page!

More from @AdamJKucharski

2 Nov
I'm increasingly seeing people quote a single 'global' estimate of infection fatality risk (IFR) for SARS-CoV-2 & use this value to try and make conclusions about specific countries. But, of course, this is missing out a crucial aspect of risk... 1/
We've known since the early days of the pandemic that fatality risk is strongly dependent on age (as well as other factors), which means that estimates will depend on population structure and age group that gets infected. 2/
For example, Singapore has reported around 58k cases and 28 deaths, which would imply that less than 0.05% of local infections resulted in death. But lot of these infections were concentrated in groups of younger migrant workers, rather than the wider - and older - population. 3/
Read 6 tweets
31 Oct
Nobody wanted to see a repeat of the spring, with hospitalisations rising and stringent measures coming back in. But UK isn't in quite the same position as March, so here are some sources for medium-term optimism as we come into a difficult winter... 1/
First, UK now has far more testing capacity, with more becoming available (theguardian.com/world/2020/oct…). Everything needs to fit together much better to reduce transmission, but infrastructure should help create more control options than earlier in 2020: gov.uk/government/pub… 2/
Regardless of your views on best way forward, I hope we can agree that working to keep virus out of risk groups (& hence their contacts) is crucial. And to do this successfully, we need to know where infection is - and that means effective testing and tracing. 3/
Read 10 tweets
29 Oct
If epidemic growing, question isn’t really ‘are more restrictions needed?’ The question is ‘given restrictions will eventually have to come in, do you want to have COVID at a high or low level over winter?’ 1/

With almost daily 100k infections in England & growing (imperial.ac.uk/news/207534/co…), we'd eventually expect to see some effects of immunity. But even if restrictions introduced to keep R near 1, that infection level means can expect huge number of hospitalisations & deaths first. 2/
Getting to lower infection levels requires restrictions earlier, but opens up more targeted control options (more of which are becoming available, e.g. theguardian.com/world/2020/oct…), which could mean less disruption in longer term. 3/

Read 4 tweets
27 Oct
I’m seeing people share these kinds of plots on excess deaths to try and claim there isn’t COVID problem currently. But look at data for week 29 Mar 2020 - if this lagging metric had been used to drive action, nothing would've been done until *early April* (i.e. far too late) 1/
As anyone who’s worked on epidemics will tell you, there are imperfect data streams early on, and more conclusive data later. But as above shows, sitting around waiting for all the data is not an option in a fast moving outbreak. 2/2
(Source of above plot: cebm.net/covid-19/covid…)
Read 4 tweets
26 Oct
There are two main ways to estimate the reproduction number for SARS-CoV-2, and I'd like to discuss the one that doesn't get so much attention... 1/
Most reported R values use a 'top-down' method, which estimates R from the growth pattern in various surveillance datasets (e.g. ), but there is also a 'bottom-up' method, which my @cmmid_lshtm colleagues have been using to track R... 2/
The basic idea is that R depends on four components: duration of infectiousness; opportunities for transmission (i.e. contacts); transmission probability during each opportunity; and population susceptibility... 3/
Read 8 tweets
25 Oct
A common feature of a growing epidemic is that the % of cases detected by surveillance systems typically declines (just as the % detected typically increases as epidemics are brought under control)... 1/
In week ending 24 Sep, ONS estimated around 8,400 new infections per day in England (ons.gov.uk/peoplepopulati…). And on 24 Sep, the 7-day average for daily reported cases in UK was around 6,800. 2/
By week ending 16 Oct, ONS estimate was around 35,000 new infections per day in England (ons.gov.uk/peoplepopulati…), with 7-day average for UK cases by 16 Oct at around 18,500. 3/
Read 5 tweets

Did Thread Reader help you today?

Support us! We are indie developers!


This site is made by just two indie developers on a laptop doing marketing, support and development! Read more about the story.

Become a Premium Member ($3/month or $30/year) and get exclusive features!

Become Premium

Too expensive? Make a small donation by buying us coffee ($5) or help with server cost ($10)

Donate via Paypal Become our Patreon

Thank you for your support!

Follow Us on Twitter!