REACT1 round 7 interim update (13-24 Nov 2020):
We estimate that R has dropped < 1 (0.88 (0.86, 0.91)) during the second national lockdown.
Full preprint (not yet peer reviewed): imperial.ac.uk/medicine/resea…
More great work from @DrCWalters @eales96 @HaoweiWang7 @SRileyIDD
1/n
We estimate that R has dropped < 1 (0.88 (0.86, 0.91)) during the second national lockdown.
Full preprint (not yet peer reviewed): imperial.ac.uk/medicine/resea…
More great work from @DrCWalters @eales96 @HaoweiWang7 @SRileyIDD
1/n
Results
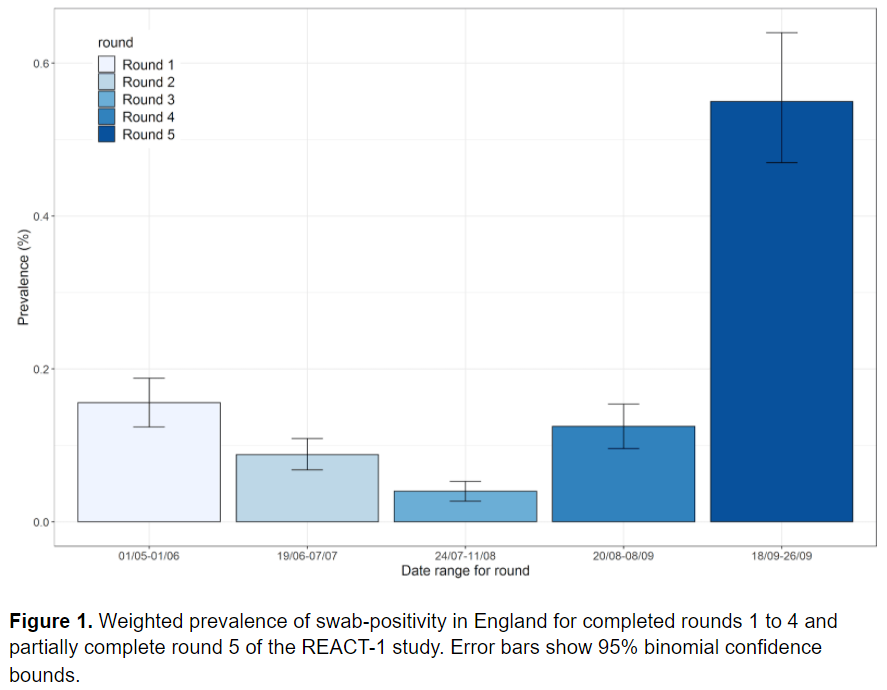
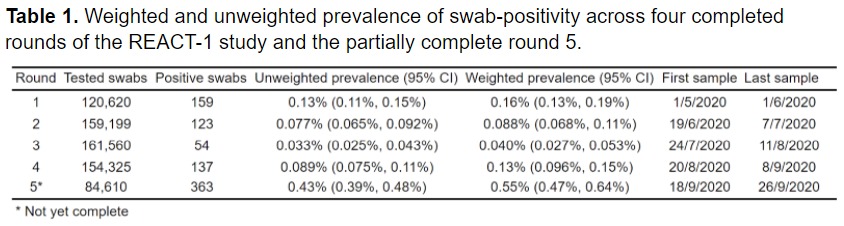
- We found 821 positives from 105,123 swabs
- Unweighted prevalence of 0.78% (95% CI, 0.73%, 0.84%)
- Weighted prevalence of 0.96% (0.87%, 1.05%)
- The weighted prevalence estimate was ~30% lower than that of 1.32% (1.20%, 1.45%) obtained in the second half of round 6
- We found 821 positives from 105,123 swabs
- Unweighted prevalence of 0.78% (95% CI, 0.73%, 0.84%)
- Weighted prevalence of 0.96% (0.87%, 1.05%)
- The weighted prevalence estimate was ~30% lower than that of 1.32% (1.20%, 1.45%) obtained in the second half of round 6

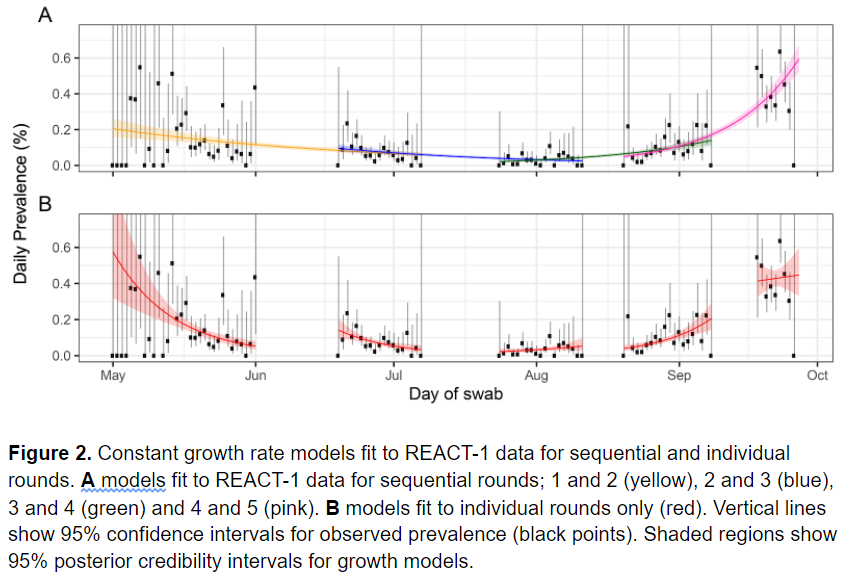
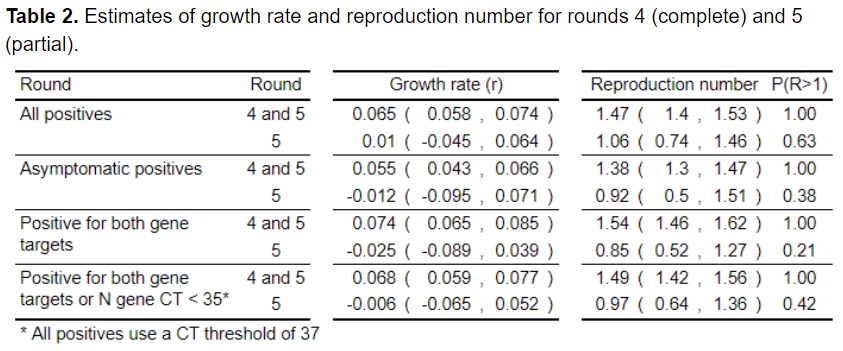
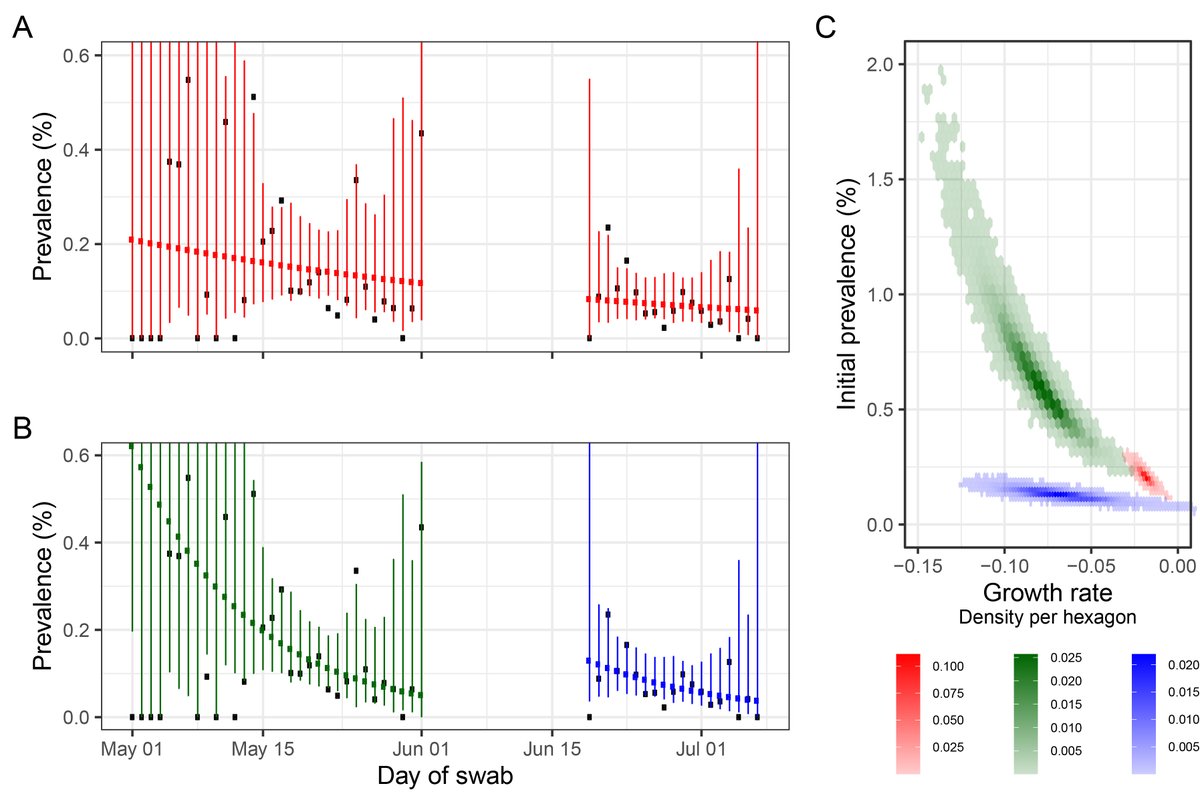
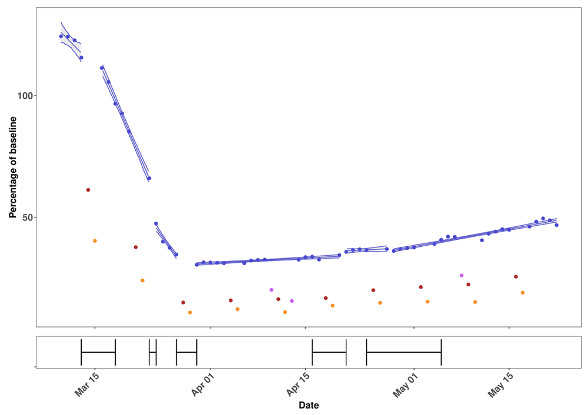
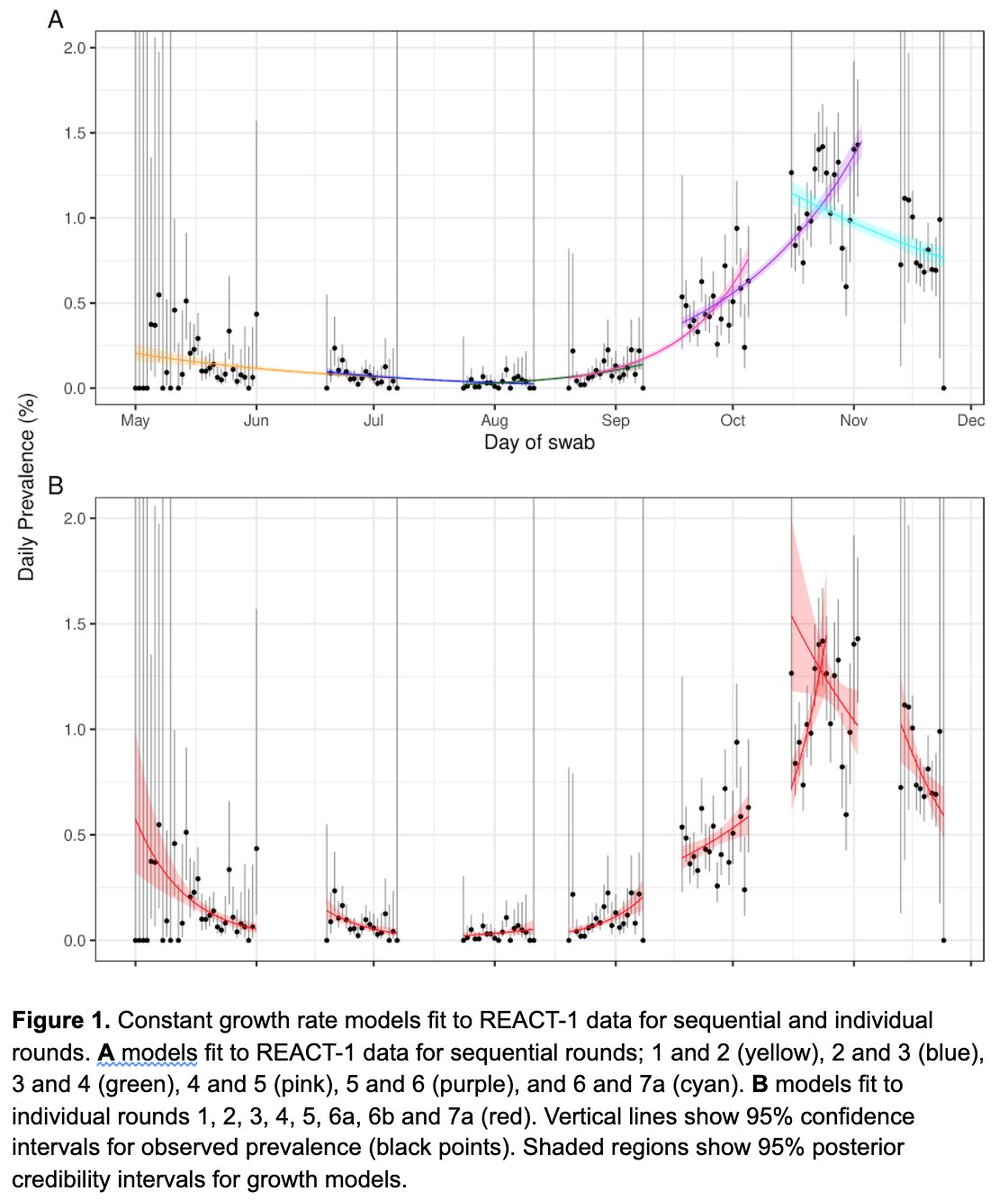
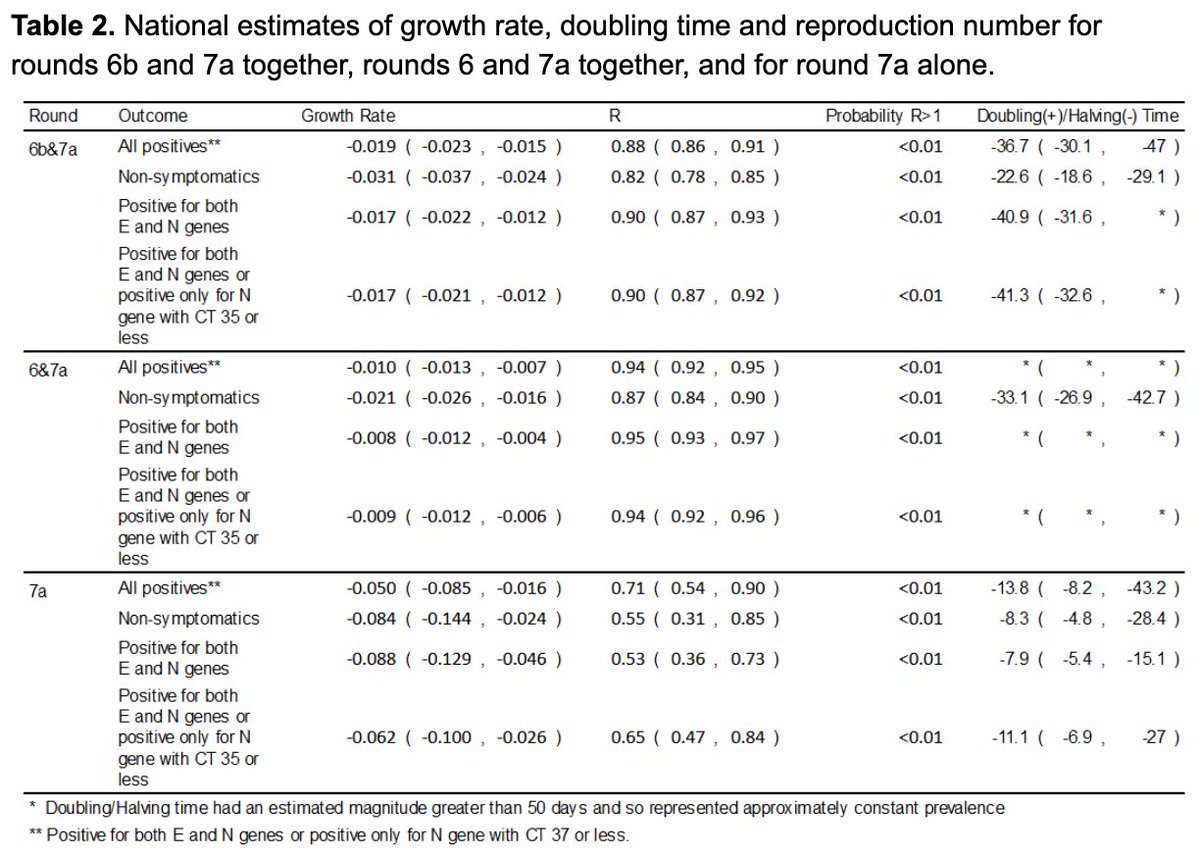
The decrease in prevalence corresponds to a halving time of 37 (30, 47) days and an R = 0.88 (0.86, 0.91).
Using only data from the most recent period, we estimate an R = 0.71 (0.54, 0.90).
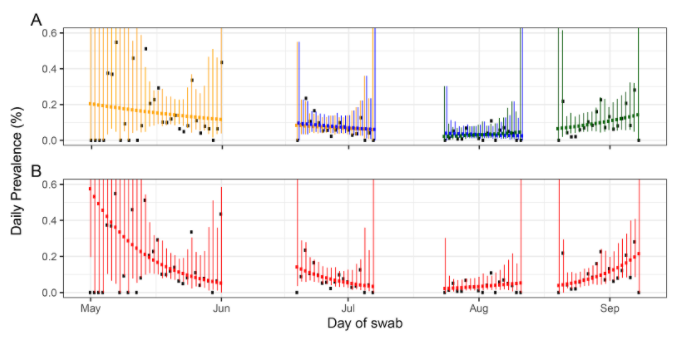
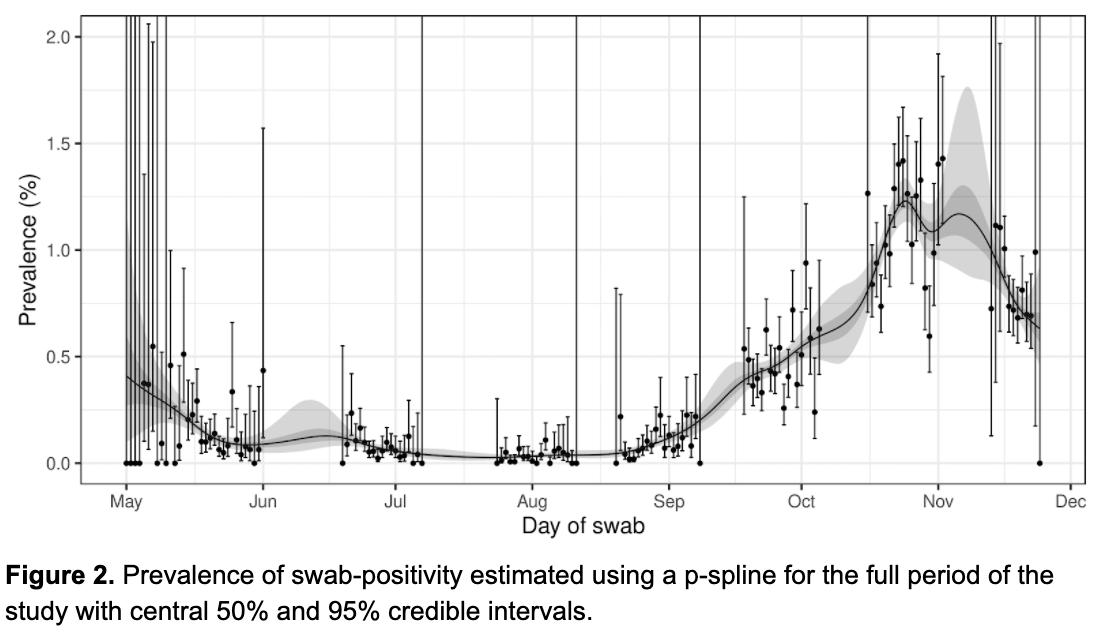
A spline fit to prevalence showed a fall coinciding w/ start of lockdown.
Using only data from the most recent period, we estimate an R = 0.71 (0.54, 0.90).
A spline fit to prevalence showed a fall coinciding w/ start of lockdown.
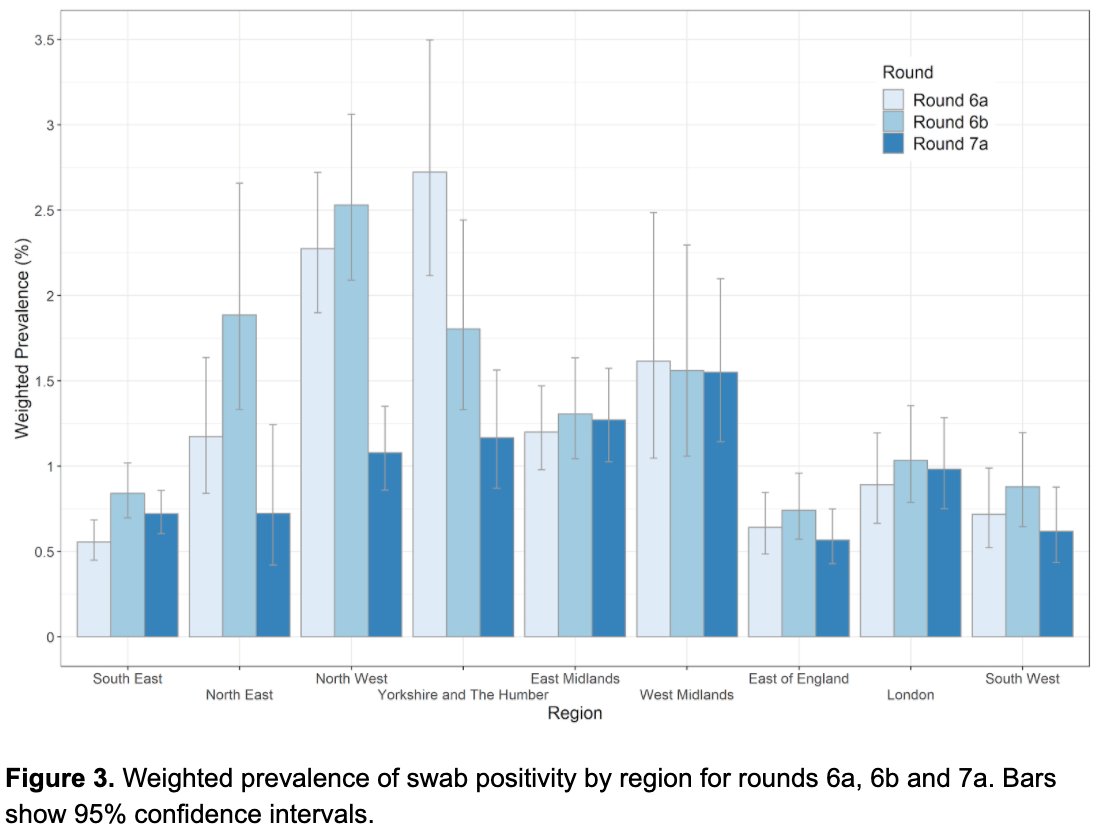
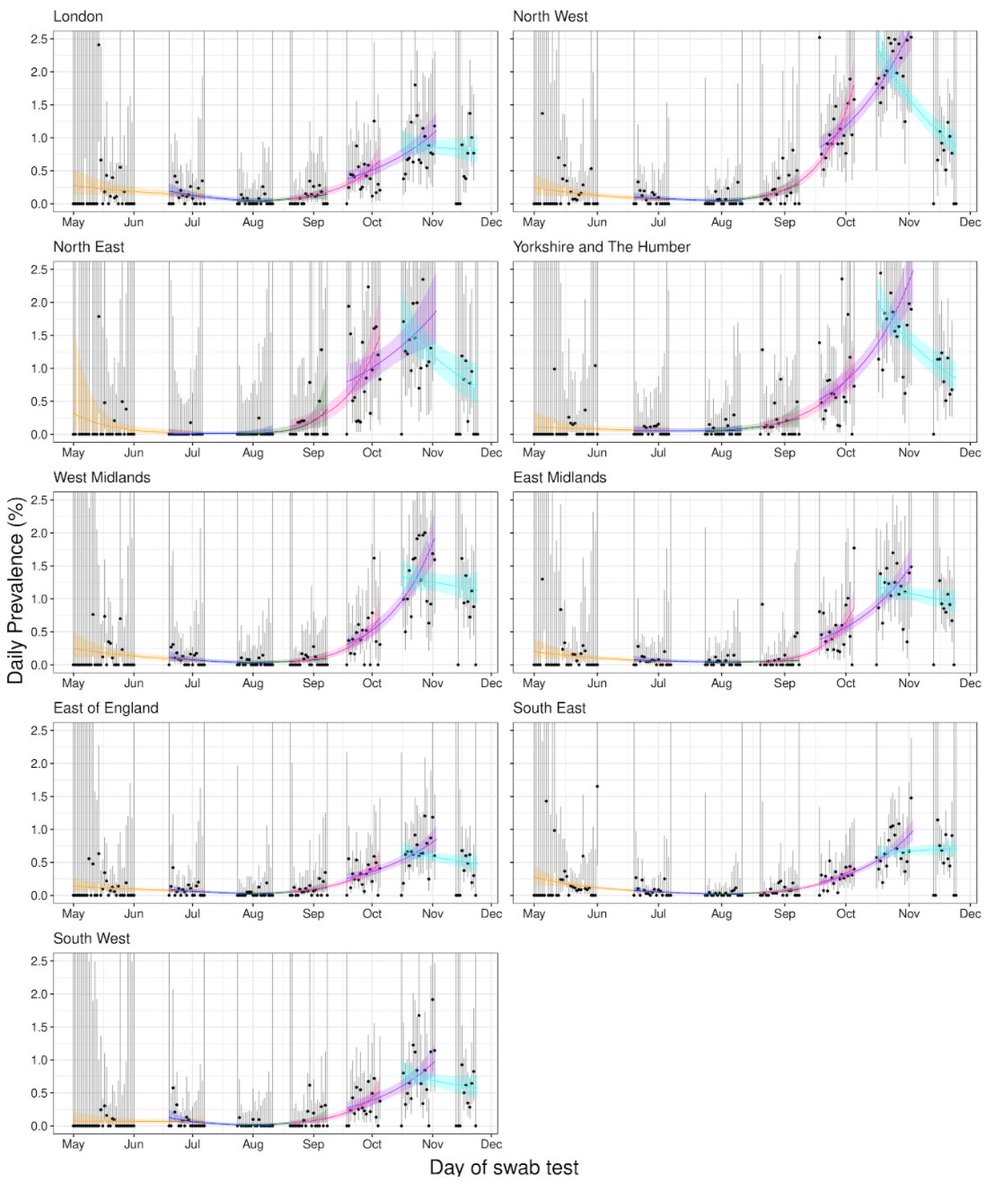
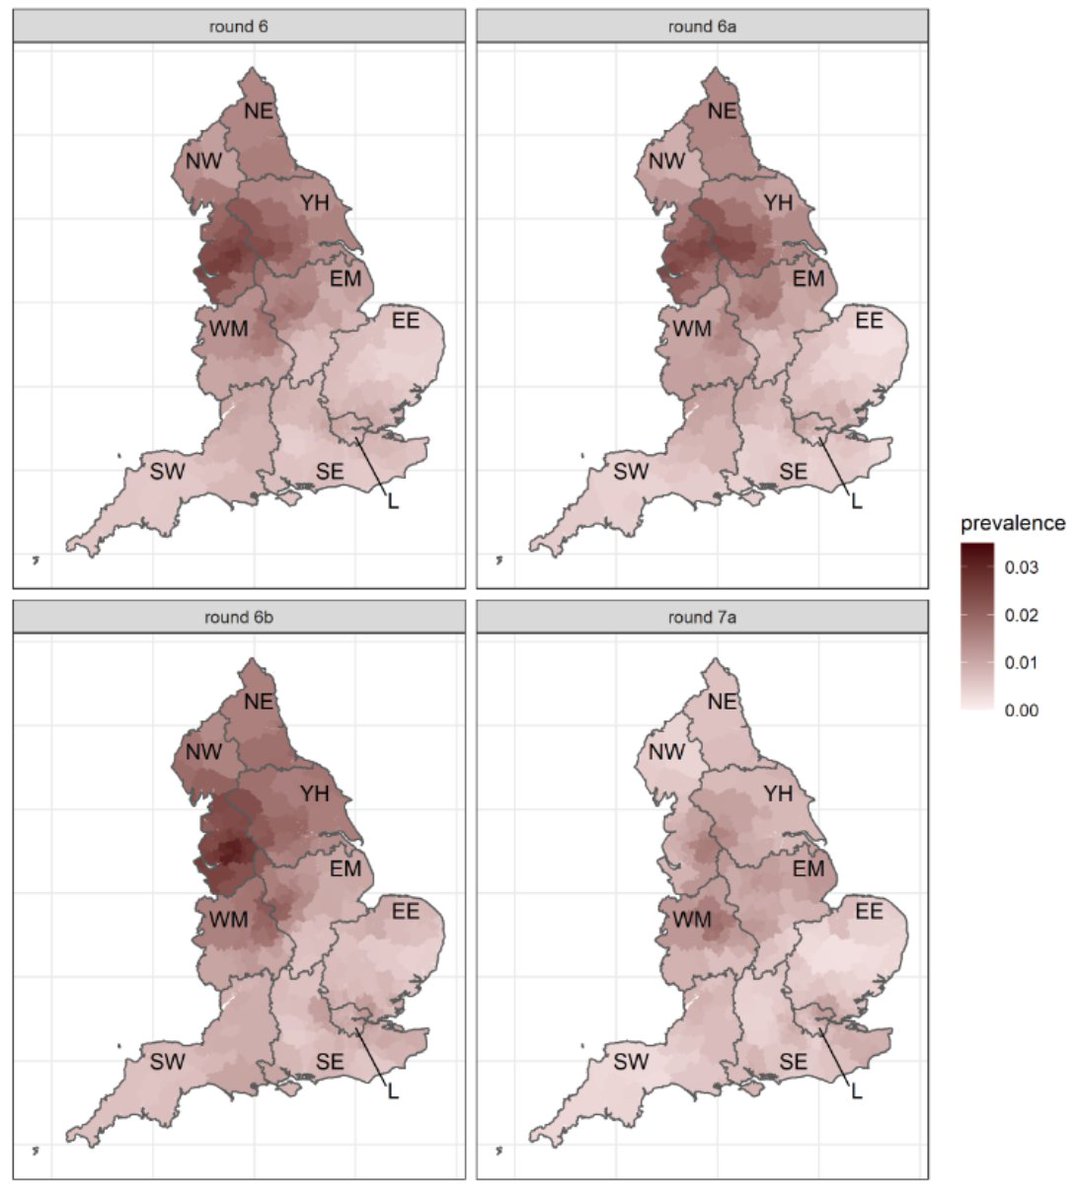
- The national trends driven mainly by reductions in higher-prevalence northern regions
- Prevalence approx unchanged in Midlands and London
- Smaller reductions in southern lower-prevalence regions
- Sub-regional analyses showed marked declines in the North & growth in Midlands
- Prevalence approx unchanged in Midlands and London
- Smaller reductions in southern lower-prevalence regions
- Sub-regional analyses showed marked declines in the North & growth in Midlands
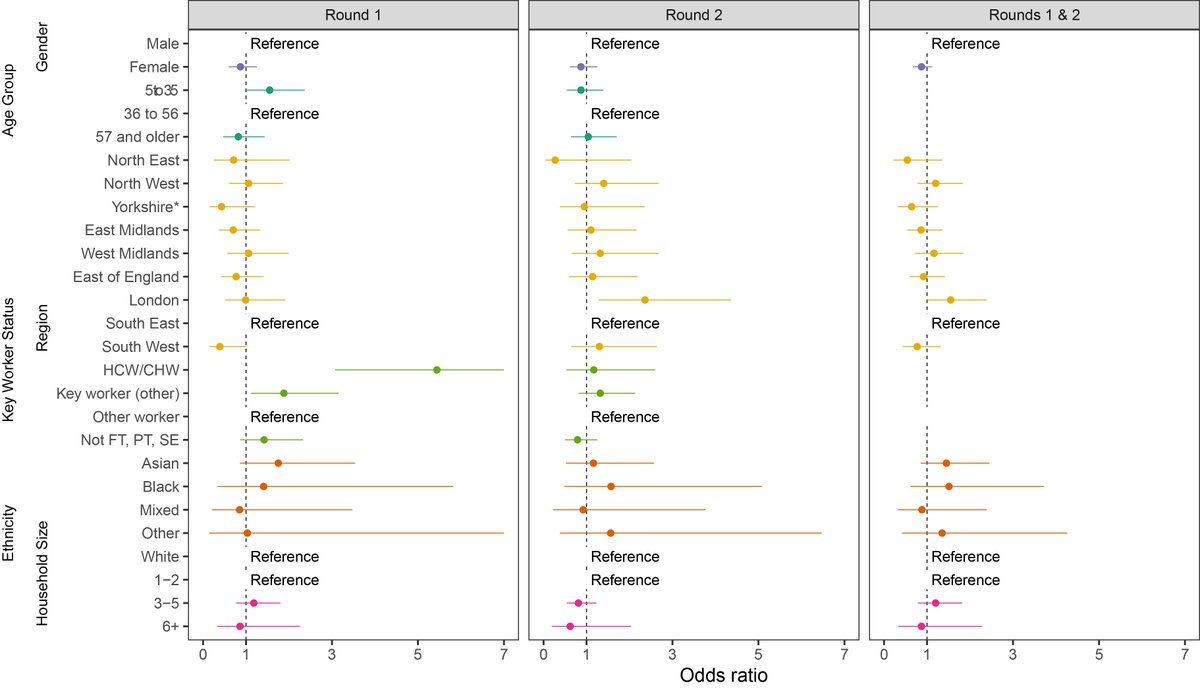
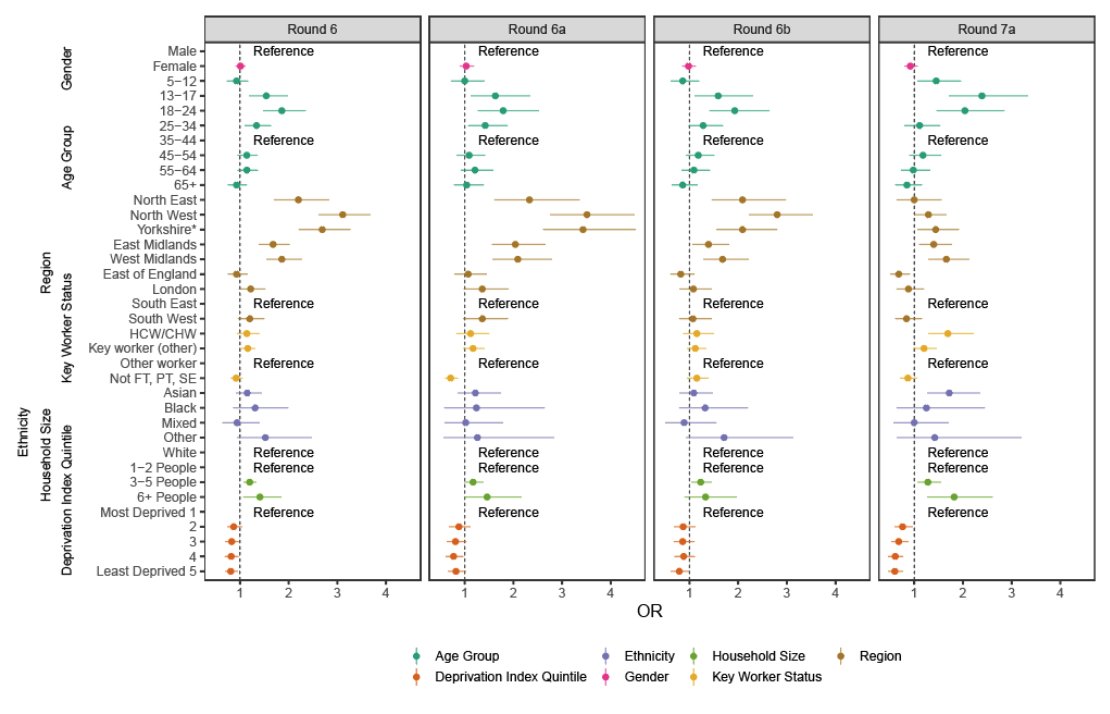
Mutually adjusted models in round 7 (interim) indicated:
-people of Asian ethnicity
-those living in the most deprived neighbourhoods
-those living in the largest households
- healthcare and care home workers
had higher odds of swab-positivity
-people of Asian ethnicity
-those living in the most deprived neighbourhoods
-those living in the largest households
- healthcare and care home workers
had higher odds of swab-positivity
Conclusions:
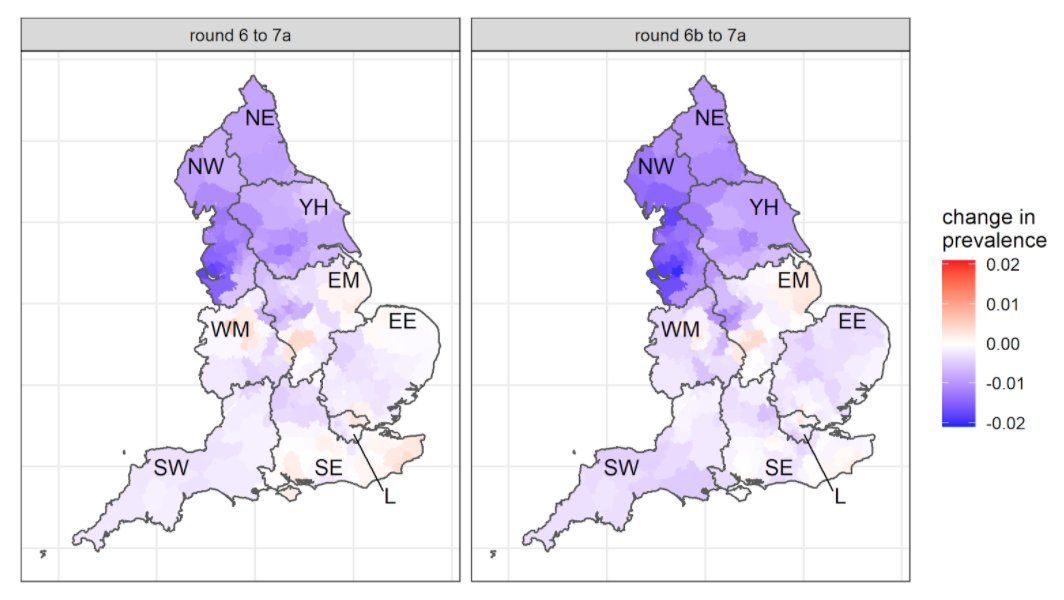
3 weeks into 2nd national lockdown in England there has been a ~30% reduction in prevalence overall w/ greater reductions in the North
As a result, inter-regional heterogeneity has reduced, although average absolute prevalence remains high at ~1%
...
3 weeks into 2nd national lockdown in England there has been a ~30% reduction in prevalence overall w/ greater reductions in the North
As a result, inter-regional heterogeneity has reduced, although average absolute prevalence remains high at ~1%
...
The national prevalence estimate of 0.96% translates to ~720,000 infections in England on any one day
Estimated incidence in England is ~72,000 (58,000 to 78,000) infections per day
This estimate is down from ~100,000 (90,000 to 104,000) new infections per day at end of Oct
Estimated incidence in England is ~72,000 (58,000 to 78,000) infections per day
This estimate is down from ~100,000 (90,000 to 104,000) new infections per day at end of Oct
Continued monitoring of the epidemic in the community remains essential until prevalence is reliably suppressed to much lower levels, for example, through widespread vaccination.
The REACT-1 round 7 interim report is live on @medrxivpreprint: medrxiv.org/content/10.110…
• • •
Missing some Tweet in this thread? You can try to
force a refresh