I don't think that this study by Basavaraju et al from @CDCgov can be taken as evidence that #COVID19 was circulating in the US in December 2019. 1/10
academic.oup.com/cid/advance-ar…
The authors do a careful serological investigation, but it necessarily suffers from testing a large number of samples with an assay that is not perfectly specific. 2/10
The ELISA used by the authors has a stated specificity of 99.3% and the authors tested 519 "true negative" blood samples collected from 2016 to 2019 from healthy adults and suspected hanta virus patients and observed 3 false positives (0.6%) matching this specificity. 3/10
The authors tested 1912 blood samples collected between Dec 13 and Dec 16 2019 and observed 39 positives (2.0%). A Fisher's Exact Test comparing 3/519 to 39/1912 is narrowly significant with p = 0.02. 4/10
However, there is ample reason to expect that individuals recently recovered from seasonal coronavirus infection will have more cross-reactivity to SARS-CoV-2 than random healthy adults. In fact this can be seen in this paper by Freeman et al (ncbi.nlm.nih.gov/pmc/articles/P…). 5/10
Here, ELISA titers are higher in individuals who were recently infected with seasonal coronavirus compared to random healthy adults. This is particularly the case in related betacoronaviruses OC43 and HKU1. 6/10
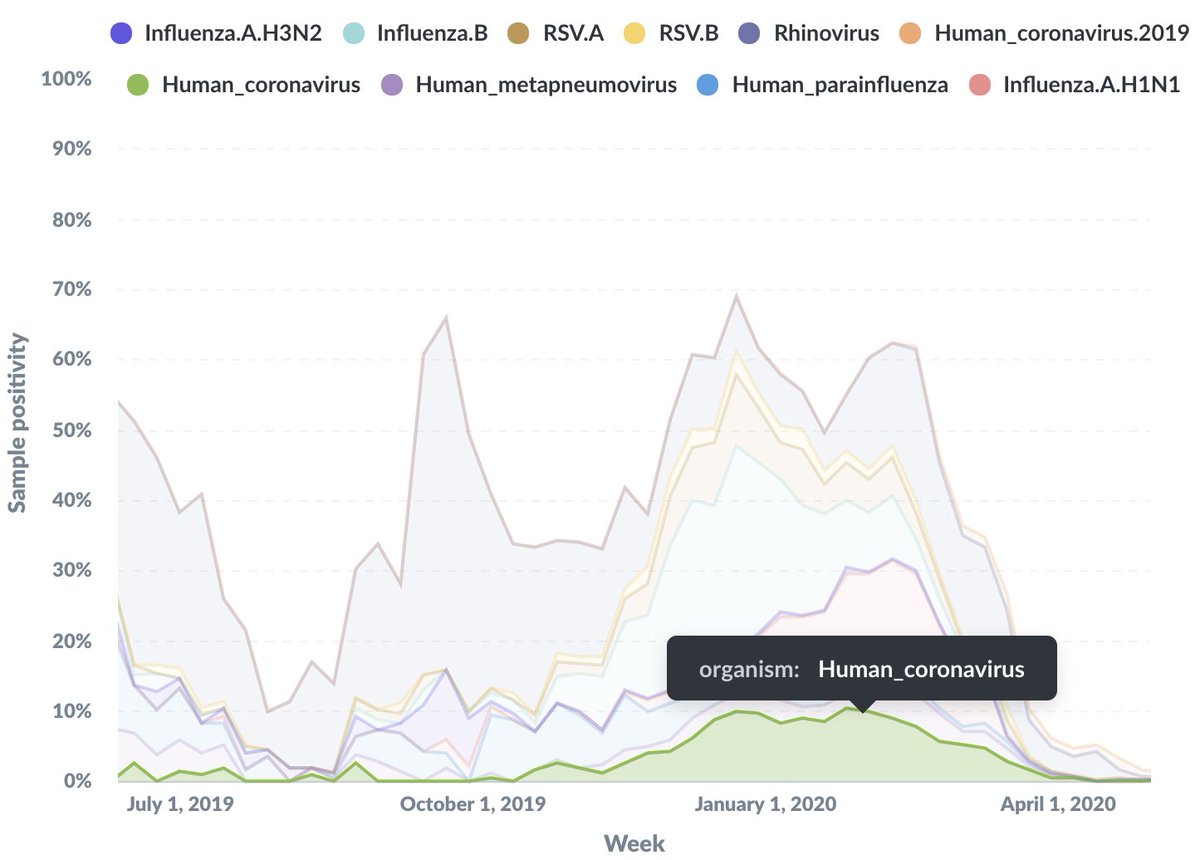
Additionally, we know that seasonal coronaviruses circulate at higher frequencies in the winter. We can see this in @seattleflustudy data where there is significant seasonal coronavirus circulation in Dec 2019. 7/10
It seems highly likely to me that the 39 "positives" from Dec 13 to Dec 16 reported by Basavaraju et al are due to cross-reactivity from recent seasonal coronavirus infection. It would just take a slight decrease of assay specificity to ~98% to explain this outcome. 8/10
The authors highlight the study's limitation due to "potential cross reactivity with human common coronavirus infection" in the paper's discussion, but it unfortunately didn't make it into the @WSJ story (wsj.com/articles/covid…). 9/10
The other angle to consider is that if we're supposed to believe that 2.0% of random blood donors in Dec 2019 are COVID+ this would translate to millions of infections in the population at large, in which case we would have noticed due to people dying in large numbers. 10/10
Follow up #1: Also, a reminder that we at the @seattleflustudy PCR tested 3600 samples from individuals with acute respiratory illness collected in January 2020 from Seattle and found zero positives for COVID-19. This is a much more specific assay.
Follow up #2: This doesn't mean that COVID-19 was completely absent from the US in January 2020, just that prevalence at that time was exceptionally low. Finding 0/3600 COVID+ acute respiratory specimens doesn't square with theoretical 2% ELISA positivity in Dec.

• • •

Missing some Tweet in this thread? You can try to force a refresh
 

Keep Current with Trevor Bedford

Trevor Bedford Profile picture

Stay in touch and get notified when new unrolls are available from this author!

Read all threads

This Thread may be Removed Anytime!

PDF

Twitter may remove this content at anytime! Save it as PDF for later use!

Try unrolling a thread yourself!

how to unroll video
  1. Follow @ThreadReaderApp to mention us!

  2. From a Twitter thread mention us with a keyword "unroll"
@threadreaderapp unroll

Practice here first or read more on our help page!

More from @trvrb

26 Nov
Another update on #COVID19 circulation in the US. With today's report we're seeing an average of ~172k daily cases reported compared to ~157k a week ago, and we're seeing ~1650 daily deaths reported compared to ~1200 a week ago. 1/10
Although this is still a staggering amount of cases and growing daily, the rate of growth at the US level appears to be (at least temporarily) slowing. Here, I've plotted data from @COVID19Tracking, showing daily cases in the US on a log scale alongside 7-day moving average. 2/10
Throughout October we saw steady exponential growth of the US epidemic (indicated by linear-on-a-log-scale dynamics and shown in the graph as the dashed straight line). Early November outpaced this steady growth but has recently slowed. 3/10
Read 10 tweets
19 Nov
When I ran these simple lagged case fatality rate (CFR) calculations last week I was surprised and troubled at how big the predicted numbers of deaths in the coming weeks were. Since then #COVID19 daily case counts have continued to rise. 1/10
@alexismadrigal and @whet describe in much better detail the simple logic behind this calculation here: theatlantic.com/science/archiv… and they do a thorough job investigating assumptions of the method. 2/10
Ryan Tibshirani with the Carnegie Mellon Delphi Research Group very helpfully did an independent replication of the method here: htmlpreview.github.io/?https://githu…. 3/10
Read 10 tweets
17 Nov
Today's announcement of ~95% efficacy in the @moderna_tx #COVID19 vaccine trial is amazing, auspicious news. 1/8
statnews.com/2020/11/16/mod…
This coupled with the announcement of >90% efficacy in the @pfizer / @BioNTech_Group vaccine trial is encouraging that these mRNA vaccines have huge promise. 2/8
statnews.com/2020/11/09/cov…
One small note about these trials. It's often assumed that vaccines are only a proxy for immune response to natural infection. However, there's nothing that prevents vaccines from inducing better, more durable protection than natural infection. 3/8
Read 8 tweets
14 Nov
The #COVID19 epidemic is rapidly growing throughout the US. What happens now? Here I try to make some predictions, but mostly try to explain how I think about the epidemic. 1/14
The US just reported ~170,000 cases in a day. However, there hasn't been a sudden increase in transmission. This is the same exponential growth process going on for weeks now. Rt has ticked up from a US average of ~1 in August to ~1.15. Data from rt.live. 2/14
This increase in Rt can be ascribed to seasonality of the virus. Seasonality of respiratory pathogens is (incredibly) not well understood but is thought to be due to a combination of indoor crowding and increased stability of viral particles in drier winter air. 3/14
Read 14 tweets
13 Nov
A brief update on our work with the sequencing of the White House #COVID19 outbreak. Since posting on Nov 1, groups from all over the US have shared an additional 2798 #SARSCOV2 viral genomes via @gisaid and additional connections have emerged. 1/9
This sequencing has revealed additional viruses circulating in Virginia and collected between Aug and Oct that fall alongside the WH lineage, as well as three viruses from Michigan collected in Oct that are closely related to sequences from the White House outbreak. 2/9
These three viruses from Michigan possess 1 differentiating mutation and the two White House-associated viruses also possess 1 differentiating mutation. A molecular clock analysis places their common ancestor in Aug or Sep. Interactive figure at nextstrain.org/community/blab…. 3/9
Read 9 tweets
11 Nov
After posting about sharply rising #COVID19 cases Friday, there were multiple replies to the effect of "but deaths aren't going up". As should be obvious to most at this point, (reported) deaths lag (reported) cases. This thread investigates. 1/8
There is a lag between when a case is diagnosed and when the individual may succumb to their disease and there is a further lag between date of death and when the death is reported. 2/8
Here, I compare state-level data from @COVID19Tracking for cases and deaths and find that a 22-day lag maximizes state-level correlations. 3/8 Image
Read 8 tweets

Did Thread Reader help you today?

Support us! We are indie developers!


This site is made by just two indie developers on a laptop doing marketing, support and development! Read more about the story.

Become a Premium Member ($3/month or $30/year) and get exclusive features!

Become Premium

Too expensive? Make a small donation by buying us coffee ($5) or help with server cost ($10)

Donate via Paypal Become our Patreon

Thank you for your support!

Follow Us on Twitter!