A brief update on our work with the sequencing of the White House #COVID19 outbreak. Since posting on Nov 1, groups from all over the US have shared an additional 2798 #SARSCOV2 viral genomes via @gisaid and additional connections have emerged. 1/9
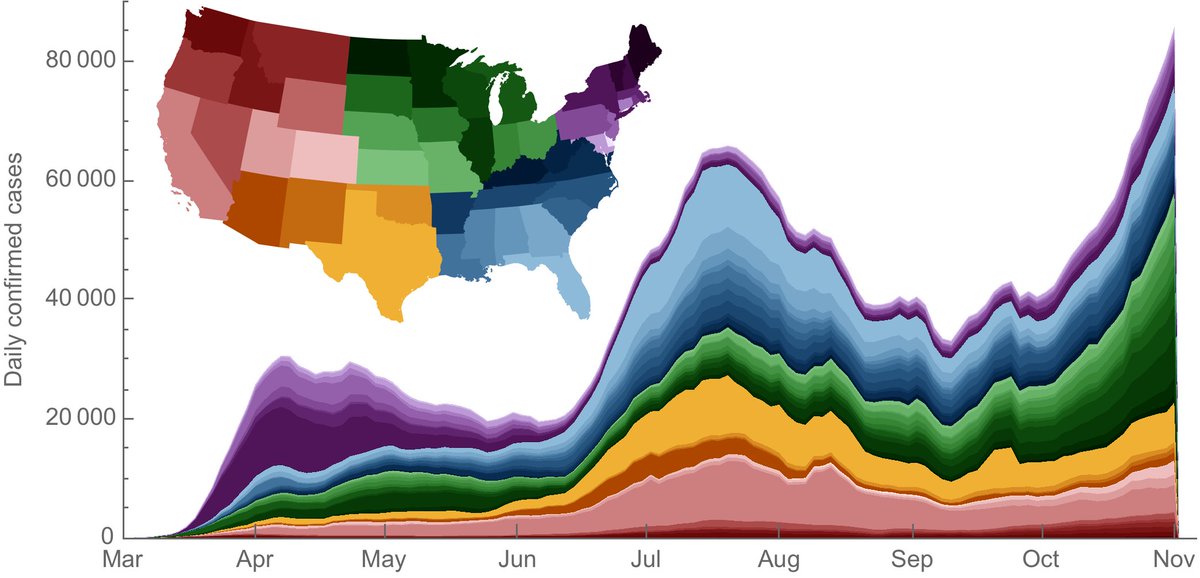
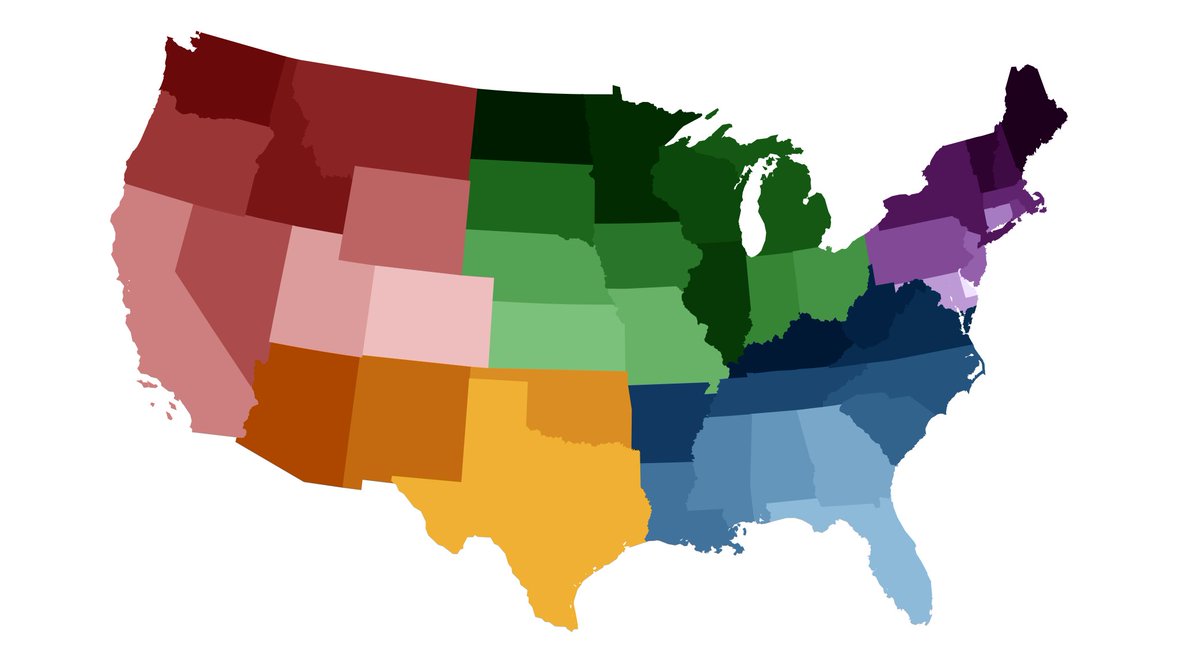
This sequencing has revealed additional viruses circulating in Virginia and collected between Aug and Oct that fall alongside the WH lineage, as well as three viruses from Michigan collected in Oct that are closely related to sequences from the White House outbreak. 2/9
These three viruses from Michigan possess 1 differentiating mutation and the two White House-associated viruses also possess 1 differentiating mutation. A molecular clock analysis places their common ancestor in Aug or Sep. Interactive figure at nextstrain.org/community/blab…. 3/9
It's unclear if these viruses from Michigan represent an offshoot of the transmission chain or if they represent the geographic line of descent. Additional sequencing may continue to shed light on these origins. At this point, it's still hard to say much. 4/9
In the last few days a second WH-related cluster has emerged with 17 publicly announced cases reported between Nov 4 and Nov 11 (whcovidtrack.com/chief-of-staff…). 5/9
Sequencing cases from this second cluster could immediately distinguish between:
1. Ongoing transmission in the WH network throughout October
2. A second unrelated introduction event
6/9
These two scenarios have important implications for ongoing infection control procedures. We'd be happy to work with anyone at the @WhiteHouse Medical Unit to sequence further cases from the outbreak. 7/9
Or if there are any individuals with COVID diagnoses who are connected to this outbreak who want to participate in a research study, please get in touch. We are required to keep identifiable information completely confidential. In this case, please contact haarvi@uw.edu. 8/9
Lastly, I'd like to thank the Virginia Division of Consolidated Laboratory Services, the University of Michigan Clinical Microbiology Laboratory and the @lauringlab at the University of Michigan for sharing viral genomic data. 9/9

• • •

Missing some Tweet in this thread? You can try to force a refresh
 

Keep Current with Trevor Bedford

Trevor Bedford Profile picture

Stay in touch and get notified when new unrolls are available from this author!

Read all threads

This Thread may be Removed Anytime!

PDF

Twitter may remove this content at anytime! Save it as PDF for later use!

Try unrolling a thread yourself!

how to unroll video
  1. Follow @ThreadReaderApp to mention us!

  2. From a Twitter thread mention us with a keyword "unroll"
@threadreaderapp unroll

Practice here first or read more on our help page!

More from @trvrb

14 Nov
The #COVID19 epidemic is rapidly growing throughout the US. What happens now? Here I try to make some predictions, but mostly try to explain how I think about the epidemic. 1/14
The US just reported ~170,000 cases in a day. However, there hasn't been a sudden increase in transmission. This is the same exponential growth process going on for weeks now. Rt has ticked up from a US average of ~1 in August to ~1.15. Data from rt.live. 2/14 Image
This increase in Rt can be ascribed to seasonality of the virus. Seasonality of respiratory pathogens is (incredibly) not well understood but is thought to be due to a combination of indoor crowding and increased stability of viral particles in drier winter air. 3/14
Read 14 tweets
11 Nov
After posting about sharply rising #COVID19 cases Friday, there were multiple replies to the effect of "but deaths aren't going up". As should be obvious to most at this point, (reported) deaths lag (reported) cases. This thread investigates. 1/8
There is a lag between when a case is diagnosed and when the individual may succumb to their disease and there is a further lag between date of death and when the death is reported. 2/8
Here, I compare state-level data from @COVID19Tracking for cases and deaths and find that a 22-day lag maximizes state-level correlations. 3/8
Read 8 tweets
7 Nov
I know that everyone has been (justifiably) distracted by other things, but the #COVID19 epidemic in the US is looking pretty dire with 125,552 confirmed cases reported Friday by @COVID19Tracking. 1/10
Please consider this somewhat of a follow up to the thread two weeks ago on circulation patterns across states. 2/10
Confirmed cases have continued to tick up across the US, though with the Midwest and Mountain West contributing to most of the recent increase. Data from @COVID19Tracking. 3/10 Image
Read 10 tweets
1 Nov
Separately, I wanted to address the question of "why do this?" with regards to sequencing of infections involved in the White House #COVID19 outbreak. 1/10
Although the origins of the White House outbreak were characterized as "unknowable", viral genome sequencing can offer important clues to how infections in a cluster are connected to each other and to the larger COVID-19 epidemic. 2/10
This technology is rapidly becoming a standard course of action for COVID-19 clusters of public health interest. This seems obvious, but we can use science to understand and track the spread of COVID-19. 3/10
Read 10 tweets
1 Nov
Our research group at @fredhutch, @UWMedicine and @BrotmanBaty has sequenced the viral genomes of two SARS-CoV-2 infections that were connected to the White House #COVID19 outbreak. The @nytimes reports here: nytimes.com/2020/11/01/sci…. 1/16
We enrolled two individuals with exposures linked to the White House COVID-19 outbreak into an IRB-approved research study, collected nasal swabs and sequenced the SARS-CoV-2 virus in these swabs. 2/16
Importantly, these two individuals attested that they had no direct contact with each other in the days preceding their diagnoses and are independently linked to the White House COVID-19 outbreak. 3/16
Read 18 tweets
19 Oct
Daily #COVID19 case counts are increasing in the US and we seem to hitting a third wave (or second surge if you'd prefer). Here I wanted to look at how case counts through time correlate across different states. 1/12
I start with a simple coloring to group states in the West (in red), the Southwest (in orange), the Midwest (in green), the Southeast (in blue) and the Northeast (in purple). Color ramp borrowed from @andersonbrito_. 2/12
Using data from @COVID19Tracking, I plot daily confirmed cases for each state since March as a stacked chart. The three crests are obvious (though not clear how large the third will end up being). Different regions are contributing to each wave to different degrees. 3/12
Read 13 tweets

Did Thread Reader help you today?

Support us! We are indie developers!


This site is made by just two indie developers on a laptop doing marketing, support and development! Read more about the story.

Become a Premium Member ($3/month or $30/year) and get exclusive features!

Become Premium

Too expensive? Make a small donation by buying us coffee ($5) or help with server cost ($10)

Donate via Paypal Become our Patreon

Thank you for your support!

Follow Us on Twitter!