1) The long-term performance of equities is driven by economic fundamentals, as controversial as that seems.
The 20-year compounded return in $IWM has come down from 15% in the period ending in 2000 to 8.7% in the 20 year period ending today.
The 20-year compounded return in $IWM has come down from 15% in the period ending in 2000 to 8.7% in the 20 year period ending today.

2) The decline in long-term stock performance mirrors the trending direction in the long-term growth rate of the economy. 

3) Stocks are driven by increases in EPS and a varying multiple on EPS
The multiple is influenced by the direction of real interest rates and increases in EPS are tied to economic fundamentals excluding tax changes and buybacks
Gold is also driven by the direction in real rates
The multiple is influenced by the direction of real interest rates and increases in EPS are tied to economic fundamentals excluding tax changes and buybacks
Gold is also driven by the direction in real rates

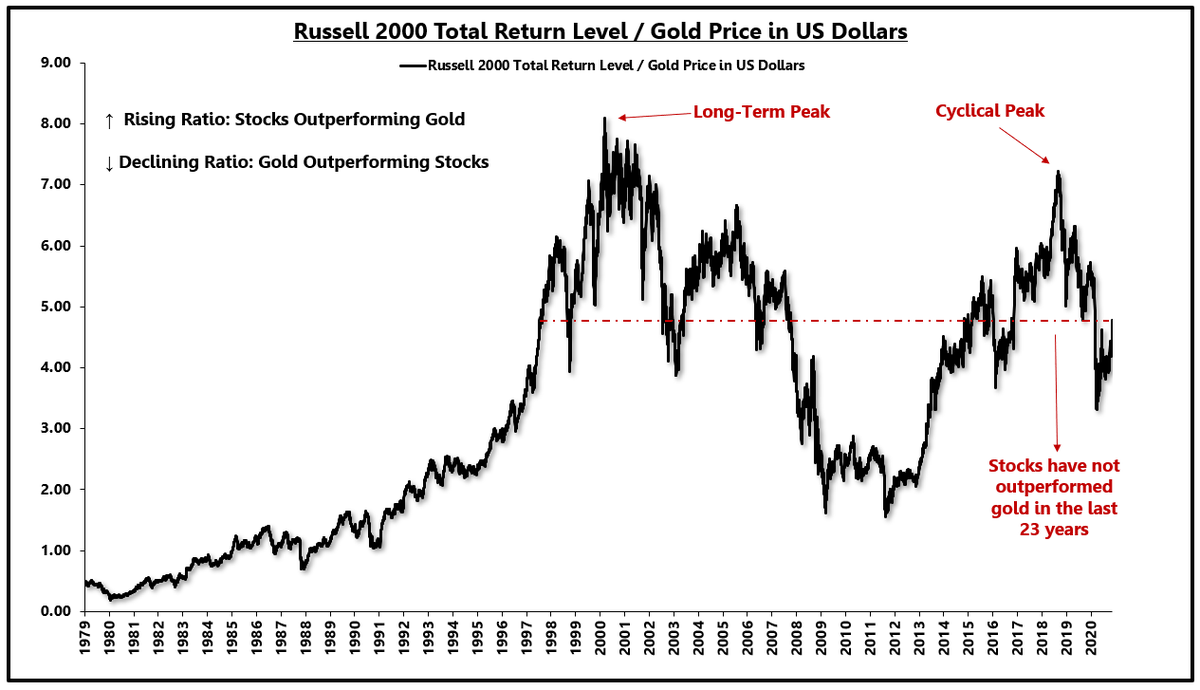
4) Pricing stocks in terms of $GLD rather than dollars normalizes for changes in real interest rates and tells us how much of stock market performance is coming from factors not tied to real interest rates, i.e. organic earnings growth.
5) Stocks have not outperformed gold in 23 years.
What happened around the year 2000 that caused a secular change in the performance of stocks relative to gold or real rates?
@LynAldenContact @LukeGromen
What happened around the year 2000 that caused a secular change in the performance of stocks relative to gold or real rates?
@LynAldenContact @LukeGromen

6) Real economic growth started to collapse after the turn of the century.
Lower real economic growth impairs the ability of the economy to generate sustained EPS growth.
Lower real economic growth impairs the ability of the economy to generate sustained EPS growth.

8) So, declining economic fundamentals have resulted in weaker earnings growth and lower long-term stock returns.
However, during periods of accelerating economic conditions, stocks can outperform gold/interest rates, despite the long-term trend.
However, during periods of accelerating economic conditions, stocks can outperform gold/interest rates, despite the long-term trend.

9) Stocks outperform gold when economic conditions are improving like from 2016-2018 when GDP growth increased from 2.37% to 6.06% and stocks way outperformed gold.
It didn't change the long-term trend, however...
It didn't change the long-term trend, however...

10) The period from 2016-2018 came with much higher real interest rates.
Stocks can rise in the face of rising real interest rates only when economic growth is improving.
Stocks can rise in the face of rising real interest rates only when economic growth is improving.

11) Real interest rates can rise for a "good" reason or a "bad" reason.
Good: Organic increase in economic growth.
Bad: Deflation
When real interest rates rise during a downturn in growth, deflationary pressure is strong and risk assets suffer.
Good: Organic increase in economic growth.
Bad: Deflation
When real interest rates rise during a downturn in growth, deflationary pressure is strong and risk assets suffer.

12) So stocks will continue to outperform gold for as long as economic growth maintains upward momentum, even if it comes with higher interest rates. 

13) Today's ISM report confirmed the momentum in the manufacturing sector.
https://twitter.com/EPBResearch/status/1333791427352903682?s=20
14) When this transitory upturn in growth gives way to the next downturn, we're going to run into many problems around the ZLB.
The market is projecting a 1.7% long-term FF rate while the Fed is out to lunch at 2.5% long-term.
CC: @TeddyVallee

The market is projecting a 1.7% long-term FF rate while the Fed is out to lunch at 2.5% long-term.
CC: @TeddyVallee


15) The next downturn can push the LT expected FF rate down more than 100bps which would push 10s to or through 0%.
If the Fed doesn't want to deal in negative interest rates, then the real rate will start to rise for a "bad" reason.
If the Fed doesn't want to deal in negative interest rates, then the real rate will start to rise for a "bad" reason.

16) Keep watching the manufacturing sector.
Services are struggling, but as long as the industrial sector continues to rip, economic growth will maintain momentum and stocks will ignore the higher interest rates across the curve.
Services are struggling, but as long as the industrial sector continues to rip, economic growth will maintain momentum and stocks will ignore the higher interest rates across the curve.

17) When this upturn in manufacturing rolls over, we'll experience another deflationary wave that will push the belly of the curve to or through 0%.
Until then, stocks will absorb higher rates as long as it's accompanied by higher nominal growth.
Until then, stocks will absorb higher rates as long as it's accompanied by higher nominal growth.

• • •
Missing some Tweet in this thread? You can try to
force a refresh


