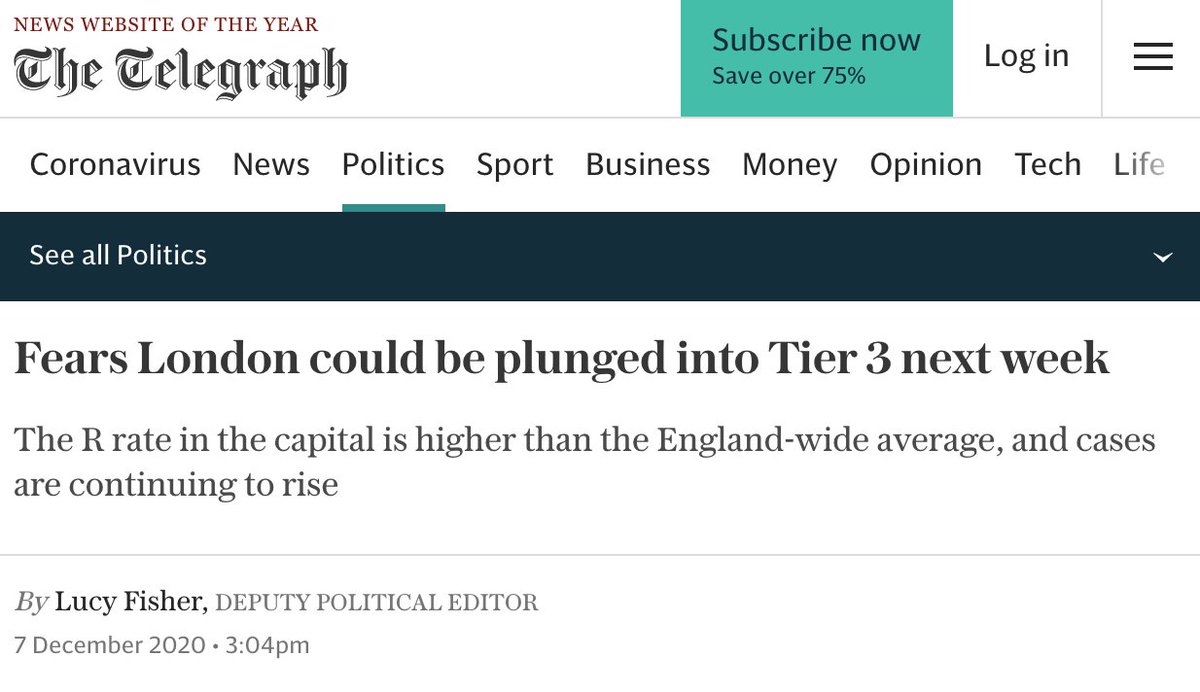
"London could be plunged into Tier 3"
"The R rate in London is currently 0.9 to 1.1, higher than the England-wide average of 0.8 to 1." - Telegraph
AN ABYSMAL MISUNDERSTANDING OF LOGIC & MATHS
Please read & r/t:
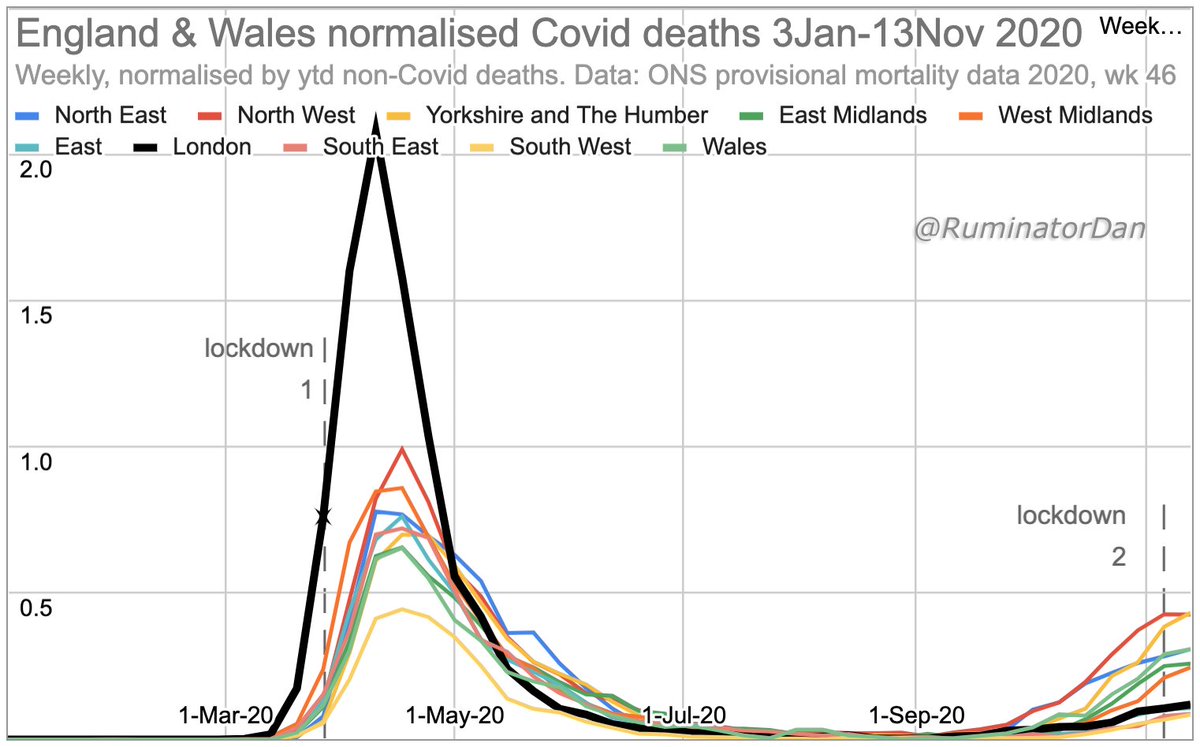
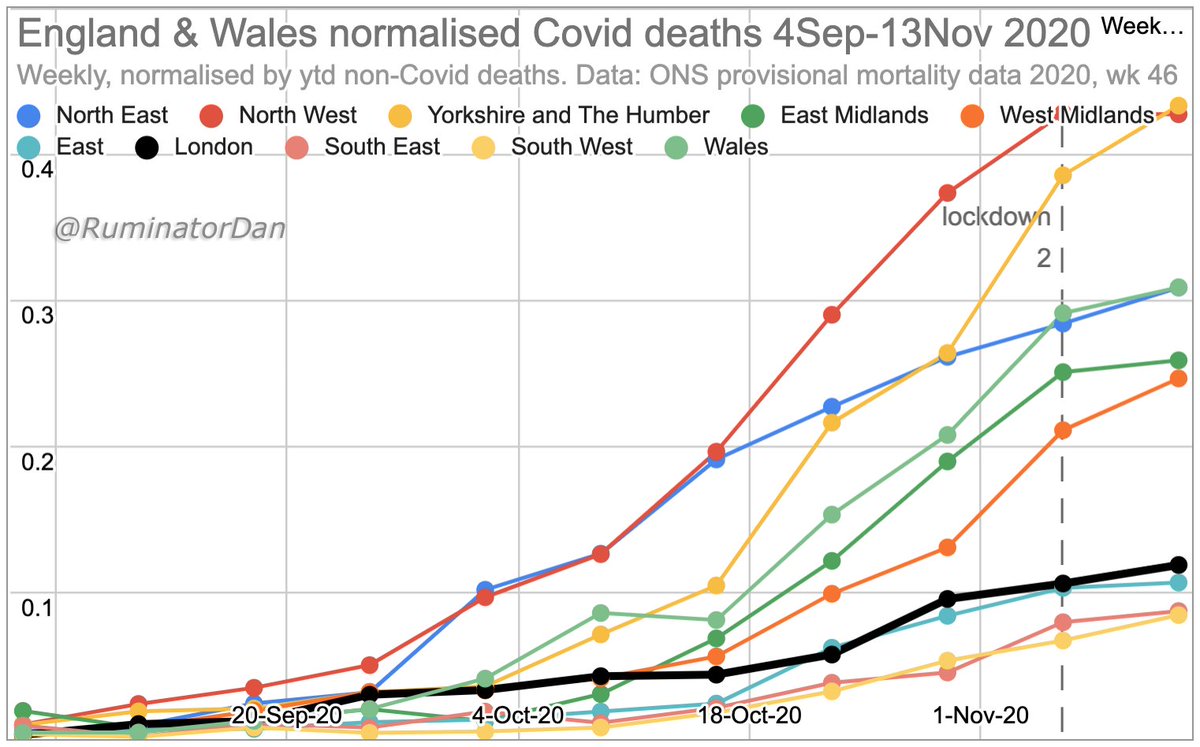
"most recent week of complete data, ending Dec 1, showed a rate of 164 cases per 100,000 in London, up from 159 the previous week."
Up by 3% in a week. Can we be sure it isn't noise? Even if real, at that rate the doubling time is over 5 months! In spring it was a few days.
What about the R rate?
"The R rate in London is currently 0.9 to 1.1, higher than the England-wide average of 0.8 to 1"
London's R is around 1. Just what you'd expect if the virus was at a low, fairly stable prevalence or was virtually gone & most 'cases' were false positives.
Comparing London's R to England-wide R, which includes areas where cases are falling, is a complete misunderstanding of concepts & is highly misleading. R is below 1 because cases are falling. When the virus is more or less gone, cases no longer fall, so R cannot stay below 1.
This does not mean that there won't be cases & some increases & declines: the article in fact includes a map showing differences between boroughs. But this is nothing like the spring.
Using 'R' in such a way is simply wrong.
Please read this thread for an explanation of why the objective keeping R below 1 long term is not only a mistake but is literally unachievable.
_England & Wales Autumn Covid deaths show regional heterogeneity. London, in particular, is interesting_
London's more severe & earlier spring growth may well explain why it has, to date, seen less of an autumn rise.
[Charts normalised by ytd non-covid deaths.]
[27Nov2020_1]
The generally held belief is that only a small percentage of people have so far been infected by SARS-CoV-2 & that the vast majority remain susceptible to infection - hence all the measures taken.
There are, however, reasons & evidence suggesting that this is not the case.
If the vast majority of people were still susceptible, one would expect growth everywhere. However, autumn rises have varied greatly across regions.
London especially, given its nature (crowding etc) would be expected to show aggressive growth, as it did in spring.
UK Health secretary comments that the goal is to bring R below 1 & keep it there until a vaccine.
A Sisyphean task.
Impossible.
Not due to the virus, but due to a misunderstanding of logic, science & maths.
Infections rising: R > 1
Infections falling: R < 1
This would seem simple. As the epidemic grows R is above 1. As it wanes, R is below 1.
But infections cannot fall forever.
When the level of infections has fallen to very low levels (or even zero) & a large proportion of the infections detected are false positives, then the infection figures will appear fairly stable; albeit with some noise, which is a problem at lower numbers.
The PCR debacle, operation Moonshot, masks, school closures, ruined health, futures and incomes, liberties... All spring forth from our underlying beliefs about the virus. These issues, important as they are, distract our attention from the most important questions of all...
...No one denies that it's a nasty virus that can be lethal. I know people who've suffered with it. I also know plenty who've had horrible experiences with other things too (often caused by the avoidable actions of people). There's no risk-free option...
...It was claimed approx 500K people in the UK & 2M in USA would die, (~0.5-1% of the population). On that basis we closed much of the world.
But, even the hardest hit countries lost roughly one tenth of that number of people (& that despite the differences in measures taken)...
"Antibodies, after all, are just one facet of the body's complex immune system"
Many act as if this is not the case. & yet, even with minimal immunological knowledge, the idea that antibodies might be the full story is disproved by observed reality.
"the new study indicated that other factors like T cells showed only a slight decay several months out from infection, while B cells, which produce new antibodies as needed, had actually grown in number in most participants"
CZECH REPUBLIC & OTHER EUROPEAN
HIGHER FATALITY COUNTRIES
(thread)
Signs of Czech Rep deaths slowing? I wish them well. Interesting, yet again, that the cumulative total is so similar to other hard hit locations, which are all around 10x lower than generally used predictions...
The point is not to use these data for some ugly competition. Rather, these data and their differences - or similarities - can reveal very important information about #SARSCoV2 .
For example, UK deaths were predicted to reach ~7500 per Million (=~500k people, without measures).
However, if the hypotheses that led to such predictions were true, & such totals have only been averted by lockdown, then one would expect large variations between countries (as exact details & timing of lockdown and other measures would be critical).