I want to talk for several tweets about this slide from Gord Tanner @cityoftoronto at yesterday's hearing. And about @JohnTory's false assertion today that there are only about 400 people living outdoors in T.O. @dmrider @CBCLorenda @cathyacrowe @cllrainslie @shelleycarroll 1/ 

Let's start with the very most basic FACT (as Mary Anne Bedard kept saying yesterday, in a verbal tick repeated often by deputants to poke fun):
To say that there are 400+ tents in parks & transportation right of ways right now but only 400 people living outdoor is risible. 2/
To say that there are 400+ tents in parks & transportation right of ways right now but only 400 people living outdoor is risible. 2/
For starters, assuming just 1, or less than 1 person per tent (or similar structure) doesn't work. We'll get to why in a moment. But that also then assumes no one else is homeless and sleeping w/o tent, on grates, in construction sites, doorways, parking garages, TTC cars etc. 3/
But then, before getting to the FACTS (from City sources no less) suggesting two people per tent is the norm, lets also turn to City funded agencies that cover Scarborough, North York, and Etobicoke-York in their catchments: 4/
In November, I spoke with managers & workers at both Agincourt Community Centre and Albion. Agincourt's City funded outreach covers Scarborough and North York east to west to Jane. Albion covers Etobicoke-York west to east to Jane, Parkdale, and Midtown in tandem with S2H. 5/
The City, in the graphic above, has 9 sites 15 tents for Scarborough. That is likely v low (@c_shadowspaces and I have visited 4 regular tenting sites in Oct & Nov) with a total of 10-12 tents depending. Agincourt told me directly that their numbers are 50-80 in Scarborough. 6/
The City has 8 sites 16 tents (so apparently just 16 people) down for North York. Agincourt told me the numbers are 30-60 for North York with "exponential" growth in homelessness due to evictions right now. So in these two areas, City numbers are off by 2x to 5x actual. 7/
I also spoke with Albion. Gratefully, they broke out their numbers for Etobicoke-York such that I wouldn't have overlap with other organizations doing good work in Parkdale. Albion says there are 40 people outdoors and homeless in E-Y. The City graphic has 7 sites, 10 tents. 8/
Besides Sanctuary where @c_shadowspaces and I work (which does outreach throughout Toronto and East York as outlined by this graphic), Greg and I spoke to four other organizations about numbers that do outdoor outreach in this catchment area. 9/
As a side note, Albion's numbers were similar for Parkdale and Midtown for what I have from these other organizations. The total for this whole area (Toronto/East York - which I have broken down into Parkdale, Downtown, East York, Beaches) is a minimum of 800 people outdoors. 10/
The minimum for all of these areas then is about 900. I have argued in this thread for a minimum of 200 people forced to make TTC their primarily place of sleep. Even cutting that number in 1/2, we are still to 1000 minimum without home or shelter in Toronto. 11/
https://twitter.com/djjohnso/status/1328807841084399628
All of this is the bare minimum really. I can make reasonable data cases for closer to 2000 people outdoors in two other ways. For this minimum 1000 number, there is also an easy way to make the case that there are two people per tent, on average: 12/
We have good numbers for at least three encampment clearings since COVID-19 started that strongly suggest that 2 people per tent is average, if not a low figure.
Here's @kristynwongtam stating that there were about 60 tents on June 28 in Moss Park per Fred Victor: 13/
Here's @kristynwongtam stating that there were about 60 tents on June 28 in Moss Park per Fred Victor: 13/
https://twitter.com/kristynwongtam/status/1276512748776685570
(My count around same time was similar. CBC reported 50 tents a week or two earlier.)
Just after that? The City said it put 140 people into hotels. And that didn't clear everyone. There were still about 12 tents left with the people who refused/sued. 14/ cbc.ca/news/canada/to…
Just after that? The City said it put 140 people into hotels. And that didn't clear everyone. There were still about 12 tents left with the people who refused/sued. 14/ cbc.ca/news/canada/to…
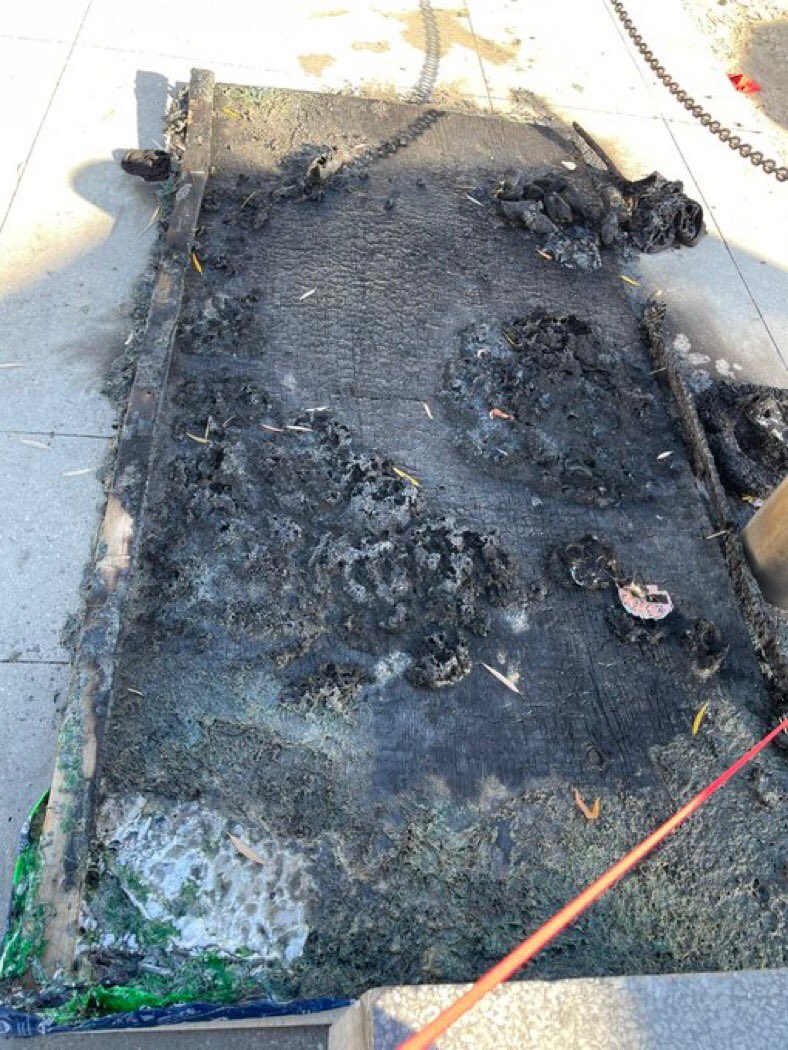
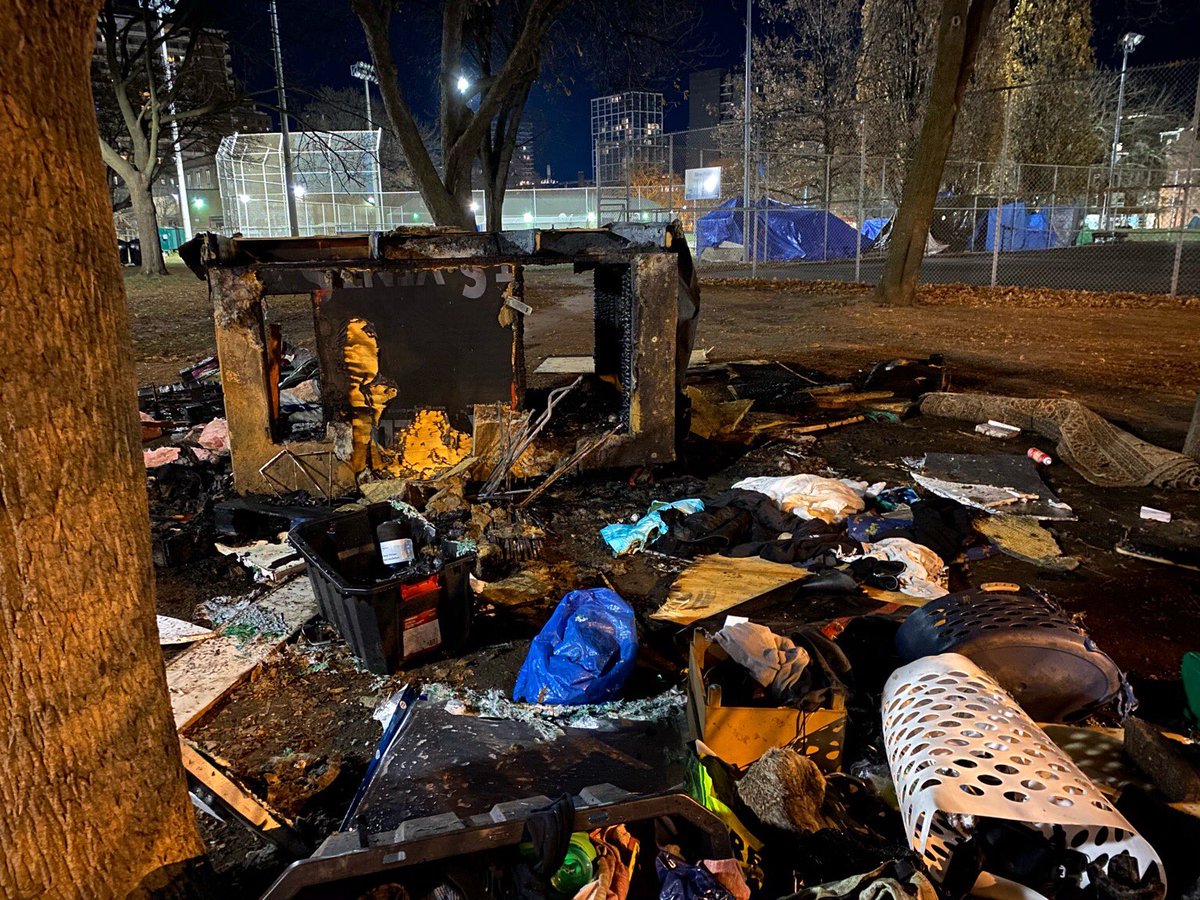
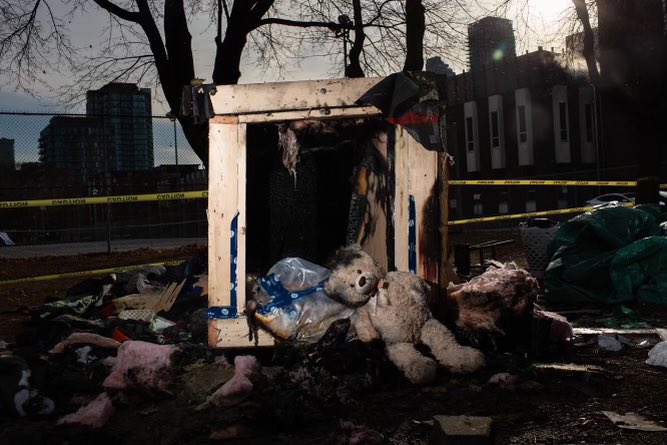
There were <40 tents at Sanctuary (I didn't have an exact count due to being on vacay right before clearing-other factors meant fewer people than previous incl a fire & multiple sexual assaults just before clearing), but City said moved 60+ to hotels. 15/ cbc.ca/news/canada/to…
So that's a 2.5+ average per tent for Moss Park, 1.7+ or so for Sanctuary. And we also have Little Norway Park's clearing. The City says it moved 25 people to hotels on June 10, but there were just 12 tents per my count (which I did up a crude drawing for @ESN_TO ahead of) 16/
https://twitter.com/joe_cressy/status/1270868644571090945
So let's say the @cityoftoronto @JohnTory count of 400+ tents is accurate. Clearly that means 800 or more people in tents + minimum 200+ outdoors/TTC w/o tents. 17/
This tracks with the figures we get from outreach organizations covering every square inch of the City except the Islands. We therefore have two independently, quite reliable ways to get to 1000+ minimum for people w/o home or shelter in Toronto right now. 18/
But the City is planning space for just 560 people (many of which are now open and occupied - the Better Living Center's 100 spaces are now full, for instance, per data received yesterday). 19/
The @CityofToronto, Gord Tanner, Mary-Anne Bedard, @JohnTory, @shelleycarroll, @joe_cressy etc. also acknowledged an eye-popping stat yesterday. Toronto is producing about 600 new homeless people a month. 560 spaces (filling up already) isn't going to cut it. 20/
We have 1000+ (maybe 2000) outdoors in tents or otherwise or on TTC for their regular sleeping. Toronto is producing another 600 homeless per month. Hotel-shelters have about a 50% retention rate (per same presentation). Evictions from housing are ramped up. #DisasterLooms 21/21
(I should add that @c_shadowspaces and I visited more than 40 sites with over 340 tents or similar structures total between mid October and mid November for this count. We visited for 1st time or revisited 85% of these tents between Nov 15-18.)
Separate thread ... scroll through pics and video. We went everywhere hunting down tent locations (the ones we think likely really hidden from the City aren’t here or are done in a way to not give away location).
https://twitter.com/djjohnso/status/1336457018488614913
• • •
Missing some Tweet in this thread? You can try to
force a refresh