Trevor Bedford Profile picture
10 Dec, 14 tweets, 6 min read
The US reported over 3000 deaths from #COVID19 today and the 7-day average of deaths has hit a record with today's average of 2276. Here, I dig into these grim mortality numbers and look at deaths across ages and across weeks in the epidemic. 1/14
I'm using data from @CDCgov (cdc.gov/nchs/nvss/vsrr…) that records weekly deaths involving COVID-19 as well as deaths from all causes. These data use actual date of death but there is a reporting lag. 2/14
CDC reports 261k deaths involving COVID-19 in this dataset. Over half of these deaths are in individuals 75 or older and over three quarters are in individuals 65 or older. 3/14
If we look over time we see the following where COVID-19 associated deaths are shown as colored interval on top of the background of all cause mortality in gray. This is not a stacked plot and so the notable bump in all cause mortality in April is attributable to COVID-19. 4/14
You can see from this that COVID-19 associated deaths are a decent fraction of all cause mortality for individuals over ~35 years. It's also quite obvious that deaths in the past 4 weeks are not fully reported (hence the gray intervals that dive towards zero at the present). 5/14
Still, the increased rate of deaths from the 3rd wave is visible as rising COVID-19 deaths in mid-November. With continued high levels of circulation I fully expect this bump to continual to climb. 6/14
If we look from March to today, we see that COVID-19 associated deaths are ~3.5% of all cause mortality in 25-34 year olds and 9 to 11% of all cause mortality in individuals over 45. 7/14
There hasn't been a marked shift in age distribution of deaths since May. 8/14
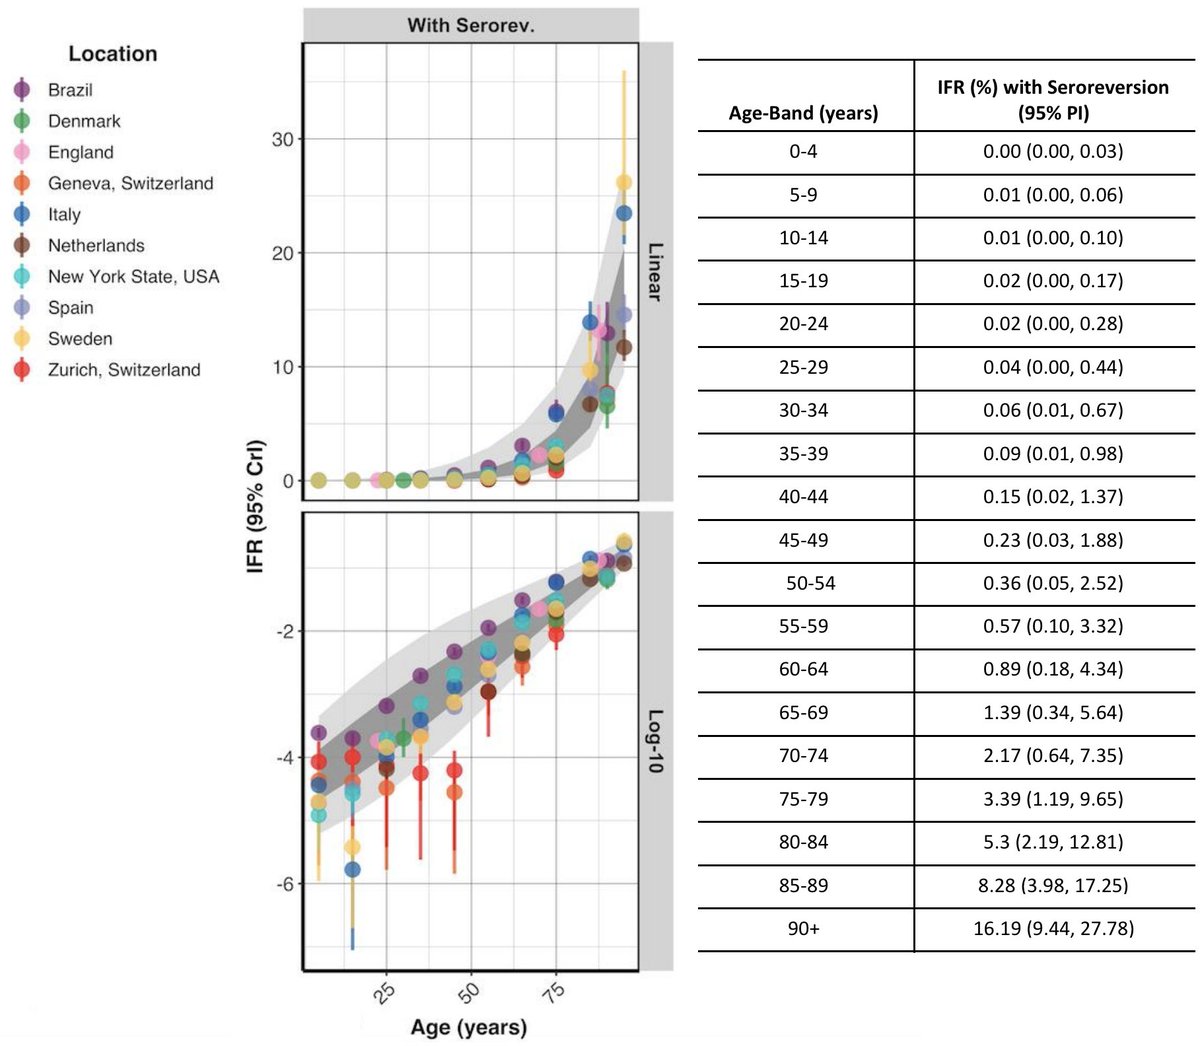
By using age-specific mortality alongside estimates of total infections across age groups from seroprevalence, researchers have estimated the age-specific infection fatality ratio (IFR). 9/14
@nfbrazeau, @lucy_okell and colleagues estimate age-specific IFR ranging from 0.02% in 15-24 year olds to 16% in individuals over 90. Remarkably, IFR against age appears linear on a log scale suggesting risk of death grows exponentially with age. imperial.ac.uk/mrc-global-inf… 10/14
Similarly, @zorinaq compiles age-specific IFR from a number of studies and arrives at similar findings with broad agreement in age-specific IFR estimates. These estimates place COVID-19 IFR at 10-15X that of seasonal influenza in older age groups. github.com/mbevand/covid1… 11/14
One perhaps helpful framing for thinking about these numbers is the difference between absolute and relative risk of death. For example, in the 35-44 year old cohort IFR is estimated to be ~0.12%. However, overall yearly death rate for this cohort without COVID is ~0.24%. 12/14
Thus, getting COVID as a 35-44 year old roughly increases yearly risk of death by 1.5X. So, small in absolute terms, but sizable in relative terms. Using above IFR estimates from @mrc_outbreak gives the following distribution of increased yearly risk of death across ages. 13/14
And if I use a similar approach to roughly estimate increased risk of death across cohorts by assuming 15% of the US has been infected as of Nov 15 (covid19-projections.com) and using above mortality figures, I arrive at the following quite similar estimates. 14/14

• • •

Missing some Tweet in this thread? You can try to force a refresh
 

Keep Current with Trevor Bedford

Trevor Bedford Profile picture

Stay in touch and get notified when new unrolls are available from this author!

Read all threads

This Thread may be Removed Anytime!

PDF

Twitter may remove this content at anytime! Save it as PDF for later use!

Try unrolling a thread yourself!

how to unroll video
  1. Follow @ThreadReaderApp to mention us!

  2. From a Twitter thread mention us with a keyword "unroll"
@threadreaderapp unroll

Practice here first or read more on our help page!

More from @trvrb

12 Dec
Although the US is continuing to hit records for daily #COVID19 cases reported, the rate of exponential growth has slowed. Mortality is still catching up to increased case loads and I expect daily deaths reported to further increase. 1/8
This plot summarizes the overall picture. Bubble size is proportional to daily cases per capita from @COVID19Tracking and bubble color shows Rt from rt.live. Timepoints are shown up to two weeks ago due to delay in reliable estimates of Rt. 2/8
The Midwest and Mountain West had rapid growth during October resulting in large epidemics in November, but they're now starting to plateau or decline in incidence. Although current incidence is lower, the epidemic is still growing in much of the East Coast. 3/8
Read 8 tweets
4 Dec
The US is reporting over 2000 deaths per day from Dec 1 and I believe will do so consistently throughout December based on daily case loads above 120k starting early November. 1/4
A drop in reporting over Thanksgiving weekend has made for some difficulty in directly comparing 7-day averaged deaths, but the trend is clear. Red bars are daily reported deaths from @COVID19Tracking and black line is 7-day sliding average. 2/4
The simple projection of 1.7% of reported cases into deaths 22 days later has remained largely accurate, although drop of reporting during Thanksgiving weekend is quite clear. We'll know soon whether 7-day average returns back to projection. 3/4
Read 4 tweets
1 Dec
I don't think that this study by Basavaraju et al from @CDCgov can be taken as evidence that #COVID19 was circulating in the US in December 2019. 1/10
academic.oup.com/cid/advance-ar…
The authors do a careful serological investigation, but it necessarily suffers from testing a large number of samples with an assay that is not perfectly specific. 2/10
The ELISA used by the authors has a stated specificity of 99.3% and the authors tested 519 "true negative" blood samples collected from 2016 to 2019 from healthy adults and suspected hanta virus patients and observed 3 false positives (0.6%) matching this specificity. 3/10
Read 12 tweets
26 Nov
Another update on #COVID19 circulation in the US. With today's report we're seeing an average of ~172k daily cases reported compared to ~157k a week ago, and we're seeing ~1650 daily deaths reported compared to ~1200 a week ago. 1/10
Although this is still a staggering amount of cases and growing daily, the rate of growth at the US level appears to be (at least temporarily) slowing. Here, I've plotted data from @COVID19Tracking, showing daily cases in the US on a log scale alongside 7-day moving average. 2/10
Throughout October we saw steady exponential growth of the US epidemic (indicated by linear-on-a-log-scale dynamics and shown in the graph as the dashed straight line). Early November outpaced this steady growth but has recently slowed. 3/10
Read 10 tweets
19 Nov
When I ran these simple lagged case fatality rate (CFR) calculations last week I was surprised and troubled at how big the predicted numbers of deaths in the coming weeks were. Since then #COVID19 daily case counts have continued to rise. 1/10
@alexismadrigal and @whet describe in much better detail the simple logic behind this calculation here: theatlantic.com/science/archiv… and they do a thorough job investigating assumptions of the method. 2/10
Ryan Tibshirani with the Carnegie Mellon Delphi Research Group very helpfully did an independent replication of the method here: htmlpreview.github.io/?https://githu…. 3/10
Read 10 tweets
17 Nov
Today's announcement of ~95% efficacy in the @moderna_tx #COVID19 vaccine trial is amazing, auspicious news. 1/8
statnews.com/2020/11/16/mod…
This coupled with the announcement of >90% efficacy in the @pfizer / @BioNTech_Group vaccine trial is encouraging that these mRNA vaccines have huge promise. 2/8
statnews.com/2020/11/09/cov…
One small note about these trials. It's often assumed that vaccines are only a proxy for immune response to natural infection. However, there's nothing that prevents vaccines from inducing better, more durable protection than natural infection. 3/8
Read 8 tweets

Did Thread Reader help you today?

Support us! We are indie developers!


This site is made by just two indie developers on a laptop doing marketing, support and development! Read more about the story.

Become a Premium Member ($3/month or $30/year) and get exclusive features!

Become Premium

Too expensive? Make a small donation by buying us coffee ($5) or help with server cost ($10)

Donate via Paypal Become our Patreon

Thank you for your support!

Follow Us on Twitter!