THREAD: Global Carbon Budget 2020
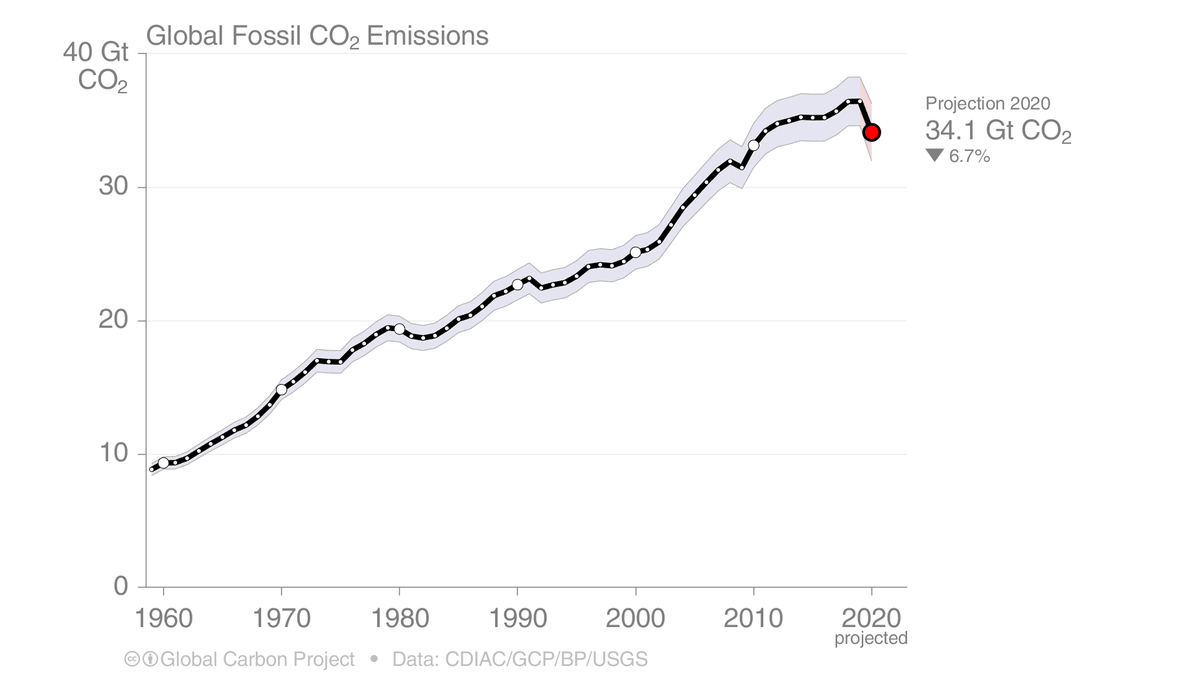
An unprecedented 2.4 GtCO₂ (7%) drop in emissions in 2020 due to COVID19 restrictions. But, daily emissions are already edging up towards levels last seen in late 2019.
#CarbonBudget globalcarbonproject.org/carbonbudget/i…
An unprecedented 2.4 GtCO₂ (7%) drop in emissions in 2020 due to COVID19 restrictions. But, daily emissions are already edging up towards levels last seen in late 2019.
#CarbonBudget globalcarbonproject.org/carbonbudget/i…
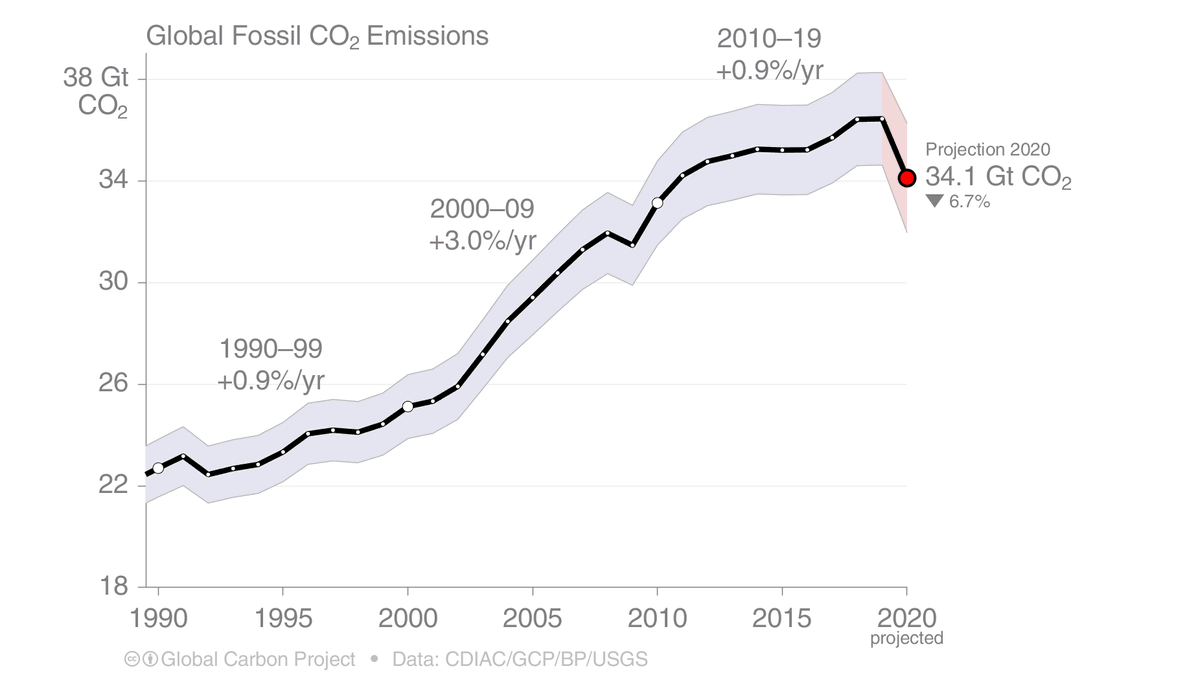
2. A drop of 2.4 GtCO₂ has not been seen before, but emissions have not been this high either.
After the global financial crisis emissions increased 1.7GtCO₂ in 2010. Will this record increase be surpassed in 2021?
Relative changes of >±7% were common before 1950...
After the global financial crisis emissions increased 1.7GtCO₂ in 2010. Will this record increase be surpassed in 2021?
Relative changes of >±7% were common before 1950...
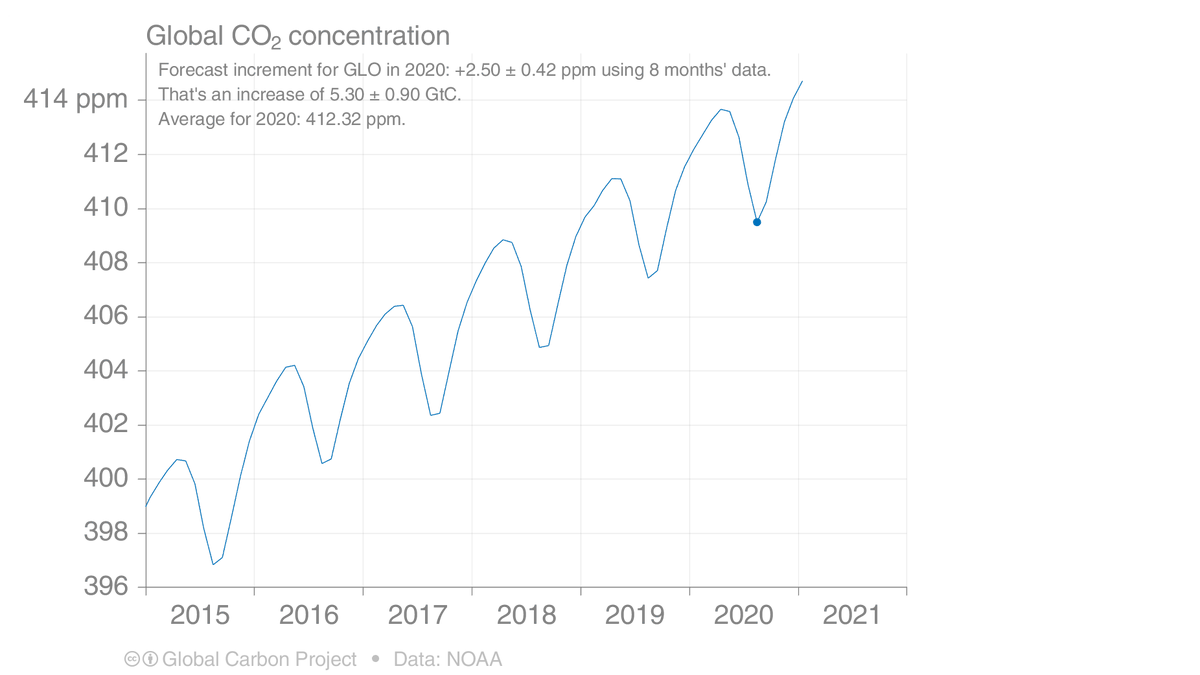
3. Despite the rapid change in emissions, atmospheric CO₂ concentrations continued up as if COVID19 never happened.
Why?
* Emissions were high, as high as in 2012
* The relative change is smaller than interannual variability
* CO₂ is cumulative, so total emissions matter
Why?
* Emissions were high, as high as in 2012
* The relative change is smaller than interannual variability
* CO₂ is cumulative, so total emissions matter
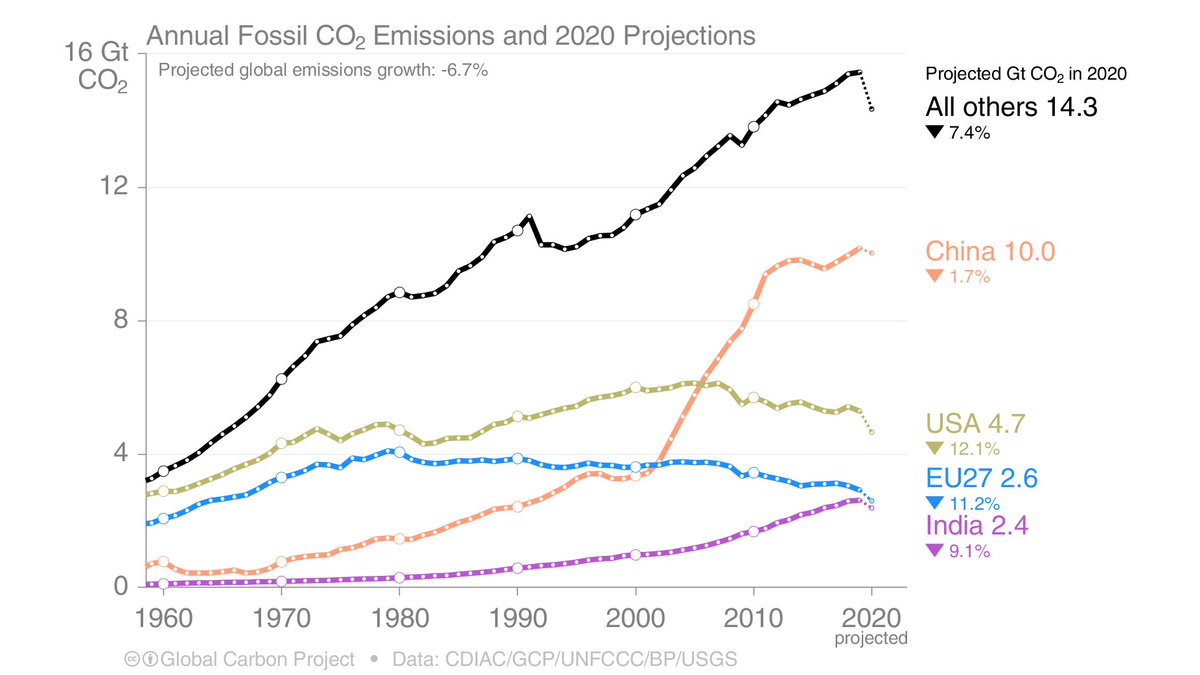
4. We used the median of four methods to estimate the emission changes in each region.
Emissions declined everywhere, but the changes are superimposed on pre-existing trends.
Emissions declined everywhere, but the changes are superimposed on pre-existing trends.
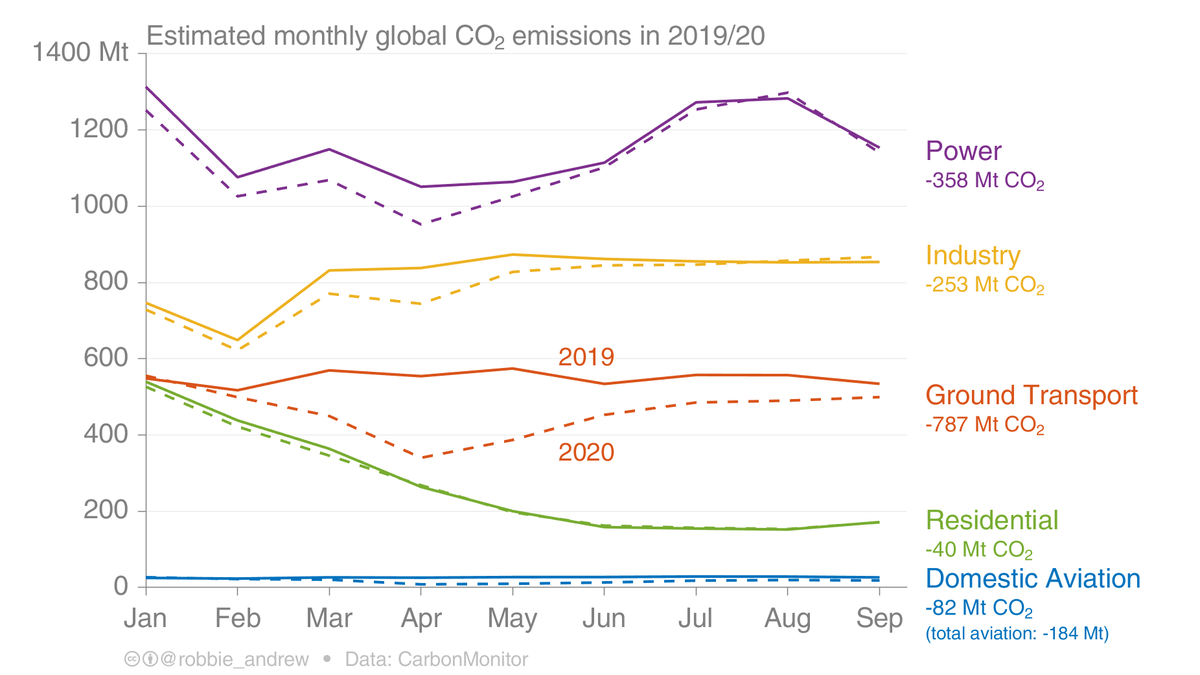
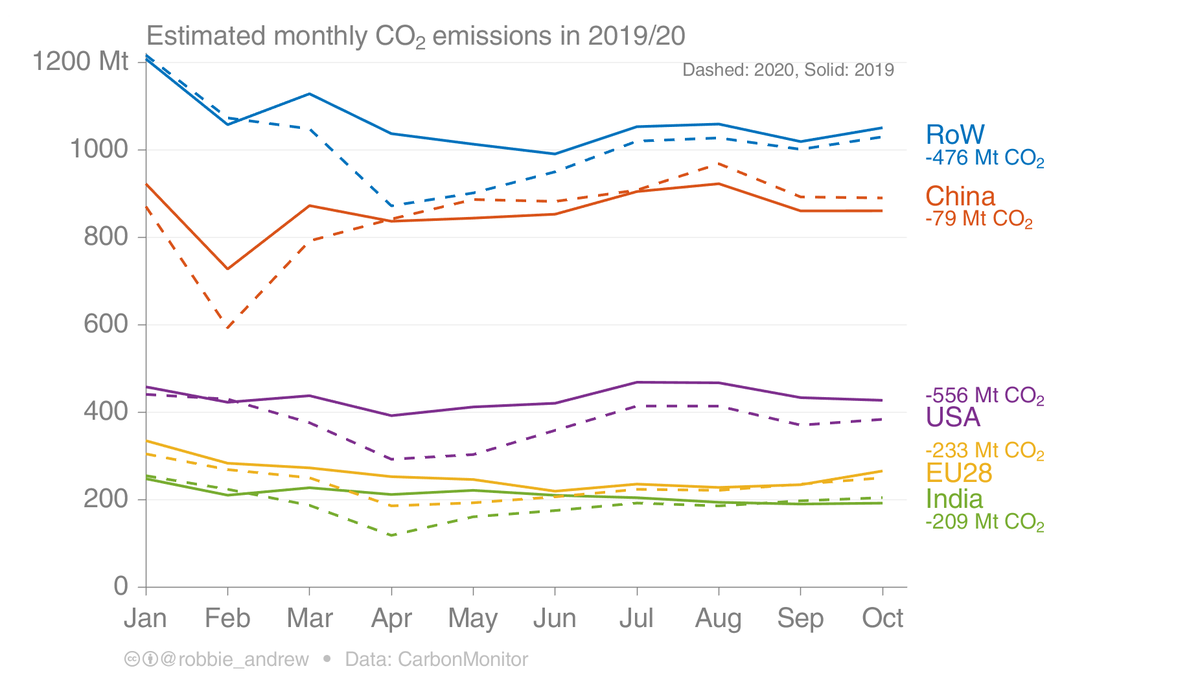
5. All datasets show the biggest changes occurring in transportation.
@CarbonMonitor shows that most other sector have recovered & are now similar to 2019 levels, but transport remains below 2019 levels.
@CarbonMonitor shows that most other sector have recovered & are now similar to 2019 levels, but transport remains below 2019 levels.
6. All countries had a marked decline in emissions in the first wave, but the second wave has a much smaller decline in emissions.
@CarbonMonitor shows China, & globally, heading back to 2019 levels.
@CarbonMonitor shows China, & globally, heading back to 2019 levels.
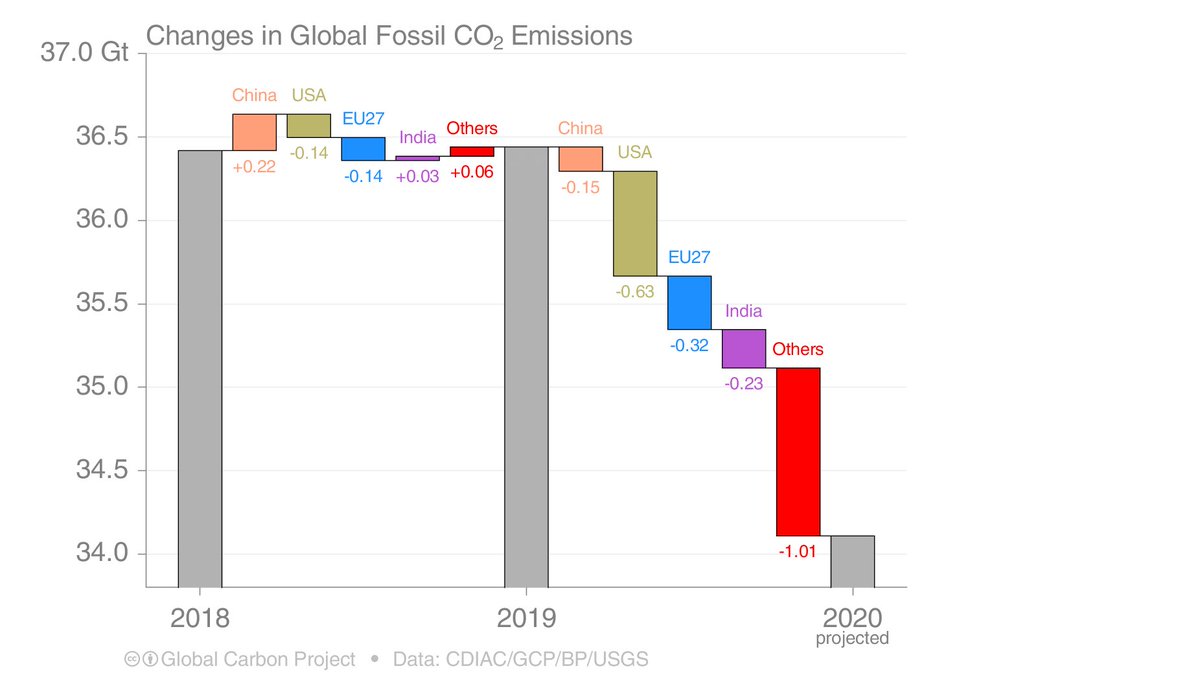
7. All charts look crazy in 2020. Instead of analyzing the battle between countries with rising & falling emissions (2019), to see if emissions peaked, we are analyzing how large the drops were in key countries (2020).
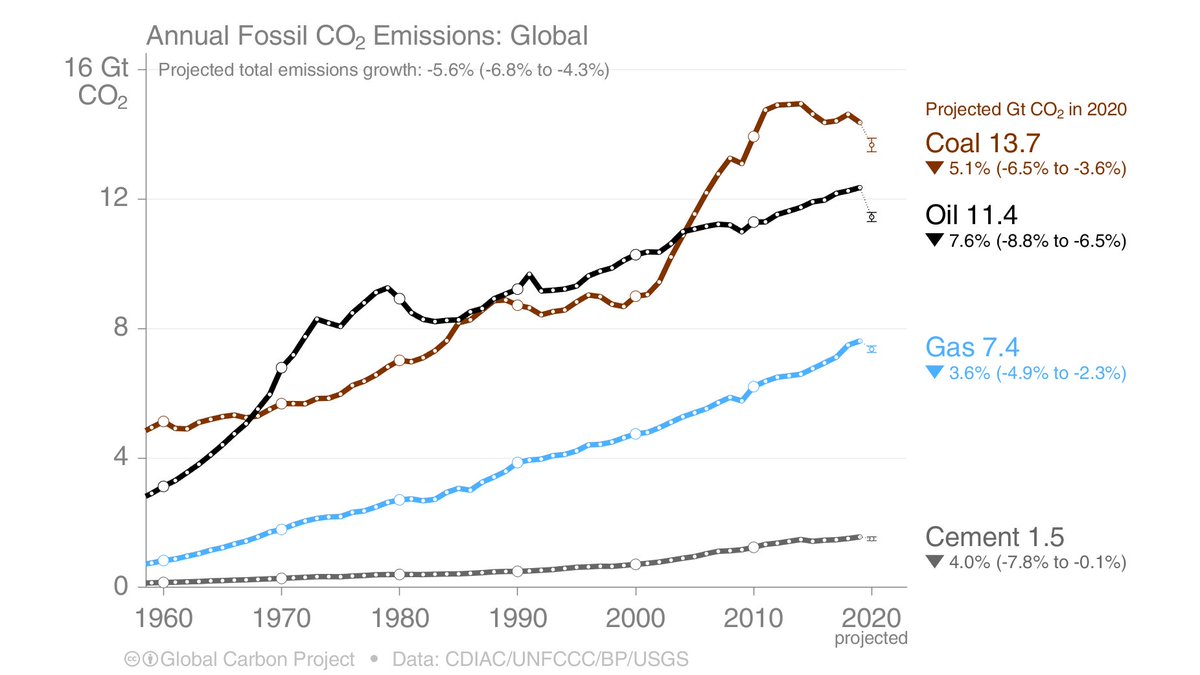
8. Using GCP estimates based on monthly data:
* Oil had the biggest drop due to its use in transport
* Coal was already struggling, & maybe COVID will just push coal further into decline
* Growth in gas was accelerating, & unfortunately, may bounce straight back up
* Oil had the biggest drop due to its use in transport
* Coal was already struggling, & maybe COVID will just push coal further into decline
* Growth in gas was accelerating, & unfortunately, may bounce straight back up
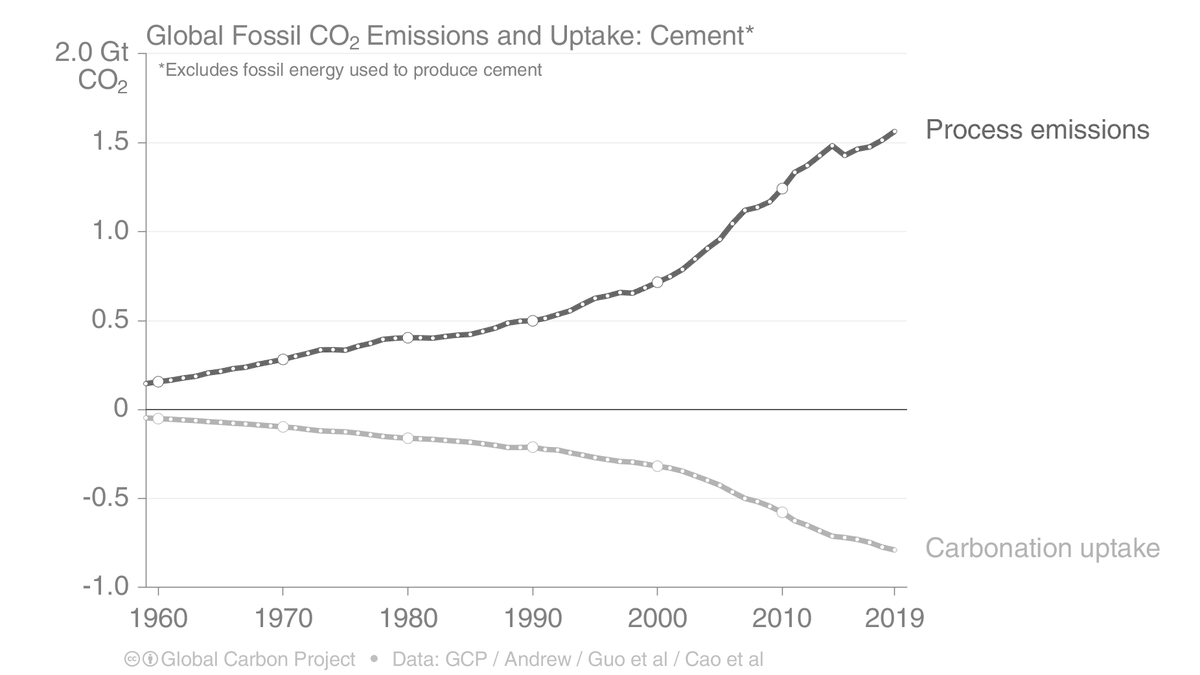
9. A new element in the 2020 edition, is the inclusion of cement carbonation.
Cement slowly takes up CO₂ over time acting as a sink in the global carbon budget. Now included...
Cement slowly takes up CO₂ over time acting as a sink in the global carbon budget. Now included...
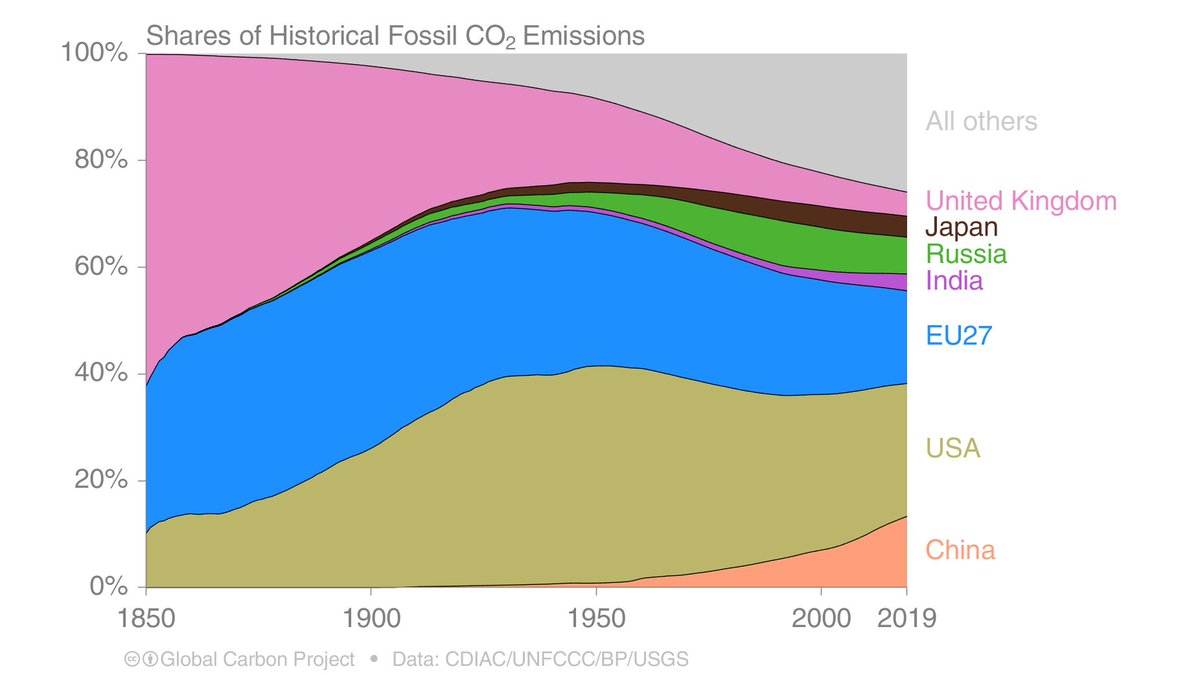
10. As an intermission, the funniest (?) part of the Global Carbon Budget 2020?
#Brexit
(previously the pink & blue were combined, so historical cumulative emissions in the EU will drop after #Brexit)
#Brexit
(previously the pink & blue were combined, so historical cumulative emissions in the EU will drop after #Brexit)
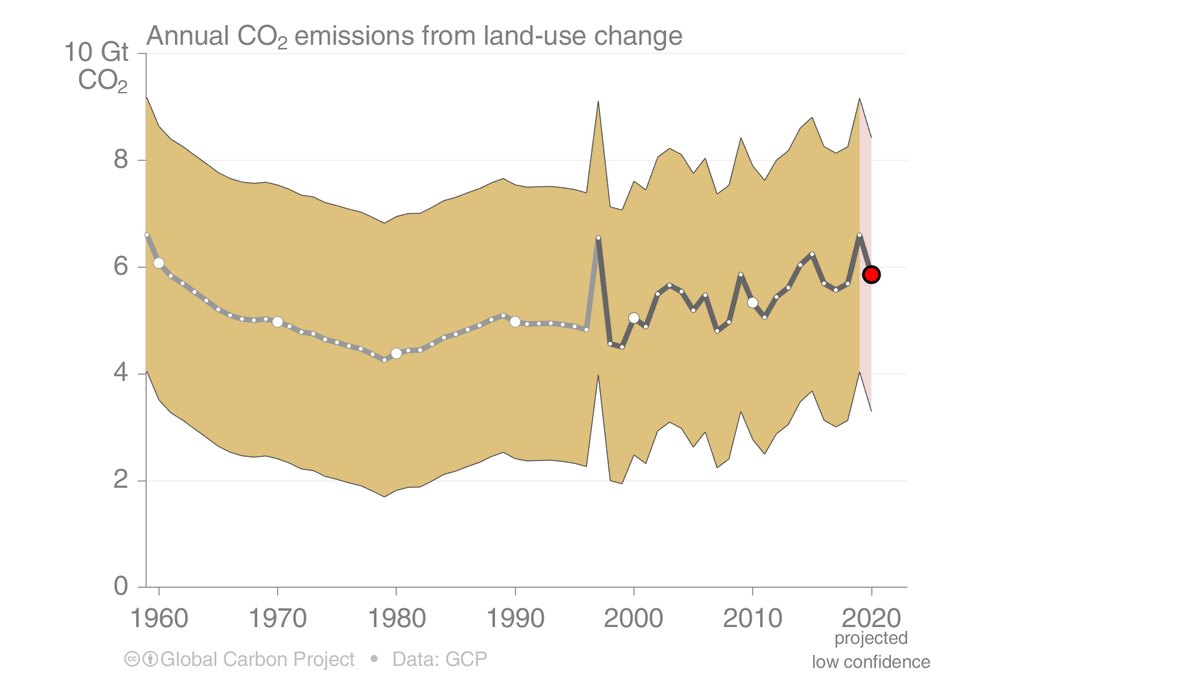
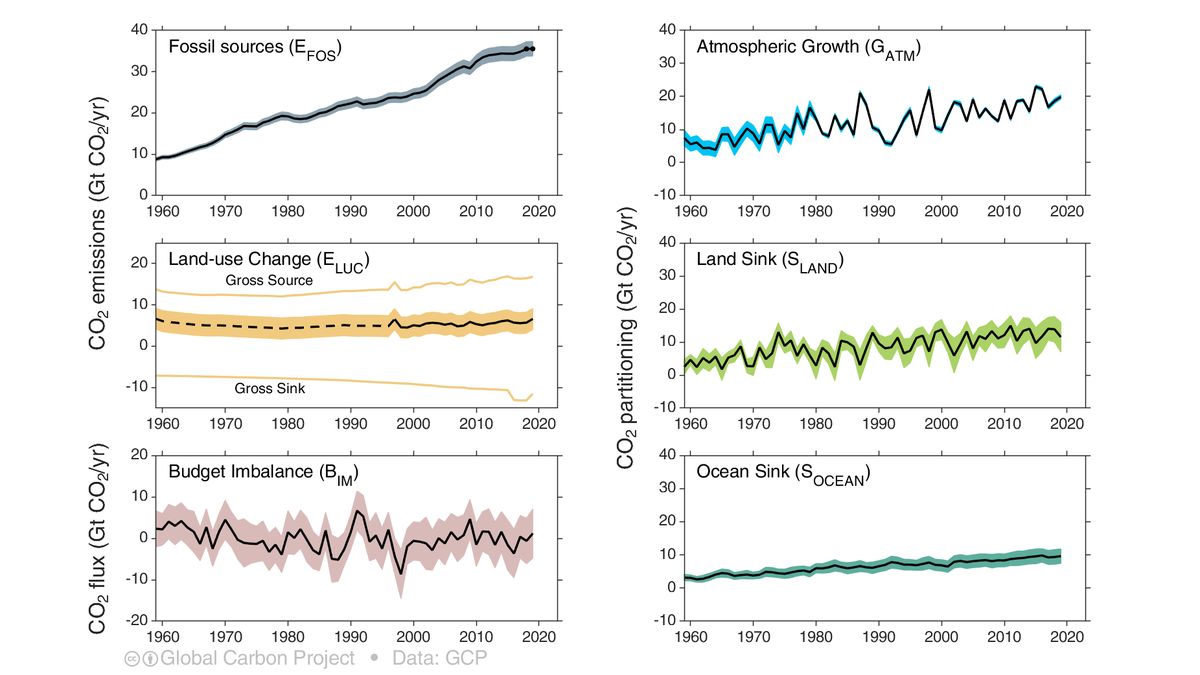
11. Emissions from land-use change are in line with decade trend, despite massive fires around the world.
Some fires, eg Australia, were not related to land-use change & are shown elsewhere in the budget.
Other fires, eg Amazon, relate to LUC & are included here
Some fires, eg Australia, were not related to land-use change & are shown elsewhere in the budget.
Other fires, eg Amazon, relate to LUC & are included here
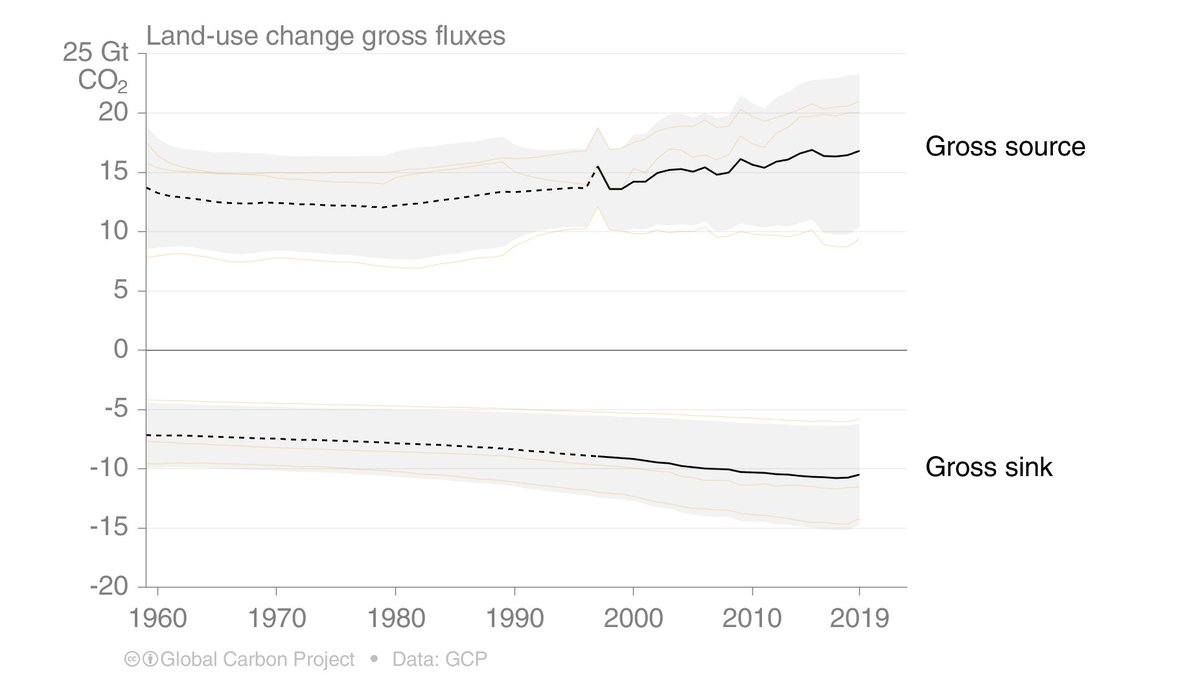
12. Another new element in the 2020 edition is the use of gross land fluxes:
* Gross positive fluxes (eg deforestation) are ~16GtCO₂/yr
* Gross negative fluxes (eg agricultural abandonment) are ~10GtCO₂/yr
* These combine to give ~6GtCO₂/yr (previous tweet)
* Gross positive fluxes (eg deforestation) are ~16GtCO₂/yr
* Gross negative fluxes (eg agricultural abandonment) are ~10GtCO₂/yr
* These combine to give ~6GtCO₂/yr (previous tweet)
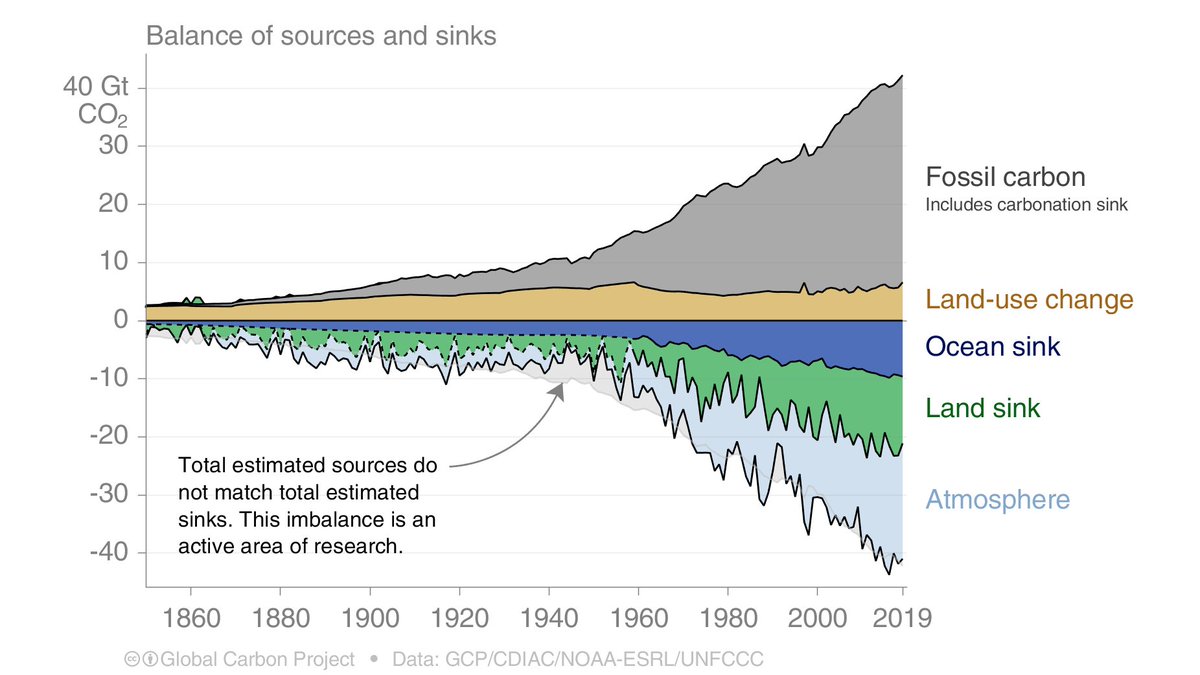
13. The Global Carbon Budget is the balance of the sources (fossils, LUC) & sinks (land, ocean) with the excess remaining in the atmosphere & causing climate change.
The sinks continue to take up around 55% of the emissions... (Thank the sinks for cleaning up our mess)
The sinks continue to take up around 55% of the emissions... (Thank the sinks for cleaning up our mess)
14. The study of the Global Carbon Budget is a major activity.
The simple lines in each subplot are based on decades of work of 100s, if not 1000s, of people. Each year we improve our understanding, which is why we do this.
The simple lines in each subplot are based on decades of work of 100s, if not 1000s, of people. Each year we improve our understanding, which is why we do this.
15. There will be many more threads to follow this one, this is just an appetizer.
For now, check out the
Website: globalcarbonproject.org/carbonbudget/i…
Paper: essd.copernicus.org/articles/12/32…
Downloadable figures: folk.universitetetioslo.no/roberan/GCB202…
/end
For now, check out the
Website: globalcarbonproject.org/carbonbudget/i…
Paper: essd.copernicus.org/articles/12/32…
Downloadable figures: folk.universitetetioslo.no/roberan/GCB202…
/end

• • •
Missing some Tweet in this thread? You can try to
force a refresh